Downloaded by [b-on: Biblioteca do conhecimento online UC], [Pedro Henriques Abreu] at 03:04 28 May 2013
International Journal of Computational Intelligence Systems, Vol. 6, No. 5 (September, 2013), 893-910
Using Multivariate Adaptive Regression Splines in the Construction of Simulated Soccer Team’s Behavior Models
´ Pedro Henriques Abreu 1 Daniel Castro Silva 1 Jo˜ao Mendes-Moreira 2 Lu´ıs Paulo Reis 3 Julio 4 Garganta
1
Department of Informatics Engineering, University of Coimbra, Center for Informatics and Systems (CISUC), P´olo II, Pinhal de Marrocos, Coimbra, 3030-290, Portugal∗ pha,
[email protected] 2
Department of Informatics Engineering, Faculty of Engineering, University of Porto, Artificial Intelligence and Decision Support Lab. (LIAAD-INESC TEC) R. Dr. Roberto Frias, s/n, Porto, 4200-465, Portugal
[email protected] 3
Department of Information Systems, School of Engineering, University of Minho Campus de Azur´em, Guimar˜aes, 4800-058, Portugal Artificial Intelligence and Computer Science Lab. (LIACC), University of Porto, Portugal
[email protected] 4
Sport Science Department, Faculty of Sport, University of Porto, Rua Dr. Pl´acido Costa, 91, Porto, 4200.450, Portugal
[email protected]
Received 14 May 2012 Accepted 9 March 2013
∗ Corresponding
Author:
[email protected]
Co-published by Atlantis Press and Taylor & Francis Copyright: the authors 893
Abreu, P.H., Silva, D.C., Moreira, J. M., Reis, L. P., Garganta, J.
Downloaded by [b-on: Biblioteca do conhecimento online UC], [Pedro Henriques Abreu] at 03:04 28 May 2013
Abstract In soccer, like in other collective sports, although players try to hide their strategy, it is always possible, with a careful analysis, to detect it and to construct a model that characterizes their behavior throughout the game phases. These findings are extremely relevant for a soccer coach, in order not only to evaluate the performance of his athletes, but also for the construction of the opponent team model for the next match. During a soccer match, due to the presence of a complex set of intercorrelated variables, the detection of a small set of factors that directly influence the final result becomes almost an impossible task for a human being. In consequence of that, a huge number of software packages for analysis capable of calculating a vast set of game statistics appeared over the years. However, all of them need a soccer expert in order to interpret the produced data and select which are the most relevant variables. Having as a base a set of statistics extracted from the RoboCup 2D Simulation League log files and using a multivariable analysis, the aim of this research project is to identify which are the variables that most influence the final game result and create prediction models capable of automatically detecting soccer team behaviors. For those purposes, more than two hundred games (from 2006-2009 competition years) were analyzed according to a set of variables defined by a soccer experts board, and using the MARS and RReliefF algorithms. The obtained results show that the MARS algorithm presents a lower error value, when compared to RReliefF (from a pairwire t-test for a significance level of 5%). The p-value for this test was 2.2e-16 which means these two techniques present a significant statistical difference for this data. In the future, this work will be used in an offline analysis module, with the goal of detecting which is the team strategy that will maximize the final game result against a specific opponent. Keywords: Knowledge Discovery from Historical Data; Data Mining; Feature Selection; Soccer Simulation
1.
Introduction
In competitive sports, and consequently soccer, the level of performance is determined by a set of complex intercorrelated variables: Technique (coordination abilities, kinetic skillfulness), Tactics (cognitive and planning abilities), Psychological factors (motivation, desires, willingness) and Fitness 41 . The behavior of players and the decision making processes can range from the most simple reactive behaviors, such as running towards the ball, to complex reasoning that take into account the behavior and perceived strategies of both teammates and opponents 22 . Grehaigne et al. 16 describe the essence of the game as ’a team must coordinate its actions to recapture, conserve and move the ball so as to bring it within the scoring zone and to score a goal’. It is extremely important that this coordination involves teamwork (involving all the team members with the same joint goals and intentions). During a soccer match, the coach can become the recipient of a great amount of information; as a result, he might not be able to evaluate and objectively exploit all the technical and tactical elements that may come along 11 . In recent years, the
growing need and interest in performance analysis have led to new forms of match analysis techniques. Modern-day techniques include video-based statistical analysis systems, video-based tracking and electronic tracking systems 5,14,1,2 . Nowadays, there are many types of analysis software, capable of calculating a huge amount of game statistics. However, they still transfer this data to the training session and, not rarely, different software systems analyzing the same data produce different results, as shown by Randers et al. 33 , which means that depending on the analysis software being used, the user can obtain contradictory information about his next opponent. To minimize this problem and attending that it will be impossible to conduct comparative tests between commercial software, in this research work a group of almost sixty game statistics were defined according to a soccer experts board, composed by a group of renowned sports researchers and university professors. Using such approach, the used soccer definitions are expected to be more consensual and consequently can have a larger acceptance in both academic and professional contexts. Due to the fact that in many situations through-
Co-published by Atlantis Press and Taylor & Francis Copyright: the authors 894
Downloaded by [b-on: Biblioteca do conhecimento online UC], [Pedro Henriques Abreu] at 03:04 28 May 2013
Using MARS to Construct Simulated Soccer Team Behavior Models
out the soccer competitions the time to prepare the team for the next match (opponent) is too short, and considering that it is impossible for a human to process all the information produced by the analysis software, the variable ”diference of scored goals” has, over the years, and for natural reasons, received considerable attention in notational analysis 21 . However, in modern soccer, thanks to the competitiveness of the teams, the variance of goals is not large enough to identify statistically significant differences 23 ; consequently, it would be impossible to classify the performance of one player or even a team using only scored goals or even the difference of scored goals as a measure unit 20,10,29 . Because of this, a different operationalization of the dependent variable has to be suggested in order to understand the game logic, allowing a team to use the opponent’s strategy to adapt its own 3,32,17 . At this point, a research question appears: ’what are the variables that most influence the final game result and consequently improve team performance?’. Before attempting to answer this question, it is important to define what a performance indicator is. A performance indicator is defined as a selection, or combination of action variables that aims to define some or all aspects of a performance 19 . These performance indicators have to be highly correlated with success (in this case, scored goals). Nevertheless, it is very difficult to precisely identify victory and defeat factors in soccer, owing to its fortuitous nature. If the different forms of players’ activities were learned and information about player’s behavior during a game are collected, it may be possible to determine the factors that enable an increased performance. Sun Tzu in his book ’The Art of War’ 17 claims that ”If you know/study your enemy in a hundred battles, you will win all of them”. So the aim of this research project is to identify which are the variables that, together with the scored goals, more directly influence the performance of a soccer team. For this purpose, an automatic software analysis tool was developed, as to calculate almost sixty final game statistics, as defined by a soccer experts board, composed by a group of renowned sports researchers and university professors. Due to the inexistence of real soccer game data, more than two hun-
dred RoboCup 2D Simulation League log files, from 2006 to 2009, have been analyzed. After this analysis stage, two data mining algorithms, Multivariate Adaptive Regression Splines (MARS) 12 and RReliefF 35 have been used in order to explain the difference of scored goals through the used final game statistics. The achieved results were very promising and both techniques present a coefficient of determination (RSq) greater than 80%. Regarding the error analysis, the MARS algorithm presents better results, when compared to RReliefF. In the future, this research work will be included in a large soccer analysis project, in both offline and online analysis models. The remainder of this paper is organized as follows: Section 2 exposes the modeling environment used in this project. Section 3 presents the statistical tool that was created to calculate the final game statistics and section 4 presents a brief introduction about the MARS and RReliefF algorithms. Section 5 describes the related work in this research area. Section 6 exposes the results achieved and finally in the last section a discussion is presented and final conclusions are presented. 2.
The modeling environment
The aim of this section is to clarify the modeling environment where the data used in this study was produced. In this section, an overview of a wellknown RoboCup competition will be made, focusing mainly on the 2D Simulation League. 2.1. The RoboCup competition overview RoboCup 25,27 is an international research and educational project whose main objective is the promotion of artificial intelligence (AI) and Intelligent Robotics. Basically, the research problem behind this project is Robotic Soccer, where a number of distinct technologies is needed to construct a robotic or virtual team capable of playing a soccer game with a set of distinct rules. The original idea of Robotic Soccer is introduced in 1992 by Alan Mackworth 30 . In parallel, in the city of Tokyo, a group
Co-published by Atlantis Press and Taylor & Francis Copyright: the authors 895
Downloaded by [b-on: Biblioteca do conhecimento online UC], [Pedro Henriques Abreu] at 03:04 28 May 2013
Abreu, P.H., Silva, D.C., Moreira, J. M., Reis, L. P., Garganta, J.
of Japanese researchers promoted a workshop related to the use of soccer for the research community, especially in AI areas. Also, some Soccer Robotic prototypes and a simulator project are defined. The result is the creation of a Robotic League called Robotic J-League (inspired in the name of the professional Human Soccer League). After its huge success, this project became an international project with the name of Robotic World Cup Initiative - RoboCup. In order to promote the investigation in this field, a long term objective was proposed: by the year 2050 a humanoid Robotic team will be capable of defeating the world champion Human team in a soccer match according to FIFA rules 26 . Although this objective seems to be a bit unrealistic today, others are that can be established and can constitute a base for future projects, such as the creation of Robotic Soccer teams with identical style and play behaviors, when compared to Human teams, or the creation of teams capable of playing a soccer match against a Human team (not necessarily the world champion team). RoboCup Soccer contains many Leagues that can be grouped in two major categories: Robotic Leagues (that include small size, middle size, standard platform and humanoid Leagues) and Simulation Leagues (2D and 3D), where all agents are virtual. Each League has its own more specific objectives. Some are more related to location and information extraction problems (medium size Robotic Leagues), while others are more related to precision and faster Robotics (small size Robotics Leagues), or even to coordination process between a set of heterogeneous agents (Simulation Leagues). Beyond these Leagues, others have emerged with different challenges, such as the Humanoid League, Coach Simulation, Intelligent Sports Commentator and 3D Visualizers. The main purpose in the Humanoid League is to develop, in a long-term, a humanoid team capable of defeating a Human Soccer team; in the Coach Simulation, a game analysis system should be able to, in the middle of a match (real time decision), modify the behavior of a soccer team. In the Intelligent Sports Commentator League, a virtual commentator will be developed with the intention of commenting each event of a soccer match and, finally, in the
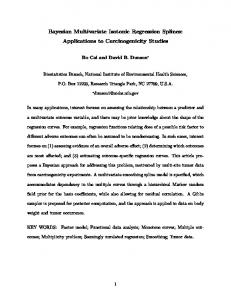
Visualizer 3D League the main goal is to construct three-dimensional game viewers, including realistic animation and sound. In the past few years, some other challenges based in the Robotic Soccer have emerged, such as RoboCup Rescue 28 , whose main objective is to encourage the RoboCup researchers to expand their knowledge and motivation in other areas like personal digital assistants, rescue strategies or Robotic systems (involving planning and execution of rescue missions, or agent/robot coordination). Another interesting project is RoboCup Junior 37 , whose main objective is to increase the interest of young people in Science and Technology. Normally this project constitutes the first contact between this young population and the Robotics world. Figure1 shows a taxonomy/distribution of the RoboCup Leagues by category. 2.2. The RoboCup 2D Simulation League Encompassed in the RoboCup competition, the 2D Simulation League simulates a confrontation between two virtual teams, each composed by eleven agents. Their goal is to attain the best possible final result, which consists in scoring more goals than their opponent. In order to fulfil that goal, research topics like agent collaboration or strategy acquisition must be incorporated. For each game, all the players (agents) connect to a soccer server that is responsible for simulating the match between the two virtual teams, and, at the end, for generating a log file. This file contains information regarding the match, such as: •
•
Perception Information - This kind of information is split into three distinct groups: auditory, visual and sensorial data. These groups involve information related with the game cycle, energy/stamina of the athletes, effort spent by the players in a particular action, velocity and acceleration of the athletes, the distance that an object is to the other objects represented in the game field, or head direction, among others; Action Information - This group includes information related to the actions tackled by each player in a specific period of the game. These actions can be related to a kick, tackle, move to
Co-published by Atlantis Press and Taylor & Francis Copyright: the authors 896
Using MARS to Construct Simulated Soccer Team Behavior Models
Downloaded by [b-on: Biblioteca do conhecimento online UC], [Pedro Henriques Abreu] at 03:04 28 May 2013
RoboCup Leagues Soccer
Rescue
@Home
Junior
Demonstrations
Simulation League
Simulation League
Soccer
Nanogram
Small Size League
Robot League
Dance
Mixed Reality
Rescue
Festo Hockey Challenge Cup
Middle Size League
Standard Platform League Humanoid League
Figure 1: RoboCup Soccer Leagues a specific field position, or turn-neck movement (among others). These log files are processed by an automatic statistical tool (explained in section 4) and, after that, two data mining algorithms were used in order to identify the most relevant features in order to fulfil the match goal (previously mentioned). It is important to note that these Robotic log files were used in this project but all the process used in this work (algorithms used and the set of final game statistics defined) can be expanded to a real soccer scenario. 3.
A statistical extracting tool
In this project, a soccer tool capable of extracting final game statistics (using the games logs) was developed. Taking as a base the SoccerScope 2 software †, new features were implemented capable of fulfilling the expectations of the soccer experts. Using a sequential temporal analysis, a set of almost sixty statistics was defined (implemented using Java language). It is also important to note that the col† More
lected set of statistics was previously validated by a board, composed by sport experts. Generically, these statistics can be divided into five groups: Pass, Shot, Goals, Set Pieces and Ball Possession, as ilustrated in Table 1. 3.1. Pass A successful pass occurs when a kick is executed by a soccer player and after a few cycles a teammate receives the ball without a player from the opposing team intercepting it. In this work, the number of successful passes in each part of the match is analyzed as well as those passes that are intercepted by a player from the opposing team. Other variations of the pass that were also detected in this work are the ”wing chain” and ”pass chain”. In order to detect the ”wing chain” event, the soccer field was split into three equal regions/corridors: left, middle and right. If the event algorithm detects a successful pass between two teammates and if this pass occurs between the left and the right regions (or viceversa), the algorithm will classify it as a successful
informations available at http://ne.cs.uec.ac.jp/~koji/SoccerScope2/index.htm
Co-published by Atlantis Press and Taylor & Francis Copyright: the authors 897
Abreu, P.H., Silva, D.C., Moreira, J. M., Reis, L. P., Garganta, J.
Table 1: Game Statistics
Downloaded by [b-on: Biblioteca do conhecimento online UC], [Pedro Henriques Abreu] at 03:04 28 May 2013
Group
Pass
Shot
Goal
Set Piece
Ball Possession
Acronym Year 1-GoodPassTot 1-GoodDef 1-GoodOff 2-GoodPassTot 2-GoodDef 2-GoodOff 1-BadPassTot 1-BadDefDefensive 1-BadOff 2-BadPassTot 2-BadDef 2-BadOff PassChain WingChain 1-Shot 1-IntShot 1-ShotTarget 2-Shot 2-IntShot 2-ShotTarget GoalsTot 1-Goals 2-Goals PenBoxBack PenArea OutPenArea GoalsOpp OutTot 1-GoalKick 1-Corner 1-ThrowIn 2-GoalKick 2-Corner 2-ThrowIn 1-Offside 2-Offside 1-OffInt 2-OffInt BroAtt FasAtt MedAtt SloAtt AttTot 1-LeftBposs-Def 2-LeftBposs-Def 3-LeftBposs-Attack 4-LeftBposs-Attack 1-MiddBposs-Def 2-MiddBposs-Def 3-MidBposs-Attack 4-MidBposs-Attack 1-RightBposs-Def 2-RightBposs-Def 3-RightBposs-Attack 4-RightBposs-Attack
Definition Competition Year Total number of successfully executed passes in the first half of the game Total number of successful passes in the first half of the game executed in the defensive zone Total number of successful passes in the first half of the game executed in the offensive zone Total number of successfully executed passes in the second half of the game Total number of successful passes in the second half of the game executed in the defensive zone Total number of successful passes in the second half of the game executed in the offensive zone Total number of missed passes in the first half of the game Total number of missed passes in the first half of the game executed in the defensive zone Total number of missed passes in the first half of the game executed in the offensive zone Total number of missed passes in the second half of the game Total number of missed passes in the second half of the game executed in the defensive zone Total number of missed passes in the second half of the game executed in the offensive zone Total number of consecutive passes executed by a team Total number of successful passes between two defined regions Total number of shots executed in the first half of the game Total number of intercepted shots in the first half of the game Total number of shots on target executed in the first half of the game Total number of shots executed in the second half of the game Total number of intercepted shots in the second half of the game Total number of shots on target executed in the second half of the game Total number of goals scored Total number of goals scored in the first half of the game Total number of goals scored in the second half of the game Total number of goals scored from inside the Penalty Box Area Total number of goals scored from inside the Penalty Area Total number of goals scored from outside the Penalty Area Total number of goal opportunities Total number of outside situations Total number of goal kicks in the first half of the game Total number of corners in the first half of the game Total number of Throw-ins in the first half of the game Total number of goal kicks in the second half of the game Total number of corners in the second half of the game Total number of Throw-ins in the second half of the game Total number of offsides in the first half of the game Total number of offsides in the second half of the game Total number of intercepted offsides in the first half of the game Total number of intercepted offsides in the second half of the game Total number of broken attacks Total number of fast attacks Total number of medium attacks Total number of slow attacks Total number of attacks Ball possession throughout the first left defensive field zone Ball possession throughout the second left defensive field zone Ball possession throughout the first left offensive field zone Ball possession throughout the second left offensive field zone Ball possession throughout the first middle defensive field zone Ball possession throughout the second middle defensive field zone Ball possession throughout the first middle offensive field zone Ball possession throughout the second middle offensive field zone Ball possession throughout the first right defensive field zone Ball possession throughout the second right defensive field zone Ball possession throughout the first right offensive field zone Ball possession throughout the second right offensive field zone
898
Using MARS to Construct Simulated Soccer Team Behavior Models
Downloaded by [b-on: Biblioteca do conhecimento online UC], [Pedro Henriques Abreu] at 03:04 28 May 2013
pass and a ”wing chain”. The ”pass chain” event consists of identifying the number of successful consecutive passes that a team is capable of completing during a match. 3.2. Shot A shot event occurs when a player, in his attacking midfield, kicks the ball in the direction of the goal line (with a 5 meters margin) with enough force for the ball to reach it. After this kick, if a player from the opposing team intercepts the ball the event is classified as an intercepted shot. Otherwise, two situations can occur: the player’s kick results in a goal or the ball leaves the field. In this last situation, if the ball leaves the field very close to the goal line, the event is classified as a ’shot on target’; otherwise it is considered a ’shot’. 3.3. Goal To detect a goal event using a temporal sequential analysis, three consecutive cycles must be analyzed. In the first cycle, the ball needs to be on the playing field and behind the goal line. In the next cycle the ball needs to be over the goal line. Finally, in the last cycle the ball must have passed the goal line completely. If these conditions occur in the soccer match the event will be detected as a goal event. The number of goals scored in both parts of the game is registered. The region of the field from where the player responsible for the goal has kicked the ball is also registered. In this work, the concept of ”goal opportunities” is created and consists of identifying the situations where an attacking player has a large probability of scoring a goal. The probability calculus is based on the position of the player (inside or outside the penalty area) and the number of players that he has in his view field aligned with the goal line. For each player this probability decreases by 0.2 plus 0.2 if the player is outside the penalty area. 3.4. Set Pieces A Set piece is an extremely important game situation 13 and can be divided as Corners, GoalKicks, Throw-Ins and Fouls. In this work all of
these groups are detected; however, within the Fouls group, only offside situations are classified. 3.5. Ball Possession A soccer team has the possession of the ball in a given interval of time if, during that time, none of the players from the opposing team intercept the ball and the ball does not leave the playing field. To classify ball possession more succinctly, the soccer field was divided into twelve equal parts (six defensive and six offensives). Furthermore, a new concept was introduced which consists in evaluating the time a team takes to get to the last third of the field without losing the ball. This information is extremely relevant in order to classify the offensive style that a team uses during a game. This classification is divided into four levels: slow, medium, fast or break depending on when the opposing team recovers the ball. 4.
Methods
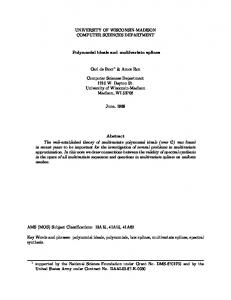
In this section the non-parametric algorithms used in this project are presented. Figure 2 illustrates the relationship between each of the input variables and d the target variable (goals score difference – GSD). From the analysis of this figure one can conclude that the relationships between those variables are non-linear. Due to this fact, it is not possible to use linear regression and the use of other parametric algorithms also does not seem appropriate. The use of non-parametric techniques capable of constructing an evaluation function of the problem with good prediction accuracy was the selection criteria. 4.1. Multivariate Adaptive Regression Splines (MARS) Friedman’s 1991 Multiple Adaptive Regression Splines (MARS) model 12,36 employs recursive partitioning to locate product spline basic functions of adjustable degree, rather than constants. This results in smooth adaptive function approximation as opposed to the crude steps or plateaus provided by regression trees. The method also considers splines involving interactions between previously selected
Co-published by Atlantis Press and Taylor & Francis Copyright: the authors 899
Downloaded by [b-on: Biblioteca do conhecimento online UC], [Pedro Henriques Abreu] at 03:04 28 May 2013
Abreu, P.H., Silva, D.C., Moreira, J. M., Reis, L. P., Garganta, J.
d and each input variables as defined in Table 1 (GSD d is illustrated in x axe and Figure 2: Relation between GSD input variables in y axe respectively) variables, so it can orient its basic functions on other than the original data axis. To aid interpretation, model terms are collected according to their inputs and their influence is reported in an ANOVA manner, namely the effects of individual variables and pairs of variables are collected together and presented graphically as function plots. MARS also employs cross-validation, prunes terms after overgrowing, and can handle categorical variables. MARS builds its models according to Equation 1) where the aim is to sum the weight of basic functions Bi(x) (ci are constant terms). k
fb = ∑ ci Bi (x)
(1)
with a model which consists of just the intercept term. After that and being a greedy algorithm, it will include in the model the basic functions pairs that gives the maximum reduction in sum-of-squares residual error. Each new basic function consists of a term, already in the model, multiplied by a new hinge function which is defined by a variable and a knot. This addition continues until the maximum number of terms or if the change in the residual error is negligible. In order to generalize the model produced in this phase, the backward pass consists in pruning the model. It will remove terms one by one until it reaches the best sub-model, which is measured by the GCV (Generalized Cross Validation) variable.
i=1
The construction of the MARS models is divided into two distinct phases– the forward and the backward passes. In the forward pass the algorithm starts Co-published by Atlantis Press and Taylor & Francis Copyright: the authors 900
Downloaded by [b-on: Biblioteca do conhecimento online UC], [Pedro Henriques Abreu] at 03:04 28 May 2013
Using MARS to Construct Simulated Soccer Team Behavior Models
4.2. RReliefF Algorithm
5.
RELIEF 24 is considered one of the most successful algorithms due to its simplicity and effectiveness 7 . In the beginning, this algorithm was only used in classification problems but over the years its scope has been expanded to the regression problems (with the RReliefF version). Recently it has been proved that this algorithm solves a convex optimization problem aimed at maximizing a margin-based objective function 39,40 .
The modeling of soccer teams is an old research problem in professional soccer. In 1982, Maher 31 tried to model goal scoring using univariate and bivariate Poisson distributions in order to simulate attacking and defensive capabilities used by soccer teams. Although this work was capable of estimating the goal scoring after the match (using final game statistics), it was not able to predict the final result or goal scoring before the match was played. Other studies have tried to quantify the effect of home advantage on match outcomes in the variation of goal scoring 6,8 . Today, in real soccer, many automatic tools exist that are capable of calculating a huge amount of game statistics. One of the most famous ones is the ProZone‡software, which has been used in many research studies, such as the ones presented in 4 and 15 . Although being very powerful in what concerns to the number of calculated statistics, this type of software still presents two major issues: the first one is related to the inexistence of a simulation module, which means that this software requires a soccer expert to interpret the data it produces; the second issue relates to the standardization of the calculation process, which leads to different opponent statistics being generated, depending on the analysis software being used 33 . Also, it is important to note that the ProZone system uses twelve cameras spread over the soccer field in order to calculate statistics. This increased economical investment can be a deterrent factor for poorest/small teams, and in some Leagues the adoption of this system will not be possible due to the dimensions and structural conditions of some soccer fields. In the Robotic environment, also related to opponent modeling, many research works have emerged over the years. Druecker 9 tried to detect the team formation through their players position. However, formation changes in a Robotic team are normally very rare and sometimes (not rarely) a team assumes the same formation in all tournament games. Stone 38 also proposed an approach that modeled the opponent behavior in future actions. Although this approach was able to model an opponent team, it as-
In this research project, the RReliefF algorithm proposed by 35 is used. Generically, this algorithm calculates the weights for each one of the input variables. These weights can be used to obtain a feature weighted distance, guaranteeing that the similarity is measured weighing differently the attributes, according to their relevance to the output variable. Doing a more in-depth analysis of the method proposed by Robnik-Sikonja 35 , at the beginning of the calculation process it is important to define two variables: K - represents the number of K-nearest neighbors; and T - represents the number of iterations. Following the advices of Robnik-Sikonja (to decrease the computation costs and to increase the stability of the weight estimations) in this research project the T and K values were defined as equal to 50 and 10, respectively. In order to calculate the distance between the variables, the researchers have used equation 2, where teq and tdiff are 5% and 10% of the length of the input variable’s value interval (as sugested by the authors), and d represents the absolute difference of the input variable A for the two examples, I1 and I2.
diff(A, I1, I2) =
0 1
d−teq tdiff−teq
: d 6 teq : d > tdiff : teq 6 tdiff
(2)
One final note is concerned to feature selection. In this research, the used filter criteria was suggested by 18 , which selected the features that present a RReliefF weight larger than 0.01. ‡ More
Literature review
informations available at http://www.prozonesports.com/product-prozone3.html
Co-published by Atlantis Press and Taylor & Francis Copyright: the authors 901
Downloaded by [b-on: Biblioteca do conhecimento online UC], [Pedro Henriques Abreu] at 03:04 28 May 2013
Abreu, P.H., Silva, D.C., Moreira, J. M., Reis, L. P., Garganta, J.
sumes that this team will have an optimal behavior in the match, which usually does not happen. Riley 34 tries to classify an opponent by using predefined adversary classes. In conclusion, it is clear that many studies have tried to solve this problem, detecting single variables that can improve team performance, like, for instance, detecting the team formation, or trying to analyze the relationship between the ”home or away” effect. However, this problem incorporates many complex and correlated variables, and to improve team performance a combination of them will be needed. Also, there is not a framework that is capable of automatically detecting the pattern behavior of an opponent and after that, to indicate which is the best tactic/strategy to adopt in order to defeat that opponent (optimizing the team performance). This research project should constitute the first step to solve this problem. 6.
Experimental results
In this project, an architecture composed by 4 distinct phases was used (Figure 3). In order to improve a team performance, it is crucial to identify the variables that are more correlated to its performance. Because of that, two goals were established in this stage. The first step consists in identifying an evaluation function that represents the 2D Simulation League (independent of Robotic team) in the analyzed years (Phase 1). The second one consists in validating this function (after a reduction process) using different games of the best, average and worst teams in the competition (Phase 3). Having the first goal in mind, more than two hundreds log files of RoboCup 2D Simulation League were collected and a set of final game statistics were calculated. Using the MARS algorithm an evaluation function was obtained (equation 3). It is important to note that pmax is the maximum value between the arguments values; for instance, pmax(0, 2007-Year) means that if the year is lower than 2007, pmax will be the difference between 2007 and the year value; otherwise it will be 0. In order to increase the interpretability of the evaluation formula, the correlation matrix was ana-
lyzed and the variables with highest correlation values identified (Table 2). After some tests, and in order to minimize the RSq value, the best evaluation formula, obtained through the elimination of the 1-BadDefDefensive, is represented in equation 4 (Phase 2). In order to produce another evaluation function in this research work, the RReliefF algorithm was also used. Typically this algorithm is used for feature selection problems; however, and following the work described in 35 , it is also possible to use the solution produced by this algorithm in a form of an evaluation function. The process consists of 2 steps: run the RReliefF algorithm and obtain the evaluation function (equation 5). After that, and in order to increase the interpretability of the function (as suggested by 18 ), the variables that present values below 0.01 are eliminated (considering that they are irrelevant in order to explain the target variable). Next, and before running the RReliefF again (to obtain a new evaluation function with less variables – Phase 2), a prediction algorithm was run (in this case MARS) as to evaluate the RSq (coefficient of determination) – a measure of how well the next value can be predicted using the structural part of the model and the past values of the residuals; GRSq – a measure of the generalization ability of the model; GCV – Generalized Cross Validation; and RSS – Residual Sum of Squares. Values of GRSq and RSq above 0.80 are considered good 36 . This process was repeated seven times and the final evaluation function is represented in equation 6 with a a RSq value of 0.8 (the initial value of RSq was higher than 0.83). This number of times is justified due to the fact that by visual inspection, in the next interation, there was a sharp drop of the RSq measure which means that there are considerable losses by reducing the number of features. The use of an evaluation function with fewer variables has priority, mainly due to restrictions related to the real-time mode (explained below). Doing a comparison between the two evaluation functions, it is easy to note that both of them present an RSq value greater than 0.80, which constitutes excellent perspectives, since these functions attempt to model the 2D competition between the years 2006 and 2009.
Co-published by Atlantis Press and Taylor & Francis Copyright: the authors 902
Using MARS to Construct Simulated Soccer Team Behavior Models
Downloaded by [b-on: Biblioteca do conhecimento online UC], [Pedro Henriques Abreu] at 03:04 28 May 2013
Model generation: MARS
Model generation: RReliefF
213 games
Full model (Eq. 3)
Full model (Eq. 4)
Model reduction
Model reduction
Reduced model (Eq. 5)
Reduced model (Eq. 6) 52 games
Testing
Testing
Mean squared error
Phase 1
Phase 2
Phase 3
Mean squared error Statistical validation: t-test
Phase 4
p-value
Figure 3: Project Architecture Table 2: The highest correlation coefficient table for soccer variables Variables
Correlation Value
FastAtt & AttTot GoalsTot & FastAtt 1-GoodDef & 2-GoodDef 1-BadPassTot & 1-BadDefDefensive
0.768 0.658 0.648 0.605
It is also important to note that the MARS evaluation function uses only 19 variables, 13 of them also present in the RReliefF evaluation function. This fact could be explained by the nature of these two algorithms. The MARS algorithm uses a greedy approach, which means that once a variable with a substantial weight is found, all correlated variables are more likely to be discarded. On the other hand, RReliefF employs a different process – when the algorithm identifies two correlated variables with a substantial weight, the weight is (approximately) divided in two, maintaining both variables in the evaluation functions. This fact is the main reason that explains the high number of variables in the RReliefF (compared to the other approach) and the similarities between the variables presented in both al-
gorithms. In order to validate this approach, the values of the evaluation function were calculated for 52 games of the best, average and worst teams (Phase 3) – see Table 3. The main reason to pick these games, distinct from the ones selected in Phase 1, was to analyze the variation of the evaluation functions values, according to different kinds of strategy used by these distinct teams (with different competition goals and final results). For this analysis, the best three games of each team throughout the tournaments (according to the difference of scored goals) were selected, and for the teams from the middle of the classification table, all games were analyzed (as these teams have a greater variation in results compared to others, the authors considered important to conduct a more de-
Co-published by Atlantis Press and Taylor & Francis Copyright: the authors 903
Abreu, P.H., Silva, D.C., Moreira, J. M., Reis, L. P., Garganta, J.
d : GSD − 8.027179 + 1.323695 ∗ pmax(0, 2007 −Year) Downloaded by [b-on: Biblioteca do conhecimento online UC], [Pedro Henriques Abreu] at 03:04 28 May 2013
+ 0.1758595 ∗ pmax(0, ‘1 − GoodPassTot‘ − 28) − 0.4432226 ∗ pmax(0, 28 − ‘1 − GoodPassTot‘) + 0.1942015 ∗ pmax(0, 45 − ‘1 − GoodDe f ‘) + 0.5634025 ∗ pmax(0, 13 − ‘1 − GoodO f f ‘) − 0.1778462 ∗ pmax(0, ‘1 − GoodO f f ‘ − 19) − 0.07292148 ∗ pmax(0, ‘2 − GoodDe f ‘ − 24) + 0.4850653 ∗ pmax(0, 38 − ‘1 − BadPassTot‘) − 0.3821516 ∗ pmax(0, 19 − ‘1 − BadDe f De f ensive‘) + 0.3927295 ∗ pmax(0, ‘1 − BadO f f ‘ − 6) − 0.6520109 ∗ pmax(0, 6 − ‘1 − BadO f f ‘) − 0.5733758 ∗ pmax(0, 2 − ‘2 − IntShot‘) + 1.080035 ∗ pmax(0, GoalsTot − 2) − 1.405439 ∗ pmax(0, 2 − GoalsTot)
(3)
− 0.2652112 ∗ pmax(0, 6 − ‘1 − T hrowIn‘) − 1.733088 ∗ pmax(0, 2 − FasAtt) − 0.5532784 ∗ pmax(0, AttTot − 6) − 0.7776533 ∗ pmax(0, 6 − AttTot) + 0.583137 ∗ pmax(0, AttTot − 9) − 9.441973 ∗ pmax(0, 0.1489362 − ‘1 − Le f tBposs − De f ‘) − 30.89637 ∗ pmax(0, 0.1439394 − ‘2 − Le f tBposs − De f ‘) − 5.911897 ∗ pmax(0, 0.2911392 − ‘1 − MiddBposs − De f ‘) − 26.79510 ∗ pmax(0, 0.1794171 − ‘2 − MiddBposs − De f ‘) + 22.90795 ∗ pmax(0, ‘3 − MiddBposs − Attack‘ − 0.5229358) − 11.51705 ∗ pmax(0, ‘3 − MiddBposs − Attack‘ − 0.409201) − 6.569842 ∗ pmax(0, 0.2230216 − ‘4 − MiddBposs − Attack‘) GCV : 9.322364 RSS : 2815.400 GRSq : 0.8000512 RSq : 0.8486588 where pmax is the maximum value between the arguments values
tailed analysis). MSE = To perform a comparison between the functions values (equation 4 and 6), the mean squared error (MSE) function (7) was also calculated. Nowadays, there are several methods to quantify the difference between estimator (in this particular case the value calculated by the evaluation function) and the true value of the quantity being estimated.
1 n b ∑ ( f (Xi) − f (Xi))2 n i=1
(7)
The MSE is a possible evaluation metric that measures the average of the squared error. The error is the amount by which the estimator differs from the real value (in this case the goal scored difference). The values obtained were 14.68 for MARS and 384.4 for RReliefF respectively. Using these re-
Co-published by Atlantis Press and Taylor & Francis Copyright: the authors 904
Using MARS to Construct Simulated Soccer Team Behavior Models
d : GSD 8.38818 Downloaded by [b-on: Biblioteca do conhecimento online UC], [Pedro Henriques Abreu] at 03:04 28 May 2013
+ 1.644371 ∗ pmax(0, 2007 −Year) − 0.3069785 ∗ pmax(0, ‘1 − GoodPassTot‘ − 28) + 0.5093597 ∗ pmax(0, ‘1 − GoodDe f ‘ − 45) − 0.2746145 ∗ pmax(0, 45 − ‘1 − GoodDe f ‘) + 0.4722099 ∗ pmax(0, ‘1 − GoodO f f ‘ − 13) − 0.1705543 ∗ pmax(0, ‘1 − GoodO f f ‘ − 21) − 0.05941206 ∗ pmax(0, ‘2 − GoodDe f ‘ − 22) + 0.1417468 ∗ pmax(0, 38 − ‘1 − BadPassTot‘) + 0.5710572 ∗ pmax(0, ‘2 − BadPassTot‘ − 38) − 0.5607114 ∗ pmax(0, ‘2 − BadDe f ‘ − 23) − 0.7210807 ∗ pmax(0, 1 − ‘2 − IntShot‘)
(4)
+ 1.087935 ∗ pmax(0, GoalsTot − 2) − 1.516579 ∗ pmax(0, 2 − GoalsTot) − 0.2664058 ∗ pmax(0, 6 − ‘1 − T hrowIn‘) − 1.154919 ∗ pmax(0, 1 − ‘1 − O f f Int‘) − 1.654616 ∗ pmax(0, 2 − FasAtt) − 0.6579848 ∗ pmax(0, 6 − AttTot) − 11.67972 ∗ pmax(0, 0.1489362 − ‘1 − Le f tBposs − De f ‘) − 41.80000 ∗ pmax(0, 0.1439394 − ‘2 − Le f tBposs − De f ‘) − 29.29008 ∗ pmax(0, 0.1794171 − ‘2 − MiddBposs − De f ‘) + 3.418717 ∗ pmax(0, 0.564728 − ‘2 − RightBposs − De f ‘) GCV : 9.478295 RSS : 3029.367 GRSq : 0.7967068 RSq : 0.837157 where pmax is the maximum value between the arguments values
sults, a pairwise t-test, assuming the quality of these two predictors was perfomed (Phase 4). For this test and, assuming a significance level of 5% the null hypothesis is rejected with a p-value of 2.2e-16. This value shows that the MARS algorithm is a better approach for this particular scenario. 7.
Conclusions and future work
In this section, the work conclusions are presented and future trends are discussed. This research work is enclosed in a large project, with the aim of constructing a soccer tool capable of automatically identifying which is the best strategy to use against a specific opponent (improving in this way the performance of the team). At the end of this project, the failure detected in the soccer analyzers (as demonstrated in section 6) will be filled.
Nowadays, there are many soccer analyzers that present a huge amount of information about the game to the coach, providing him with an understanding of how his opponent plays. Unfortunately, after collecting this kind of data, the soccer coach needs to interpret it, in order to identify the strengths and weaknesses of his opponent. In this context, the goal of this research project was to identify which are the game statistics that influence the most the final game result (in this work the final game result is materialized in the difference of goals scored by both teams). For that purposes, a set of more than two hundred log files from the Robocup 2D Simulation League were selected and after that almost 60 statistics, defined by a soccer experts board, were calculated. In order to identify the smallest subset of statistics that present more weight in the final game re-
Co-published by Atlantis Press and Taylor & Francis Copyright: the authors 905
Abreu, P.H., Silva, D.C., Moreira, J. M., Reis, L. P., Garganta, J.
d : GSD 0.002685991 ∗ ‘Year‘ + 0.081584432 ∗ 1 − GoodPassTot‘ + 0.038278411 ∗ ‘1 − GoodDe f ‘+ Downloaded by [b-on: Biblioteca do conhecimento online UC], [Pedro Henriques Abreu] at 03:04 28 May 2013
0.152389082 ∗ ‘1 − GoodO f f ‘ + 0.051762025 ∗ ‘2 − GoodPassTot‘+ 0.014338300 ∗ ‘2 − GoodDe f ‘ + 0.120049799 ∗ ‘2 − GoodO f f ‘+ 0.017053040 ∗ ‘1 − BadPassTot‘ + 0.043264792 ∗ ‘1 − BadDe f De f ensive‘+ 0.005991938 ∗ ‘1 − BadO f f ‘ + 0.119815559 ∗ ‘2 − BadPassTot‘+ 0.102833853 ∗ ‘2 − BadDe f ‘ + 0.005188743 ∗ ‘2 − BadO f f ‘ + 0.037707316 ∗ ‘1 − Shot‘+ 0.074576702 ∗ ‘1 − IntShot‘ + 0.069741968 ∗ ‘1 − ShotTarget‘+ 0.142652442 ∗ ‘2 − Shot‘ + 0.041309290 ∗ ‘2 − IntShot‘+ 0.127233090 ∗ ‘2 − ShotTarget‘ + 0.151860736 ∗ ‘GoalsTot‘+ 0.078188005 ∗ ‘1 − Goals‘ + 0.096913938 ∗ ‘2 − Goals‘ + 0.044434770 ∗ ‘PenBoxBack‘+ 0.126933072 ∗ ‘PenArea‘ + 0.018330625 ∗ ‘OutPenArea‘ + 0.096895610 ∗ ‘OutTot‘+ 0.127063906 ∗ ‘1 − GoalKick‘ + 0.139664584 ∗ ‘1 −Corner‘+ 0.042733694 ∗ ‘1 − T hrowIn‘ + 0.028779979 ∗ ‘2 − GoalKick‘+ 0.105727476 ∗ ‘2 −Corner‘ + 0.020281499 ∗ ‘2 − T hrowIn‘+
(5)
0.000291012 ∗ ‘1 − O f f side‘ + 0.034200135 ∗ ‘2 − O f f side‘+ 0.128176498 ∗ ‘1 − O f f Int‘ + 0.057779159 ∗ ‘2 − O f f Int‘ + 0.015154563 ∗ ‘BroAtt‘+ 0.001821197 ∗ ‘FasAtt‘ + 0.088895155 ∗ ‘MedAtt‘ + 0.008794465 ∗ ‘SloAtt‘+ 0.015468362 ∗ ‘AttTot‘ + 0.093907896 ∗ ‘1 − Le f tBposs − De f ‘+ 0.070319037 ∗ ‘2 − Le f tBposs − De f ‘ + 0.056399519 ∗ ‘3 − Le f tBposs − Attack‘+ 0.023460893 ∗ ‘4 − Le f tBposs − Attack‘ + 0.046015616 ∗ ‘1 − MiddBposs − De f ‘+ 0.101656174 ∗ ‘2 − MiddBposs − De f ‘ + 0.011812777 ∗ 3 − ‘MiddBposs − Attack‘+ 0.060242348 ∗ ‘4 − MiddBposs − Attack‘ + 0.125920728 ∗ ‘1 − RightBposs − De f ‘+ 0.098887526 ∗ ‘2 − RightBposs − De f ‘ + 0.015302807 ∗ ‘3 − RightBposs − Attack‘+ 0.084622490 ∗ ‘4 − RightBposs − Attack‘ + 0.046566102 ∗ ‘GoalsOpp‘+ 0.012704922 ∗ ‘PassChain‘ + 0.072401733 ∗ ‘WingChange‘ GCV : 9.322364 RSS : 2815.400 GRSq : 0.8000512 RSq : 0.8486588 where pmax is the maximum value between the arguments values
sult, the MARS and RReliefF algorithms were used to produce two evaluation functions capable of modeling this reality. In this approach, evaluation functions with a small number of variables were valued, mainly for two reasons. The first, and probably the most important one, is related to the online mode, to be implemented in the future. In this specific
mode, it is crucial that the calculation of statistics and change of team strategies happens in the shortest period of time possible and so, the number of variables will be directly proportional to the time that it takes to calculate. The second reason is because when we calculate the two evaluation functions (equation 4 and 6) we obtain a RSq value
Co-published by Atlantis Press and Taylor & Francis Copyright: the authors 906
Using MARS to Construct Simulated Soccer Team Behavior Models
d : GSD 0.1085678173 ∗ ‘1 − GoodPassTot‘ + 0.0333793177 ∗ ‘1 − GoodDe f ‘+ Downloaded by [b-on: Biblioteca do conhecimento online UC], [Pedro Henriques Abreu] at 03:04 28 May 2013
0.0796453572 ∗ ‘2 − GoodPassTot‘ + 0.0128294878 ∗ ‘2 − GoodDe f ‘+ 0.0083693729 ∗ ‘2 − GoodO f f ‘ + 0.0274159181 ∗ ‘1 − BadDe f De f ensive‘+ 0.0708654848 ∗ ‘2 − BadPassTot‘ + 0.0448306355 ∗ ‘2 − BadDe f ‘+ 0.0577098364 ∗ ‘1 − Shot‘ + 0.0481160484 ∗ ‘1 − IntShot‘+ 0.0018519818 ∗ ‘1 − ShotTarget‘ + 0.0098023028 ∗ ‘2 − Shot‘+ 0.0099133630 ∗ ‘2 − IntShot‘ + 0.0828931087 ∗ ‘2 − ShotTarget‘+ 0.2604277820 ∗ ‘GoalsTot‘ + 0.1799456998 ∗ ‘2 − Goals‘+ 0.0273404987 ∗ ‘PenBoxBack‘ + 0.2173460194 ∗ ‘PenArea‘+
(6)
0.0976643308 ∗ ‘OutPenArea‘ + 0.1052917803 ∗ ‘1 −Corner‘+ 0.0734638367 ∗ ‘1 − T hrowIn‘ + 0.0593205483 ∗ ‘2 −Corner‘+ 0.0309027898 ∗ ‘2 − O f f Int‘ + 0.0064832968 ∗ ‘BroAtt‘ + 0.0173590182 ∗ ‘MedAtt‘+ 0.0845213352 ∗ ‘AttTot‘ + 0.0091394370 ∗ ‘2 − Le f tBposs − De f ‘+ 0.0761864554 ∗ ‘3 − Le f tBposs − Attack‘ + 0.0366654265 ∗ ‘2 − MiddBposs − De f ‘+ 0.0458992625 ∗ ‘4 − MiddBposs − Attack‘ + 0.0759206186 ∗ ‘1 − RightBposs − De f ‘+ 0.0009476703 ∗ ‘2 − RightBposs − De f ‘ + 0.0599595746 ∗ ‘GoalsOpp‘ GCV : 10.56622 RSS : 3452.968 GRSq : 0.7733726 RSq : 0.8143865 where pmax is the maximum value between the arguments values
greater than 0.84 (without excluding any problem variable); in order to improve the functions interoperability and the real time calculus, the authors established by visual inspection, the limit RSq value 0.80, avoiding a sharp drop of the RSq value. The evaluation of these functions was performed using more than fifty new games encompassing the games played by the best, average and worst teams. In the Robotic universe and in particular the 2D Simulation League, the best and worst teams do not considerably change their way of playing (which consists for instance in choosing a specific formation, type of pass, etc.). So, to avoid this situation, this analysis also includes the teams that occupied the mid-table place and normally have a wider range of results over the competition. Also, several times these teams change their strategies according to their next opponent. To compare the results produced by these two algorithms, an error function (mean
squared error) was used. The main reason that supports this decision is that in this approach we only used absolute values and both estimator and quantity to be estimated have the same units, which means that in this particular case, the relation produced by MSE compared to other error function such as RMSE (root mean square error) will be the same. Using the results produced by MARS and RReliefF algorithms, a pairwise t-test, assuming the quality of these two predictors was perfomed. For this test, and assuming a significance level of 5%, the null hypothesis is rejected with a p-value of 2.2e-16. In conclusion, and analyzing the initial goals proposed for this research, the final results were very promising, and the MARS algorithm proved to be a good approach to select and identify the variables weight in this type of environment. Also, it is important to state that this study proved inequivocally that even in a complex context such as soccer, it can
Co-published by Atlantis Press and Taylor & Francis Copyright: the authors 907
Abreu, P.H., Silva, D.C., Moreira, J. M., Reis, L. P., Garganta, J.
Downloaded by [b-on: Biblioteca do conhecimento online UC], [Pedro Henriques Abreu] at 03:04 28 May 2013
Table 3: RoboCup 2D final competition table illustrating the best, average and worst teams Best Team Average Team Worst Team
2006
2007
2008
2009
WE2006 DAINAMITE Mersad
Brainstormers NCL Brasil2D
Brainstorm08 Hfut Engine ATHumbold
WE NemesisRC09 Bahia2D
be characterized using only 19 variables which can constitute, together with further validation using human soccer data, a remarkable point in collective games research. Regarding future work areas, the next steps of development should focus on three fundamental areas: related to offline and online mode; comparison studies between the Robotic and Human Soccer realities; and with other collective sports. Considering the offline mode, the goal is to identify the best strategy (the one that improves team performance the most) to use against an opponent. To initialize this process, it is crucial to acquire the binary code of the opponent team. Then, we have to decide which should be the criteria to alter the team strategy and finally evaluate performance. In this particular case, three distinct criteria will be used: the values produced by the evaluation functions created in this research work, the exclusive analysis of the goal difference, or goals scored. After some simulation games (over 100 simulation games), the results will be compared, as to identify which strategy improves team performance the most. The other mode, to be developed, is the realtime mode. In this particular scenario, a coach agent should be developed in order to be able to calculate, in real time, final game statistics. After that, and using the knowledge previously generated by the previous mode, he will try to improve his team performance by altering some team strategies aspects, such as the team formation or the defenders pass style, among others. To fulfill this task, it is important to note that the calculus were performed (as explained in section 4) using a sequential analysis. However, in the real-time mode, the statistics calculation time is a crucial factor and in this scenario we do not have the entire players game actions, as when using log files. So this particularity will in-
duce transformations in our calculation process that cannot be negligible. Having the RoboCup goals in mind (explained in section 3), it would be very interesting to understand if the set of variables and their weights are similar to the ones presented in the Robotic environment. For that, the EFA (English Football Association) has already been contacted in order to obtain soccer data from a soccer season. This contact was made attending to the fact that the majority of English clubs in the Premier League (the main English football league) already have a system capable of extracting cartesian information during a soccer match. This study will also allow for the determination of how far away the objective proposed by the RoboCup organization is from be achieved. Finally and after performing the soccer study previously enumerated, the procedure used in this study (Figure 3) could be easily generalized to other collective sport games, such as basket or hockey, identifying what are the variables that most influence the final game result attending to their different goals. It could also be extended by modeling team and players typical behaviors.
Acknowledgements This work is funded by the ERDF - European Regional Development Fund through the COMPETE Programme (operational programme for competitiveness), by the Portuguese Funds through the FCT (Portuguese Foundation for Science and Technology) within project FCOMP - 01-0124-FEDER022701.
Co-published by Atlantis Press and Taylor & Francis Copyright: the authors 908
Using MARS to Construct Simulated Soccer Team Behavior Models
Downloaded by [b-on: Biblioteca do conhecimento online UC], [Pedro Henriques Abreu] at 03:04 28 May 2013
References 1. Abreu, P.H., Vinhas, V., Mendes, P., Reis, L.P. and Garganta, J. 2010. Real-Time Wireless Location and Tracking System with Motion Pattern Detection, Robot Localization and Map Building, pp.467-492, In-Tech. 2. Abreu, P.H., Moura, J., Silva, D. C., Reis, L.P. and Garganta, J. 2012. Performance analysis in soccer: a Cartesian coordinates based approach using RoboCup data, Soft Computing-A Fusion of Foundations, Methodologies and Applications Journal, 16, pp.1-15. 3. Atkinson, G. and Neville, A. 2001. Selected issues in the design and analysis of sport performance research, Journal of Sports Science, 19, pp.811-827. 4. Bradley,P., Sheldon, W., Blake, W., Olsen, P., Boanas, P. and Krustrup, P. 2009. High-intensity running in English FA Premier League soccer matches. Journal of Sport Science, 27(2), pp.159-168. 5. Carling, C., Williams, A.M. and Reilly, T., 2005, Handbook of Soccer Match Analysis: A Systematic Approach to improving Performance. (London: Routledge). 6. Clarke, S. and Norman, J. 1995. Home ground advantage of individual clubs in English soccer, Statistician, 44, pp.509-521. 7. Dietterich, T. 1997. Machine Learning Research:Four Current Directions, AI Magazine, 18, pp.97-136. 8. Dixon, M and Robinson, M. 1998. A birth process model for association football matches, Statistician, 47, pp.523-538. 9. Drucker, C., Duddeck, C., Huebner, S., Neumann, H., Schmidt, E., Visser, U. and Weland, H. 2000. Virtualweder: Using the online-coach to change team formations. Technical report, TZI-Center for Computing Technologies, University of Bremen. 10. Ensum, R., Pollard. and Taylor, S. 2005. Applications of logistic regression to shots at goal in association football. In Science and Football IV (Edited by T. Reilly, J. Cabri and D. Araujo), London: Routledge, pp. 211-218. 11. Franks, I. and Miller G. 1991. Training Coaches to observe and remember. Journal of Sport Sciences, 9, pp.285-297. 12. Friedman, J. 1991. Multivariate Adaptive Regression Splines, Ann. Stat. 19, pp.1-141. 13. Garganta, J., Maia, J. and Basto, F. 1997. Analysis of goal-scoring patterns in European top level soccer teams. In Science and Football III (Edited by T. Reilly, J. Bangsbo and M. Hughes), London: E and FN Spon, pp. 246-250. 14. Gonzalez, I., Abreu, P.H. and Reis, L.P. 2008. Using a datawarehouse to extract knowledge from robocup teams. International Conference on Enterprise Infor-
mation Systems, pp. 511-514. 15. Gregson, W., Drust, B., Atkinson, G. and Salvo, V., 2010,Match-to-Match Variability of High-Speed Activities in Premier League Soccer. International Journal of Sports Med. 16. Grehaigne, J.F., Bouthier, D. and David, B., 1997, Dynamic-system analysis of opponent relationship in collective actions in soccer. Journal of Sports Sciences, 15, pp.137-49. 17. Griffith, S. 1963. Translaction of the book The Art of War by Sun Tzu,Oxford University Press. 18. Hall, M. 2000. Correlation-based feature selection for discrete and numeric class machine learning. In International Conference on Machine Learning, pp.359366. 19. Hughes, M. and Bartlett, R. 2002. Performance indicators in performance analysis, Journal of Sports Science, 20, pp.738-754. 20. Hughes, M. 2003. Notational analysis, in Science and Soccer (Edited by T.Reilly and M. Williams). Routledge:London, pp.245-264. 21. James, N., Jones, P.D. and Mellalieu, S.D. 2004. Possession as a Performance Indicator in Soccer. International Journal of Performance Analysis in Sport, 4,1,pp.98-102. 22. Jonsson, G. 1998. Detecting patterns in complex behavioural processes with the observer and theme. In L.P.J.J. Noldus (Ed.), Measuring Behaviour ‘98 2nd International Conference on Methods and Techniques in Behavioural Research (pp.176). Groningen, Netherlands. 23. King, G., Keohane, R. O and Verba, S. 1993. Designing Social Inquirity. Scientific Inference in Qualitative Research. Princetown: Pricetown University Press. 24. Kira, K. and Rendell, L. 1992. A Practical Approach to Feature Selection, Proc. 9th Int. Conf. Mach. Learn, pp.249-256. 25. Kitano, H., Asada, M.,Kuniyoshi, Y., Noda, I. and Osawa, E. 1995 Robocup: The Robotic World Cup Initiative. Proceedings of IJCAI 95 Workshop on Entertainment and AI/Alife, pp.19-24. 26. Kitano, H. 1997. RoboCup: The Robotic World Cup Initiative, Proceedings of the 1st International Conference on Autonomous Agent (Agents 97). 27. Kitano, H., Tambe, M., Stone, P., Veloso, M., Noda, M., Osawa, E. and Asada, M. 1997 The RoboCup Synthetic Agents Challenge. Proceedings of the International Joint Conference on Artificial Intelligence (IJCAI), Springer-Verlag (Ed.), pp.62-73. 28. Kitano, H., Tadokoro, S., Noda, I., Matsubara, H., Takahashi, T., Shinjou, A. and Shimada, S. 1999. RoboCup-Rescue: Search and Rescue for Large Scale Disasters as a Domain for Multi-Agent Research, Proceedings of IEEE Conference on Man, Systems, and Cybernetics (SMC-99), pp.739-743.
Co-published by Atlantis Press and Taylor & Francis Copyright: the authors 909
Downloaded by [b-on: Biblioteca do conhecimento online UC], [Pedro Henriques Abreu] at 03:04 28 May 2013
Abreu, P.H., Silva, D.C., Moreira, J. M., Reis, L. P., Garganta, J.
29. Lago, C. and Martin-Acero, R. 2007. Investigating the determinants of the possession of the ball in soccer. Journal of Sports Sciences, 25(9), pp.969 - 974. 30. MackWorth, A. 1993. On Seeing Robotics, Computer Vision: System, Theory, and Applications, World Scientific Press, Singapore, pp.1-13. 31. Maher, M. 1982. Modelling Association Football Scores, Statistica Neerlandica, 36, pp.109-118. 32. Neville, A., Atkinson, G., Hughes, M. and Cooper, S. M. 2002. Statistical methods for analysing discrete and categorical data recorded in performance analysis. Journal of Sports Science. 20, pp.829-844. 33. Randers, M. B., Mujika, I., Hewitt, A., Santisteban, J., Bischoff, R., Solano, R., Zubillaga, A., Peltola, E., Krustrup, P. and Mohr, M. 2010. Application of four different football match analysis systems: A comparative study. Journal of Sport Science, 28(2), pp.171182. 34. Riley, P and Veloso, M. 2000. Distributed Autonomous Robotic Systems, 4, Chapter On Behavior Classification in Adversarial Environments, pp. 371-
380, Springer-Verlag. 35. Robnik-Sikonja, M. and Kononenko, I. 2003. Theoretical and empirical analysis of relieff and rrelieff. MachineLearning, 53(1-2), pp.23-69. 36. Sekulic, S. and Kowalski, B. 1992. MARS: a tutorial, J. Chemom. 6, pp.199-216. 37. Sklar, E., Eguchi, A. and Johnson, J. 2002. RoboCupJunior: Learning with Educational Robotics, RoboCup-2002, pp.43-46. 38. Stone, P., Riley, P. and Veloso, M. 2000. Defining and using ideal teammate and opponent agent models. In Proceedings of the Twelfth Innovative Applications of Artificial Intelligence Conference,pp.1040-1045. 39. Sun, Y. and Li, J. 2006. Iterative Relief For Feature Weighting, Proc. 21st Int. Conf. Mach. Learn, pp.913920. 40. Sun, Y. and Wu, D. 2008. A RELIEF Based Feature Extraction Algorithm, Proc. of the SIAM Int. Conf. on Data Mining, pp.188-195. 41. Weineck, J. 1997. Coaching soccer - Conditioning. Thessaloniki: Edition Salto.
Co-published by Atlantis Press and Taylor & Francis Copyright: the authors 910