Huong Thuy town's wards in Thua Thien Hue. Province. However, Nhu Y River was limited with Huong River by Dap Da dam and it rarely .... Chiet Bi village, Phu Thuong commune, Phu Vang district ..... Äá»i chất lượng nÆ°á»c. Kết quả ... thá»i Äược Äặt tên và giải thÃch bá»i quá trình ... cÅ©ng xác láºp và phân là m nhóm lần lượt.
TAÏP CHÍ PHAÙT TRIEÅN KH&CN, TAÄP 17, SOÁ M1 – 2014 ___________________________________________________________________________________
Using multivariate statistical techniques to assess water quality of Nhu Y river in Thua Thien Hue province � Nguyen Minh Ky College of Sciences, Hue University
� Nguyen Hoang Lam Danang University of Technology (Bài nhận ngày 07 tháng 08 năm 2014, nhận ñăng ngày 08 tháng 10 năm 2014)
ABSTRACT The aims of this research are to assess water quality by organic and nutrient matters and identifying the environmental pressures, examine the impact of the loads to Nhu Y River, Thua Thien-Hue Province. Five stations were sampled at Nhu Y River, the research had monitoring of water quality parameters such as Temperature (Temp), Dissolved Oxygen (DO), Biological Oxygen Demand (BOD5), Chemical Oxygen Demand 3(COD), Nitrate (NO3 ) and Phosphate (PO4 ). The research used multivariate statistical techniques such as correlation analysis, principal component analysis (PCA) and cluster analysis (CA) to assess water quality. The correlation analysis shown a strong positive correlation exists between water quality parameters such as Temp�DO and
BOD5�COD (p1 have been retained and are used to assess the compositional, temporal and spatial variations in the river quality due to anthropogenic activities. The PCA with varimax rotation has also been applied to the water quality data set to form a correlation matrix for different variables and assists in the identification of sources of various pollutants.
Science & Technology Development, Vol 17, No.M1- 2014
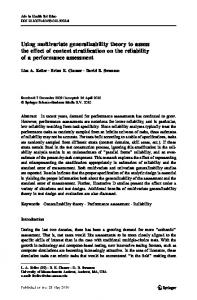
Fig. 1. Map of water sampling stations
3. RESULTS AND DISCUSSION Table 2 show the physicochemical parameters of the water samples from each of the five investigated sites. The temperature present in 30 water samples has been ranged from 22.10C to 32.50C and an average temperature 27.80C. The DO content has been ranged between 2.3 mg/L to 8.6 mg/L. The BOD5 content has been varied
from 5.4 mg/L to 14.2 mg/L. The COD content has been ranged of 7.7 mg/L to 22.1 mg/L and an average COD 14.5 mg/L. The NO3- and PO43contents has been ranged of 0.13 mg/L to 0.54 mg/L and 0.002 mg/L to 0.220 mg/L, respectively.
Table 2. Values of physicochemical parameters of Nhu Y River Parameters Temp oC
DO (mg/L)
S1
N 6
Mean 25.3
SD 2.32
Std. Error 0.95
Minimum 23.0
Maximum 29.0
S2
6
27.6
2.81
1.15
23.3
31.4
S3
6
27.6
4.27
1.74
22.1
32.5
S4
6
29.9
3.09
1.26
23.7
32.3
S5
6
28.6
3.47
1.42
23.7
31.7
S1
6
3.6
0.78
0.32
2.6
4.7
S2
6
4.6
0.94
0.38
3.4
6.0
Trang 53
TAÏP CHÍ PHAÙT TRIEÅN KH&CN, TAÄP 17, SOÁ M1 – 2014 ___________________________________________________________________________________
BOD5 (mg/L)
COD (mg/L)
-
NO3 (mg/L)
3-
PO4 (mg/L)
S3
6
4.0
1.21
0.49
2.3
5.6
S4
6
6.8
1.48
0.60
4.7
8.6
S5
6
5.1
0.78
0.32
3.8
6.0
S1
6
10.9
2.52
1.03
6.3
13.4
S2
6
7.7
2.34
0.96
5.4
11.7
S3
6
10.9
2.57
1.05
7.8
14.1
S4
6
7.0
0.88
0.36
5.7
7.9
S5
6
12.1
1.18
0.48
10.7
14.2
S1
6
16.2
0.71
0.29
15.4
17.2
S2
6
14.2
2.11
0.86
11.7
17.2
S3
6
14.4
1.99
0.81
11.9
17.0
S4
6
10.4
2.48
1.01
7.7
14.2
S5
6
17.5
3.36
1.37
14.0
22.1
S1
6
0.25
0.048
0.019
0.16
0.29
S2
6
0.25
0.054
0.022
0.19
0.34
S3
6
0.40
0.113
0.046
0.27
0.54
S4
6
0.30
0.094
0.038
0.15
0.40
S5
6
0.26
0.078
0.032
0.13
0.35
S1
6
0.019
0.013
0.005
0.002
0.033
S2
6
0.086
0.072
0.029
0.008
0.181
S3
6
0.117
0.053
0.022
0.073
0.220
S4
6
0.121
0.043
0.017
0.043
0.164
S5
6
0.060
0.034
0.014
0.016
0.096
*Note: Mean- average value, SD- standard deviation, Std. Error- standard error
Table 3. Vietnamese surface water quality standard [7] QCVN 08: 2008/BTNMT
Parameters
Unit
DO
mg/L
≥6
≥5
≥4
≥2
BOD5
mg/L
4
6
15
25
COD
mg/L
10
15
30
50
-
mg/L
2
5
10
15
PO43-
mg/L
0.1
0.2
0.3
0.5
NO3
A1
A2
Most of the parameters like BOD5 and COD has shown average concentration varied and just satisfied of Colum B1 (For irrigation or other purposes requiring the similar quality of water or other purposes like B2) to B2 (For water Trang 54
B1
B2
transport and other purposes requiring low quality) in Vietnam’s Surface Water Quality Standard (QCVN 08:2008) [7]. In general, high BOD5 levels in the water river can be indicates the decline by DO content because the oxygen is consumed by the bacteria leading to fish and
Science & Technology Development, Vol 17, No.M1- 2014 other aquatic organisms cannot survive [12]. In contrast, NO3- content is lower than standard (Colum A1: For residential use and other purposes like A2, B1 and B2). The current QCVN 08:2008 (Vietnam Ministry of Natural Resources and Environment, 2008) permissible limit of parameters of river water quality are 2.0 mg/L for NO3- (Colum A1). Usually, the NO3concentration in surface water is normally low and varied less than 18 mg/L; however, it can also reach high levels because of the agricultural runoff, refuse dump runoff, contamination with human or animal wastes. The concentration often fluctuates follow the season and can increase in case if the river is fed by nitrate rich aquifers [14]. The surface water standard of the PO43content are 0.1 mg/L and 0.2 mg/L for Colum A1 and A2, respectively (where Colum A2: For residential use with proper treatment; preservation of aquatic plants or other purposes like in B1 and B2). Meanwhile, PO43- content varies between 0.002 mg/L to 0.220 mg/L, and this has shown that Nhu Y River has slight polluted signal, especially at sampling sites S2 to S5. It indicates that Nhu Y River’s water cannot use directly for the daily life demands. The DO values of the water are low and just satisfied Colum B1 and B2 in QCVN 08:2008, excepting sampling site at S4 (satisfied Colum A1 and A2). The DO plays an important role to maintain the river’s life process. According to Hach et al., the DO is an important parameter, and must have a minimum value of about 2 mg/L to maintain
higher life forms [4]. The DO content can be used as indicator signal of values such as BOD5, COD level in the river water flow. The values of COD indicate water pollution and it cannot be used for drinking supply purposes. The reasons could be linked to sewage effluents discharged from Hue City’s wards, small scale industry and agricultural practice (surrounding Nhu Y River at Phu Vang district and Huong Thuy town). It can be explained that surface water quality in the area has been affected by activities such as market, a part of agriculture and domestic wastewater. In addition, according to Gleick, 1993 [3], the runoff also is the common form of non-point sources of surface water pollution. Consequence of the runoff from land surface carries the residues into river system which known as nonpoint sources pollution [10]. The research has based on the variability in range of all the parameters distributions as compared with their respective means which is an indication of a water quality parameters level of the river. The increasing trend of average parameters levels are as follows: PO43- < NO3- < DO < BOD5 < COD. Before applying PCA and CA techniques, correlation analysis has been carried out. Regarding of relationship between water quality parameters, the study has used Pearson’s correlation coefficients by correlation analysis. As a result, the positive correlation between BOD5 and COD has demonstrated the relationship between these parameters.
Table 4. Pearson’s correlation coefficients between water quality parameters Temp ( C)
Temp (0C) 1
DO (mg/L)
0.646(**)
1
-0.239
-0.394(*)
0
BOD5 (mg/L)
DO (mg/L)
BOD5 (mg/L)
COD (mg/L)
NO3- (mg/L)
PO43- (mg/L)
1
Trang 55
TAÏP CHÍ PHAÙT TRIEÅN KH&CN, TAÄP 17, SOÁ M1 – 2014 ___________________________________________________________________________________ COD (mg/L)
-0.378(*)
-
-0.356
0.644(**)
1
NO3 (mg/L)
0.078
-0.035
0.198
-0.081
1
PO43- (mg/L)
0.174
0.370(*)
-0.277
-0.201
0.247
1
** Correlation is significant at the 0.01 level (2-tailed). * Correlation is significant at the 0.05 level (2-tailed).
Scree Plot
3.0
2.5
Eigenvalue
2.0
1.5
1.0
0.5
0.0 1
2
3
4
5
6
Component Number
Component Plot in Rotated Space
1.0
NO3
PO4
Component 2
0.5 Temp
BOD5
DO
COD
0.0
-0.5
-1.0 -1.0
-0.5
0.0
0.5
1.0
Component 1
Fig. 2. Scree plot of the eigenvalues of PCs for water quality parameters and Bi-plot for the components in rotated space
Trang 56
Science & Technology Development, Vol 17, No.M1- 2014 The Pearson’s correlation coefficients of the six parameters in Nhu Y River water have been summarized in the Table 4. Interrelationships have been established between physicochemical parameters indicators in which reliable correlations have been established using regression analysis. According to the research of Ajibade et al., (2008) [1] has also shown that the good correlations between these parameters as BOD5 with COD (r = 0.757, p