NetLogger also includes tools for host and network monitoring. ... example, in a client-server distributed system, each request-response transaction might be ...
Using NetLogger for Distributed Systems Performance Analysis of the BaBar Data Analysis System Brian Tierney1, Jacek Becla 2, Dan Gunter 1, Bob Jacobsen1, David Quarrie 1 1
Lawrence Berkeley National Laboratory 2
Stanford Linear Accelerator Center Abstract
Developers and users of high-performance distributed systems often observe performance problems, the reasons for which are rarely obvious. Bottlenecks can occur in any of the components along the paths through which the data flows: the applications, the operating systems, the hosts, or the network. We have developed a methodology, known as NetLogger, for detailed, end-to-end, top-to-bottom monitoring and analysis of all system components. NetLogger is being added to the data analysis systems that are used at the Stanford Linear Accelerator Center (SLAC) for the BaBar Project, and some initial results are presented in this paper. Keywords: performance analysis, NetLogger, BaBar
1.0 Introduction Developers and users of high-performance distributed systems often observe performance problems such as unexpectedly low throughput or high latency. The reasons for the poor performance can be manifold and are frequently not obvious. It is often difficult to track down performance problems because of the complex interaction between the many distributed system components, and the fact that performance problems in one place may be most apparent somewhere else. Bottlenecks can occur in any of the components along the paths through which the data flow: the applications, the operating systems, the device drivers, the network adapters on any of the sending or receiving hosts, and/or in network components such as switches and routers. Sometimes bottlenecks involve interactions among several components or the interplay of protocol parameters at different points in the system, and sometimes they are due to unrelated network activity impacting the operation of the distributed system. It has been our experience that wide-area distributed system developers and users often assume performance problems are due to network congestion. However in our experience, this is often not true. Having analyzed many distributed applications over the past 10 years, we have observed that performance problems are due more often to application design problems, followed by network problems or host problems. Application problems include inefficient use of remote services and communication mechanisms, such as a lack of TCP tuning [7]. Therefore it is equally important to instrument and monitor the applications, not just the hosts and networks. To characterize the performance of distributed applications, we have developed a methodology for detailed, end-to-end, top-to-bottom monitoring and analysis of significant events. This allows coordinated monitoring of applications, networks, and hosts.
2.0 NetLogger We have developed a methodology, known as NetLogger, for monitoring, under actual operating conditions, the behavior of all the elements of the application-to-application communication path in order to determine exactly what is happening within a complex system [6]. Distributed application components are instrumented to perform precision timestamping and event logging at every critical point (e.g., all I/O and any significant computational routine). The events are correlated with host and network monitoring to characterize the performance of all aspects of the system in detail. NetLogger is designed to facilitate identification of bottlenecks and help with performance tuning.
The NetLogger Toolkit is a set of tools which make it easy for distributed applications to log interesting events at every critical point. NetLogger also includes tools for host and network monitoring. The approach is novel in that it combines network, host, and application-level monitoring to provide a complete view of the entire system. NetLogger Toolkit contains the four components: the NetLogger message format, the NetLogger client library, NetLogger visualization tools, and NetLogger host and network monitoring tools. In addition to these NetLogger components, an additional critical component is a mechanism for synchronizing the clocks of all hosts in the distributed system. NTP (Network Time Protocol) [4] or a GPS host clock is required for this. The NetLogger message format is a simple ASCII format, which is an IETF draft standard format called ULM (Universal Logger Message) [1]. The NetLogger Toolkit includes application libraries (in C, C++, Java, Perl, Python, and Fortran) for generating NetLogger messages. Using these libraries one can send log messages to a local file, a remote host, the syslog daemon, or local memory. NetLogger also includes wrappers for several system monitoring utilities, such as vmstat, iostat, and netstat. Event Log Analysis and Visualization Tools
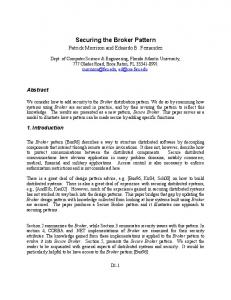
Exploratory, interactive analysis of the log data—especially analysis of the graphical representations of individual, exceptional events—has proven to be the most important means of identifying the causes of specific behaviors. In particular, the ability to distinguish, manipulate, and analyze log event plots is critical to isolating the locations of (and thereby the reasons for) unexpected behavior. NetLogger builds lifelines by combining specified events from a given set of processes, and represents them as lines on a graph. The graph plots time (i.e., the timestamp from the event log) against a set of events. For example, in a client-server distributed system, each request-response transaction might be represented as a lifeline; the events on the lifeline might include the request’s dispatch from the client, its arrival at the server, the commencement of server processing of the request, the dispatch of the response from the server to the client, and the arrival of the response at the client. We have developed a tool called nlv (NetLogger Visuevent point alization) for interactively viewing the NetLogger event event files. nlv can display several types of NetLogger load-line events. The user can combine multiple different event E sequences of events, servers, and graph types (lifeline, event D lifeline load-line, or point) on a single graph; the display can be event C event B modified to show an arbitrary subset of these elements. event A nlv graphing primitives are shown in Figure 1. The time point type is used to graph events such as TCP retransFigure 1: nlv graphing primitives mits that happen at a certain point in time. The load-line type is used to graph events such as CPU load that vary over time. The lifeline type is used to follow processing flow through time, as described above. nlv provides the ability to play, pause, rewind, slow down, zoom in/out, and so on. Figure 2 shows a sample nlv session. nlv can be run post-mortem on a log file collected after the application is finished, or can be run in “real-time,” analyzing live applications.
3.0 BaBar Data Analysis The BaBar detector was built at SLAC to study the millions of B mesons produced by the PEP-II storage ring. The BaBar collaboration consists of around 600 physicists and engineers from 85 institutions in 9 countries. The computing environment for the BaBar data analysis is very complex, and consists of many (i.e., 100-300) compute nodes, all sending results to a single database [2]. In the early production system, the time to place selected events into the Objectivity [5] database was very inconsistent, varying from 2 to 300 seconds. There was a very large amount of monitoring built into the BaBar software, yet it was quite difficult to correlate all
the log data to provide any insight into exactly why some nodes occasionally took several hundred seconds to update the database. We are planning to fully instrument the BaBar system with NetLogger instrumentation, but as a first step we used the existing log files and converted them to the NetLogger/ULM format used by the NetLogger exploratory log file analysis tools. This proved to be very useful, as it was much easier to correlate logged events using NetLogger.
4.0 Results Figure 2 shows the NetLogger nlv tool for some of the BaBar data. nlv proved to be a very effective tool for interactively exploring the log files. Some of the most useful features of nlv include the ability to color events based on which compute node it was from, and the ability to color groups of nodes together (i.e., color nodes 140-149 the same color). nlv allows the user to click on a graph element to get more information from the logfile about that event, such as the node number or an Objectivity error (see Figure2). nlv also allows the user to turn on/off sets of events, so it is easy to look at results of just one node, or the results of several overlaid nodes. nlv uses the gnuplot [3] library for generating output, so event plots can easily be saved in a large number of formats, including Postscript, GIF, JPEG, and MIF. The MIF output was used for Figure 3.
A C
B
♦
zoom interface
♦
play/pause/step/rewind/etc.
♦
data density plot
♦
zoom placement window
Figure 2: nlv screen dump showing Objectivity errors: nodes 50 and 125 Figure 3 shows the results for a single compute node. This plot shows four NetLogger “event sets”: open container, transaction commit, and OprBdbEventOutput (send event to Objectivity), represented as lifelines, and reacquire lock, represented by a point. Using this plot it is very easy to understand why some of the OprBdbEventOutput events took longer than others. The OprBdbEventOutput events near the beginning took longer because a new containers needed to be opened, and there was a pause in performing OprBdbEventOutput events while a transaction was committed. Figure 2 shows a plot with several Objectivity errors. The Objectivity error from the log file is displayed by clicking on the error event in the graph. Note the location of points A, B, and C in Figure2. At the same time
SLAC f-bronco 35-1
Reacquire_Lock EventOutput_End convertToPersistent EventOutput_Start
Event Output paused
TransCommit_End Event Output takes longer than usual TransCommit_Start
due to need to create new container
while new container is created
OpenContainer_End OpenContainer_Start 250
300
350
400
450
Time (Seconds)
Figure 3: Normal operation showing correlation of events: node 140 that these two nodes took over 100 seconds to send an event to the database, most other nodes (not shown) were able to send events in 2-3 seconds. It is expected that sometimes it will take longer to place new events into the database (C) because new containers must be created (B), and it also expected that sometimes takes longer to create a new container because a new database must be created ( A). What was quite surprising in this picture was that there was a 100 second pause between A and B, and a 30 second pause between B and C. This was due to a deadlock problem that has since been fixed. This figure also shows the ability to click on a object and get the node number, and shows a number of the nlv user interface features.
5.0 Conclusions and Future Work Our initial work with NetLogger has been very promising, and nlv provides a very useful way to view the correlation of logged events. The next step to is add host monitoring, such as CPU and memory usage, and then add NetLogger messages directly into the BaBar software. NetLogger is available for download from http://www-didc.lbl.gov/NetLogger/.
6.0 Acknowledgments The work described in this paper is supported by the U. S. Dept. of Energy, Office of Science, Office of Computational and Technology Research, Mathematical, Information, and Computational Sciences Division (http://www.er.doe.gov/production/octr/mics/index.html), under contract DE-AC03-76SF00098 with the University of California. This is report no. LBNL-44828.
7.0 References [1]
Abela, J., T. Debeaupuis, “Universal Format for Logger Messages”, IETF Internet Draft, http://www.ietf.org/internet-drafts/draft-abela-ulm-05.txt
[2]
BaBar Experiment: http://www.slac.stanford.edu/BFROOT/
[3]
gnuplot: http://www.cs.dartmouth.edu/gnuplot_info.html
[4]
Mills, D., “Simple Network Time Protocol (SNTP)”, RFC 1769, University of Delaware, March 1995. http://www.eecis.udel.edu/~ntp/.
[5]
Objectivity: http://www.objectivity.com/
[6]
Tierney, B. Lee, J., Crowley, B., Holding, M., Hylton, J., Drake, F., “A Network-Aware Distributed Storage Cache for Data Intensive Environments”, Proceeding of IEEE High Performance Distributed Computing conference (HPDC-8), August 1999, LBNL-42896.
[7]
Tierney, B. “TCP Tuning Guide for Distributed Application on Wide Area Networks”, http://www-didc.lbl.gov/tcp-wan.html