Using PeMS Data to Empirically Diagnose Freeway Bottleneck Locations in Orange County, California
Robert L. Bertini Department of Civil and Environmental Engineering Portland State University P.O. Box 751 Portland, OR 97207-0751 Phone: 503-725-4249 Fax: 503-725-5950 Email:
[email protected]
Aaron M. Myton Oregon Department of Transportation 123 NW Flanders Street Portland, OR 97209 Phone: 503-731-8475 Fax: 503-731- 8531 Email:
[email protected]
Submitted for presentation and publication to the 84th Annual Meeting of the Transportation Research Board January 9–13, 2005
November 2004
7442 Words
Bertini and Myton
2
ABSTRACT In order to improve freeway modeling and operations, it is important to understand how traffic conditions evolve in both time and space. The widespread availability of freeway sensor data makes detailed operational analysis possible in ways that were not available in the past. Inspired by several other studies of a six-mile segment of Interstate 405 in Orange County, California, this paper’s objective is to describe the evolution of traffic conditions over one morning peak period using inductive loop detector data, including vehicle count and lane occupancy measured at 30-second intervals. Using cumulative curves of vehicle count and occupancy, transformed in ways that enhanced their resolution, ten bottleneck activations were identified in time and space over one morning peak period. Upon bottleneck activation, queue propagation was observed in generally predictable ways. Bottleneck outflows were carefully measured only while the bottlenecks were active—that is, while queued conditions persisted upstream and unqueued (freely-flowing) conditions prevailed downstream. When bottlenecks were activated immediately following freely-flowing conditions, outflow reductions were observed upon queue formation. These reductions were consistent with previous studies. The study was limited in that only one day’s data were analyzed, and ramp data were not available on the day analyzed. Future research will include further analysis of the same site using more recent data now that ramp counts are available in the PeMS database. Understanding the mechanisms that lead to bottlenecks activation is a critical step toward improving the understanding of how freeways function and is necessary for addressing operational issues. This clear understanding provides a foundation for determining ramp metering rates and addressing the freeway characteristics that cause bottlenecks to form. INTRODUCTION The objective of this paper is to describe the evolution of traffic conditions from freely flowing to congested conditions over one morning peak period along a six-mile segment of northbound Interstate 405 in Orange County, California (see site map on Figure 1). Inspired by two previous studies, this study identified the activation and deactivation of ten bottlenecks. Bottleneck outflows were measured only while bottlenecks were active, and outflow reductions were observed upon queue formation. The study relied on inductive loop detector data (vehicle counts and lane occupancies) recorded at 30-second intervals along the freeway mainline on Monday, June 1, 1998 between 7:00 and 9:30 a.m. On- and off-ramp data were not available for this day. By examining the available data using a graphical technique that revealed details of changes in cumulative count and cumulative occupancy, this study identified several active bottlenecks within the study area. In addition to describing the activation of freeway bottlenecks, measuring their outflows, this study illustrates that it is advantageous to retain freeway data in its most raw form for analysis. In addition, the study confirmed that it is possible to identify freeway bottleneck activations without pre-specifying speed thresholds. Finally, the study takes advantage of the rich resource in the California Freeway Performance Measurement System (PeMS) database (2). Developed by the California Department of Transportation and the University of California at Berkeley, PeMS collects historical and real-time freeway data from California freeways in order to compute freeway performance measures. During the 2 ½ hour period examined, ten separate queues were observed, activating bottlenecks at six locations through the morning peak period. Once a bottleneck was activated, its outflow characteristics were examined. For example, the transition from freely flowing to queued conditions was typically accompanied by a reduction in outflow ranging between 3-15%. The analysis tools used in this research were cumulative curves of vehicle count and lane occupancy constructed such that their details were amplified. A systematic analysis (illustrated here for one day at one site) is important for improving our understanding of freeway traffic dynamics and is a key first step prior to suggesting, modifying or evaluating any kind of traffic management or control strategy such as ramp metering. BACKGROUND Understanding traffic behavior at a freeway bottleneck provides a foundation for understanding how a freeway system operates. An active bottleneck is a point upstream of which there is a queue and downstream of which there is freely-flowing traffic. This definition is consistent with that described in (1), such that a bottleneck would be serving vehicles at a maximum rate and discharge outflows measured downstream of a queue would not be affected by traffic conditions further downstream. Bottlenecks can be static (e.g., a tunnel entrance) or dynamic (e.g., an incident or a slow moving vehicle) (12). A bottleneck is considered active when it meets the conditions described above and is deactivated when there is a decrease in demand or when there is a spillover from a downstream bottleneck (1,12). Bottlenecks are important components of freeway systems, since the queues that develop upon bottleneck activation may propagate for several miles, causing delay and potentially blocking off-ramps and access to other facilities. (12) Loop detectors are a good source data for the analysis of queue locations. The data are
Bertini and Myton
3
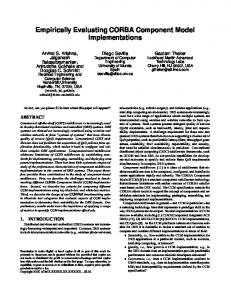
typically readily available, simple to use, and provide basic traffic parameters such as flow, occupancy and speed. In the future, it is possible that closed-circuit television (CCTV) camera, cellular phone and/or other location technologies will provide better surveillance data for freeways. However, at present, the loop detector infrastructure provides a rich and widely available data source that can be tapped for analyzing freeway performance. As noted above, several previous studies have considered data from the same site on the same day (2,3). A comprehensive analysis of congestion, excess demand and effective capacity on California freeways (2) included an analysis of more than 4,000 freeway links in Los Angeles plus a more detailed study of the I-405 site using count, occupancy and speed data from June 1, 1998, aggregated over 5-minute intervals. The authors made a number of conclusions, only some of which are related to the analysis in this paper. One conclusion stated that maximum 5minute freeway flows occurred at speeds of 60 mph. Because speed data were not available for this analysis, it was not possible to assess this finding. The authors also found that the maximum 5-minute throughput of a link (defined in their paper as effective capacity) were dependent upon link characteristics. It should be noted that 5-minute data points might include data measured during more than one traffic state, so sometimes this method can be misleading. This is particularly true if flow data measured at one point are influenced by the capacity of a downstream bottleneck. The authors also concluded that congestion delay can be decomposed into recurrent and nonrecurrent delay, which was also not addressed here. The authors in (2) did suggest that bottleneck throughput increased between 2–5% just prior to queue formation and that effective capacity was apparently stable. These conclusions are consistent with previous findings (6,7,8,9). However, the authors did not identify specific bottleneck locations or specify their activation/deactivation times. As a follow up study, graphical treatments of loop detector data aggregated at 5-minute intervals from (2) were used in another paper (3) as the basis for developing several conclusions relating to freeway control. In that paper, without the advantage of access to the raw 30-second data, the author concluded that the freeway site used in (2) contained a diverge bottleneck between stations 110 and 120 that was activated on June 1, 1998. Also, the analysis contained in (3) traced queue propagation beyond station 20, and the queue(s) present at this site had dissipated by about 9:00 a.m. Further, the analysis in (2) noted that measured flows at station 120 diminished between 7:30 and 9:15 a.m. and that flows and speeds measured at station 20 fell between about 7:40 and 8:30 a.m. A number of these findings will be addressed in this analysis. METHODOLOGY Previous studies used cumulative curves of vehicle count and occupancy constructed from data measured at neighboring freeway loop detectors (4,5,6,7,8,9,10), identifying time-dependent features using transformations of these curves. The same technique was used here study to observe transitions between unqueued and queued conditions. To illustrate this, Figure 2A shows a plot of cumulative vehicle count, N(x,t), for one hour across four lanes at station 50 on northbound I-405 on June 1, 1998. The slope of the N(x,t) at time t is the flow past station 50 at that time. During this period, nearly 9,000 vehicles were counted, and the N(x,t) appears as a nearly straight line. An oblique N(x,t) was plotted in Figure 2B (4,5), where just the vertical difference between the N(x,t) and a line q0t′ was plotted at each time, t. The slope q0 is an oblique rescaling rate (chosen to provide the best graphical resolution) and t´ is the elapsed time from the curve’s beginning. With a new y-axis Figure 2B shows that the oblique N(x,t) amplifies the changes in flow. Figures 2C and 2D show a curve of cumulative occupancy (the percent time a detector was occupied in a measurement interval), T(x,t), measured at station 50 for one hour on June 1, 1998, and an oblique T(x,t) respectively (b0 is the oblique scaling factor). Oblique N(x,t) and T(x,t) were used to study the onset and dissipation of queued conditions at each station. This is illustrated in Figure 2E, a flow-occupancy scatter plot (using data recorded at station 50 between 7:00–8:00 a.m.). Following the arrows in regime U (unqueued), an increase in flow is accompanied by an increase in occupancy, and a flow decrease is accompanied by an occupancy decrease. From Figures 2B and 2D, if conditions were unqueued the slope changes of the N(x,t) would follow the slope changes in the T(x,t). Following the arrows in regime Q (queued), an increase in flow would be accompanied by a decrease in occupancy, and similarly a flow decrease would be paired with an occupancy increase. Under queued conditions, a sudden decrease in slope of the N(x,t) would be accompanied by a sudden increase in the slope of the T(x,t). Vehicles confronted with the sudden onset of queueing are traveling much more slowly across the detector, reflected in the increase in measured occupancy. We relied on this method in this study when comparing changes in slope of oblique N(x,t) and T(x,t) constructed from data recorded at the same measurement location. Using flows and occupancies measured during stationary periods determined from the oblique plot, values were plotted on a scatter plot to confirm the results.
Bertini and Myton
4
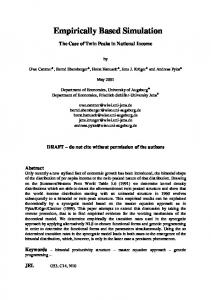
DATA As shown in Figure 1, the freeway study site is located on northbound I-405 between post mile 0.60 and 6.21 in Orange County, California. Along the study site, there are four northbound mainline lanes and a left-hand HOV lane separated by a striped buffer. Auxiliary lanes are also present at stations 30, 50, 130, and 140. Five interchanges are located within the study area. There are 14 loop detector stations that are numbered south to north 10–140. Freeway ramps are located between each station with the exception of stations 100 and 110. Data were collected from the mainline lanes on Monday, June 1, 1998 for a 24-hour period. Single inductive loop detectors recorded vehicle count and occupancy aggregated in 30-second intervals for each lane. Using figures not shown here, it was determined that the HOV lane remained unqueued throughout the day. Therefore data from the HOV lane are not included here. While processing the data for this project it was determined that data were not available at: all on-ramps and off-ramps; station 20 lanes 1, 2 and HOV; station 30 auxiliary lane; and the station 50 auxiliary lane. Finally, the loop data for station 20 loop 4 were found to be underreporting both occupancy and count and were not used in this analysis. ANALYSIS This section describes the steps taken in the analysis of the data measured in the study corridor. As an initial step in the analysis, scatter plots (not shown here) of the raw 30-second occupancy data versus time were prepared for each loop for the entire day (11). The results for all loops were similar, indicating a noticeable peak in the data between the hours of 6:00 a.m. and 9:30 a.m. Next, as shown in Figure 1, raw occupancies were averaged across all mainline lanes and interpolated between detector stations for each 30-second interval and plotted using time as the x-axis, distance as the y-axis, and variation in occupancy as a color scale from green to red. The change in color from green to red indicates an increase in the percent occupancy recorded. It is clear from the figure that higher occupancies were measured beginning just before 7:30 a.m. until shortly after 9:00 a.m. Next, oblique N(x,t) and oblique T(x,t) were constructed for each loop detector and for each station (11). Figure 3 shows the result for station 50. Using the left axis, the oblique N(x,t) was plotted using total counts measured in all four mainline lanes, and an oblique scaling rate of 9,000 vph was chosen to amplify the changes in flow throughout the morning peak period (the period between 7:00 a.m. and 9:30 a.m. is shown in the figure). Figure 3 also includes the oblique T(x,t) for station 50 using the right axis, and the plot includes the total lane occupancy measured by all four mainline detectors. An oblique scaling rate of 3000 sec/hour was chosen for this plot. Next, stationary periods were identified as piecewise linear segments shown superimposed over the N(x,t) and T(x,t). A straightedge can be used to verify these delineations. These periods are further delineated by the vertical lines on the figure. The average flow measured in vehicles per hour (in bold) and average occupancy (measured in seconds per hour) were then added to the figure. Each stationary period represents a traffic state (flow-occupancy pair) that can be plotted on a flow-occupancy plane. Note that numerical flow or occupancy thresholds were not used here; rather the relative changes in flow and occupancy were considered. On the lower portion of Figure 3, each nearly stationary period (referred to as a numbered segment on the figure) was identified as either queued or unqueued. For example, Figure 3 shows that between 7:00 and 7:13 (time segment 1) the N(x,t) and T(x,t) did not display any abrupt changes. Segment 1 was identified as unqueued. As further confirmation, the inset in Figure 3 contains a flow-occupancy scatter plot. As shown, the point representing the stationary state in segment 1 (flow= 9083 vph and occupancy=2097 sec/hr) is located to the left in regime U. Using a straightedge, it is now possible to see that both the N(x,t) and T(x,t) increased at 7:13, which is consistent with regime U shown in Figure 2E. The flow increased from 9083 vph to 10480 vph and the occupancy increased from 2097 sec/hr to 2673 sec/hr. The simultaneous increase in flow and occupancy provided a visual clue that conditions were unqueued. Traffic conditions remained stationary (there was little deviation between that N(x,t) or the T(x,t) and a straight line) until 7:22. The flow-occupancy state occurring during segment 2 was also plotted on the flow-occupancy plane in the inset in Figure 3. This state also resided in regime U. At 7:22, there was an abrupt increase in the slope of the T(x,t), accompanied by a decrease in slope of the N(x,t). This is the classic signal of the passage of the tail of a queue, bringing with it lower flow and higher travel times across the loop detectors. The traffic state (segment 3) beginning at 7:22 continued until 7:35:30, and its flowoccupancy values are plotted on the inset as point 3, which falls in regime Q. This procedure continued for the remainder of the morning peak for all detector stations. The onset of queued conditions recorded at 7:22 was followed by a sequence of nearly stationary queued periods until 8:36. During this period each reduction in N(x,t) was accompanied by an increase in the T(x,t), the signal of queued conditions. The flow-occupancy values for each stationary period identified (segments 4, 5 and 6) were also plotted on the inset in Figure 3, confirming that conditions continued to remain in the queued regime.
Bertini and Myton
5
At 8:36 a reduction in T(x,t) was visible accompanied by a slight increase in flow. When plotted on the flow-occupancy plane, segment 7 returned to the unqueued regime. At 8:44 and at 9:00 there were decreases in both flow and occupancy—signals of unqueued conditions at station 50 (see Figure 2E), confirmed by the locations of points 8 and 9 on the flow-occupancy plane. Therefore, at station 50, the beginning and ending of the queued sequence occurred at 7:22 and 8:36 respectively. While not critical to confirm the analysis described above, we note that the slope of a line connecting the origin to a point on the flow-occupancy plane is related to the speed prevailing during that state. As shown, states 1, 2, 7, 8 and 9 that fall into the unqueued regime would sustain higher velocities than states 3–6, which lie in the queued regime with lower velocities. However, it is not necessary to apply any sort of speed threshold at this point. The same procedure was followed for stations 60, 70, 80, 90, 100 and 120 (see Figures 4–9) and stations 10–40, and 130–140 (not shown here) using data measured across all mainline lanes, as well as for each individual detector (11). By identifying stationary unqueued and queued states at each station, confirming them using a flowoccupancy scatter plot, and mapping the points on Figure 1, the result was a visual description of queue propagation and dissipation, resulting in the identification of ten distinct bottleneck activations at six distinct locations. Figure 1 uses points (diamonds) to map the position of the backward moving shock (with higher occupancy) that passes upstream after bottleneck activation, with solid lines connecting those points. The result is a map of the tail of each queue upon activation as far as can be determined from the loop detector locations. Also shown in the figure are points (squares) representing the times marked by the passage of recovery waves (with lower occupancy). These squares are also connected by solid lines to demark the transition from queued to unqueued conditions. Dashed lines were added to the figure by interpolation to approximate conditions between measurement locations. Note that Queue 7 resulted from a bottleneck located somewhere downstream of station 140, outside of our study area. Also, note that queues spilled back upstream of station 10 (outside of our study area) for three time periods between 7:45 and 8:25. Finally, when dealing with loop detector data measured at discrete points along the freeway, it is only possible to identify the location of an active bottleneck as being between two detector stations. RESULTS As described above and mapped on Figure 1, a total of ten active bottlenecks were identified on this section of northbound I-405 on June 1, 1998. As shown in Figure 1, Queue 1 formed between stations 50 and 60 and Queue 2 formed between stations 70 and 80. Queue 2 extended beyond station 10 and deactivated Queue 1. Queue 3 formed between stations 90 and 100 and merged with Queue 2 thus deactivating Queue 2. Queue 3 was deactivated at 7:42:00, and Queue 10 formed between stations 80 and 90. Queue 10 deactivated and Queue 4 formed between station 50 and 60. No queuing was observed at station 60 in the period 7:54–8:01. Queue 5 formed between stations 110 and 120 and merged with Queue 4, deactivating the upstream bottleneck. Queue 5 quickly dissipated, and Queue 9 became activated between stations 90 and 100. Queue 9 dissipated and Queue 6 became active between stations 70 and 80. At 8:39 Queue 6 dissipated. Queue 7, which spilled back from some downstream bottleneck, was observed at station 140 at 8:34 and dissipated a few minutes later. Queue 8 briefly formed between stations 90 and 100, and dissipated a few minutes later. Table 1 summarizes some characteristics of each queue, including its location, and average bottleneck input flow and bottleneck outflow measured while it was active. In addition for the five bottleneck activations that were preceded by freely flowing conditions (Queues 1, 2, 3, 5 and 8), the value of the sustained bottleneck input and outflows prior to queue formation is also listed. The differences between the pre-queue flows and active bottleneck input flows are also listed as a percentage in the table and range between 3–15%. In previous studies of freeway bottlenecks with higher resolution detection (and fewer interruptions from on- and off-ramps), active bottleneck discharge flows have been reported, where flows have been measured immediately downstream of active bottlenecks (6,7,8,9). For this study, we are reporting bottleneck input flows (measured just upstream of the head of the queue) and bottleneck outflows (measured at the next station downstream of the head of the queue) since in all cases there is an on- or off-ramp entering the downstream segment. Diagnosis of Queue 1 This bottleneck was activated between stations 50 and 60 subsequent to freely flowing conditions. From Figure 3 (and other figures not shown here), the queue’s shock arrival was visible at station 50 at 7:22:00, then arrived at station 40 at 7:22:30, and station 30 at 7:24:30 (this is visible from flow reduction and occupancy increase). In Figure 4, a corresponding flow reduction was visible at station 60 at approximately 7:22, and it is clear that this reduction came from upstream as shown by the consistency of the N(x,t) and T(x,t). Queue 1 was deactivated at approximately 7:33 by the passage of Queue 2. In order to assess the magnitude of the input flow arriving from the on-ramp from Hwy. 133, just upstream of station 50, a plot (N(50,t)−N(40, t)) was constructed, defined as the
Bertini and Myton
6
difference between cumulative counts measured across all lanes at stations 40 and 50. This showed the approximate input flow between the two stations. Between 7:00 and 7:17:30, the input flow was steady at 1347 vph. At 7:17:30 there was a 64% surge in flow (to 2208 vph) sustained for 2:30 minutes. This was followed by a drop in input flow (to 655 vph until 7:26:30) and two minutes later Queue 1 was activated. Diagnosis of Queue 2 This bottleneck was activated between stations 70 and 80, by virtue of its shock arrival that was visible at station 70 at 7:33 and station 60 at 7:34:30 (flow decreases and occupancy increases in Figures 4 and 5). There was a flow reduction visible at station 80 at 7:33:30 in Figure 6 (came from upstream as shown by consistency of N(x,t) and T(x,t). Queue 2 merged with upstream Queue 1, deactivating Queue 1 at approximately 7:35:30. Also using a plot of (N(70,t)−N(80,t)) we could assess the flow using the University Dr. off-ramp. Between 7:14:00 and 7:32:30 there was a steady flow of 992 vph. However at 7:32:30 there was a surge for 1:30 minutes at a level of 1720 vph representing a 73% increase. This occurred roughly one minute before Queue 2 was activated. Diagnosis of Queue 3 A bottleneck was activated between stations 90 and 100 for a short time, based on the visibility of a shock arrival at station 90 at 7:36 and station 80 at 7:38:30, as shown in Figures 6 and 7. The sharp flow decreases and occupancy increases confirm this. Further, a flow reduction was visible at station 100 at 7:36, which came from upstream as shown by the consistency of the N(x,t) and T(x,t). Upon its activation, Queue 3 deactivated Queue 2 further upstream at approximately 7:41. Upon its dissipation, Queue 3 activated Queue 10 between stations 80 and 90 at approximately 7:42. By plotting (N(100,t)−N(90, t)) to gain an approximation of the University Dr. on-ramp flow, it appears that there might have been a slight surge in flow from 993 vph to 1080 vph at about 7:35 (9% increase) which was followed by the activation of Queue 3 for a short time at 7:36. Diagnosis of Queue 5 Between stations 110 and 120, Queue 5 was activated for a short time as shown in Figures 4–8 (and others not shown here). The queue’s shock arrival was visible at station 110 at 7:54:00, station 100 at 7:54:00, station 90 at 7:56:30, station 80 at 7:57:30, station 70 at 8:00 and station 60 at 8:01 (a flow decrease was accompanied by a sharp occupancy increase in all instances). Queue 5 merged with Queue 4 between stations 50 and 60 at about 8:01. Queue 5 was deactivated a few minutes later as Queue 9 was activated between stations 90 and 100. Plotting an oblique curve of (N(110,t)−(120,t)) revealed the approximate flow using the Culver Dr. off-ramp. There was a large surge in flow from 553 vph between 7:30 and 7:49 to 1428 vph until 7:54 when Queue 5 was activated (representing a 158% increase). Diagnosis of Queue 8 Finally, Queue 8 was activated between stations 90 and 100, as shown in Figures 5–7, where the shock arrival was visible at station 90 at 8:51, station 80 at 8:54 and station 70 at 8:57. The recovery wave followed just before 9:00. Traffic conditions returned to freely flowing after this time. In order to assess the flows from the University Dr. onramp and the Culver Dr. off-ramp, oblique curves of (N(100,t)−N(90,t)) and (N(100,t)−N(120,t)) were plotted respectively. At 8:45:30 and at 8:50 it appeared that there were surges in flow at both locations followed by the activation of Queue 8. CONCLUSIONS This study focused on the analysis of freeway traffic conditions along a six-mile segment of northbound I-405 in Orange County, California. Using PeMS data collected on one day (June 1, 1998), it has been shown that a total of ten queues formed and dissipated on this day. The analysis tools used were curves of cumulative vehicle count and occupancy, based on data collected at 30-second intervals. By transforming these curves it was possible to visually identify stationary periods of queued and unqueued traffic. It was not necessary to aggregate the data over longer time periods, nor was it necessary to establish arbitrary speed thresholds to identify bottleneck activations. It was also shown that when bottlenecks were activated immediately following freely-flowing conditions, flow reductions were observed upon queue formation, ranging between 3–15%. Because of limitations in detector locations, it is difficult to draw major conclusions regarding bottleneck capacity. This study also found that there were no queued conditions in the adjacent, buffer-separated HOV lane. In most cases, bottlenecks were activated in the vicinity of on- or off-ramps. In some cases it was possible to link changes in ramp flow with the onset of queueing. Further research in this regard is ongoing.
Bertini and Myton
7
It was mentioned earlier that previous studies (2,3) analyzed data measured on the same day (June 1, 1998) at the same site at 5-minute aggregation level. The analysis in (2) noted that link (bottleneck) outflow depends on its temporal and spatial characteristics. This paper can be seen to confirm this finding when and if the outflow is measured at an active bottleneck. The research in (2) also found evidence of reductions in outflow upon queue formation (on the order of 2-5%) and relatively stable bottleneck outflow; these findings seem reasonable based on the results of this analysis. The findings from (3) included the diagnosis of a diverge bottleneck between stations110 and 120. While this appeared to be true for a short period (Queue 5), there were also bottleneck activations at other locations, apparently due to the impacts of flows to and from other ramps. Queues emanating from locations within this site did propagate upstream past the study limits, and the site was impacted by a bottleneck downstream of station 140. These findings are consistent with (3). One difference is that it appeared that queued conditions began at approximately 7:38, which was later than noted in (3). Most importantly, the results of this analysis indicate the need for a comprehensive understanding of where, when and how bottlenecks were activated prior to making conclusions about freeway capacities and/or specific control measures. It would also be helpful to analyze incident logs from the day in question. This study was focused on one particular day on one particular site, in part due to previous studies at the same site and on the same day. However, this study was limited by the absence of ramp counts and the absence of higher detector resolution. Due to the rich resource of the PeMS database, future research will include further analysis of the same site using more recent data now that ramp counts are available for periods since 2002. Given the unlimited possibilities to examine this site over multiple days (thanks to the richness of PeMS), future research should concentrate on replicating this study and on ways to partially automate and/or simplify the analysis across multiple days. The results of a larger scale analysis could be used to calibrate and/or validate freeway simulation models. It has been shown that it is highly advantageous to retain freeway data in its most raw form for analysis. In addition the study confirmed that it is possible to identify freeway bottleneck activations without pre-specifying any arbitrary speed thresholds. It is hoped that this procedure could be first replicated in a manual fashion, and perhaps then semi-automated using a large database of traffic conditions such as PeMS. ACKNOWLEDGEMENTS The authors gratefully acknowledge Prof. Pravin Varaiya, Prof. Alexander Skabardonis of U.C. Berkeley and Dr. Karl Petty of Berkeley Transportation Systems for providing access to the data via the California PeMS system. Pherak Hay and Vu Mai assisted with extracting and preparing the data for analysis. Roger Lindgren helped review the final manuscript. The authors also thank the anonymous reviewers for their helpful comments and suggestions for improving the paper. REFERENCES Daganzo, C.F. Fundamentals of Transportation Engineering and Traffic Operations, Elsevier Science, Oxford, 1997. 2. Jia, Z., P. Varaiya, C. Chen, K. Petty and A. Skabardonis. Congestion, Excess Demand, and Effective Capacity in California Freeways. PeMS Development Group, University of California at Berkeley, 2000. 3. Cassidy, M.J. Critique of a Freeway On-Ramp Metering Scheme and Broader Related Issues. University of California, Institute of Transportation Studies, Research Report, UCB-ITS-RR-2002-4, 2002. 4. Cassidy, M.J. and J.R. Windover. Methodology for Assessing Dynamics of Freeway Traffic Flow. In Transportation Research Record: Journal of the Transportation Research Board, No. 1484, TRB, National Research Council, Washington, D.C., 1995, pp. 73–79. 5. Munoz, J.C. and C.F. Daganzo. Fingerprinting Traffic from Static Freeway Sensors. Cooperative Transportation Dynamics, Vol. 1, 2002, pp. 1.1–1.11 6. Cassidy, M.J. and R.L. Bertini. Some Traffic Features at Freeway Bottlenecks. Transportation Research Part B, Vol. 33, 1999, pp. 25–42. 7. Bertini, R.L. and M.J. Cassidy. Some Observed Queue Discharge Features at a Freeway Bottleneck Downstream of a Merge. Transportation Research Part A, Vol. 36, 2001, pp. 683–697. 8. Bertini, R.L. Time-Dependant Traffic Flow Features at a Freeway Bottleneck Downstream of a Merge. Ph.D. Dissertation, University of California, Berkeley, 1999. 9. Cassidy, M.J. and R.L. Bertini. Observations at a Freeway Bottleneck in Transportation and Traffic Theory. Proceedings, 14th International Symposium on Transportation and Traffic Theory, Jerusalem, 1999, pp. 107 – 124. 10. Cassidy, M.J. and J. Rudjanakanoknad. Empirical Study of Ramp Metering and Capacity. University of California, Institute of Transportation Studies, Research Report, UCB-ITS-RR-2002-5, 2002. 1.
Bertini and Myton
8
11. Myton, A. I-405 Bottleneck Analysis. M.S. Report, Portland State University, Department of Civil & Environmental Engineering, 2004. 12. Leal, M. Empirical Analysis of Traffic Flow Features of a Freeway Bottleneck Surrounding a Lane Drop. M.S. Report, Portland State University, Department of Civil & Environmental Engineering, 2002. LIST OF TABLES Table 1
Queue Features
LIST OF FIGURES Figure 1 Figure 2 Figure 3 Figure 4 Figure 5 Figure 6 Figure 7 Figure 8 Figure 9
37 15 17 19 21 23 25 29
Site Map and Occupancy Diagram Methodology Illustrations Station 50 – Loops 1–4, Oblique N(x,t) and T(x,t) Station 60 – Loops 1–4, Oblique N(x,t) and T(x,t) Station 70 – Loops 1–4, Oblique N(x,t) and T(x,t) Station 80 – Loops 1–4, Oblique N(x,t) and T(x,t) Station 90 – Loops 1–4, Oblique N(x,t) and T(x,t) Station 100 – Loops 1–4, Oblique N(x,t) and T(x,t) Station 120 – Loops 1–4, Oblique N(x,t) and T(x,t)
Bertini and Myton
TABLE 1
Queue 1
2
3
4
5
6 7 8
9
10
Input Station 50
9
Queue Features
Outflow Station
Pre-Queue Flow Flow Duration vph mm:ss 10500 9:00
Bottleneck Flow Flow Duration vph mm:ss 9600 13:30
Difference (%) 8.2
60
9500
8:00
9200
9:00
3.3
10200
19:00
9762
8:30
4.3
9100
6:30
8800
5:00
3.7
9300
7:00
8700
6:00
6.8
10200
27:00
9600
5:00
6.2
7400
7:00
8300
7:00
70 80 90 100 50 60 110 120
10200
3:30
8700
4:00
14.6
9200
2:30
8500
4:00
7.3
8900
22:30
8100
22:30
10100
8:00
70 80 140 90 100 90 100 80 90
7600
2:30
7300
7:30
4.5
8300
2:00
8200
7:00
1.2
8200
12:30
9200
16:00
8700
12:30
8100
7:30
Note: flows are consistent with Figures 3–9 but have been rounded to the nearest 100 vph.
Bertini and Myton
10
Queue 7
5.60
Station 140
LEGEND Queue - Activation Queue - Deactivation
130 120
Queue 5
Queue 3
Queue 8
Queue 9
4.60
Culver Dr.
110 100
Post mile
Queue 10
3.60
90 80
Queue 6
Queue 2
University Dr.
70 60
Queue 1 Queue 4
2.60
50 40
20 10
0.60
FIGURE 1
Travel Direction Hwy. 133
30
1.60
7:00
Sand Canyon Ave.
7:30
Site Map and Occupancy Diagram
8:00 Time, t
8:30
9:00
Irvine Center Dr.
Bertini and Myton
FIGURE 2
Methodology Illustrations
11
Bertini and Myton
12
1873
7449
-15000 1549
7473
7948
FIGURE 3
5
Station 50 – Loops 1-4, Oblique N(x,t) and T(x.t)
8081 5
-16500
Queued -17000
5000
2500
Occupancy (seconds/hr)
Time, t
7 8:36:00
6 8:00 8:01:00
4 7:54:00
7:13:00
3 7:22:00
2
1 7:00
-48500
T(50,t) - b0 (50)t'
7:35:30
-48000
9
0 0
4 6
Unqueued
4067
2673
2097
-47500
8
3
7
8
9 9:00
-47000
2 1
8:44:00
4716
-16000
12,000
Flow (vph)
5110
-46500
6692
-15500 8288
-46000
5119
N(50,t) - q0 t', q0 = 9000 vph
-45500
T(50,t) - b0 t', b0 = 3000 seconds per hour
7816
4674
N(50,t) - q0 (50)t'
9622
10480
9083
-45000
-14500
2637
-44500
SEGMENT # NO QUEUE QUEUE
Bertini and Myton
13
-44000
1631
-10600
1085
-45500
-11200 6103
2240
3172
2838
T(60,t) - b0(60)t'
-11400
3094
2010
1962
2582
-46000
-46500
-11600
Station 60 – Loops 1-4, Oblique N(x,t) and T(x.t)
Time, t
9
10 9:00 9:01:00
8 8:39:30
7 8:22:00
6 8:00 8:01:00
5 7:54:00
7:34:30
4 7:31:30
7:22:00
7:00
3
2 7:14:00
1
-47000
FIGURE 4
-10800
-11000
7649
8379
-45000
1510
N(60,t) - q 0t', q0 = 8500 vph
7906
T(60,t) - b 0t', b0 = 2000 seconds per hour
2438
-44500
7511
8289
7809
N(60,t) - q0(60)t'
8520
9525
9208
9560
-10400
-11800 SEGMENT #
NO QUEUE QUEUE
-53500
FIGURE 5 Station 70 – Loops 1-4, Oblique N(x,t) and T(x.t) Time, t 6 7 8 9 9:00 9:01:00
5
-52500 T(70,t) - b0(70)t' 6772
1403
8629
10 11
-13000
-51500 -13200
-13400
-13600
T(70,t) - b 0t', b0 = 2400 seconds per hour
8010
3199
8958 6480 9146
-52000
8:57:00
3368
2881
4663 2595
2509
8904
8255
9367
8880 8130
9762
10172
9206
N(70,t) - q0(70)t'
8:49:00 8:50:00
2705
3271
8:39:00
4 8:16:30
3
8:00
2 7:51:30
1 3578
8880
-51000
7:41:30
-53000 2341
1863
-50500
7:33:00
7:14:00
7:00
N(70,t) - q 0t', q0 = 9500 vph
Bertini and Myton 14
-12600
-12800
-13800
SEGMENT # -14000
NO QUEUE QUEUE
-47000
FIGURE 6 Station 80 – Loops 1-4, Oblique N(x,t) and T(x.t) Time, t 8 9 10 11 7530
7008
1416
2113
3691
3700 2440
2504
7815
-44000
-14800
-14900
-15000
-15100
-46500
12 13 14
T(80,t) - b 0t', b0 = 2600 seconds per hour
6081
-45500 N(80,t) - q0(80)t' 6936 7265
3613
9:05:30
7
8090
3371
7563
8:54:00 8:59:30 9:00
6
6446
8718
7657
8808
9144
9617
8412
T(80,t) - b0(80)t'
8:46:30 8:49:00
5 4680
2536
3791
-45000
8:16:30
2694
2628
-46000
7:57:30 8:00 8:01:00
4
7:49:00
3 7:38:30
2 7:33:30
1 7:26:00
2206
1894
-44500
7:15:00
7:00
N(80,t) - q 0t', q0 = 8500 vph
Bertini and Myton 15
-14600
-14700
-15200
-15300 SEGMENT #
NO QUEUE QUEUE
-48200
FIGURE 7 Station 90 – Loops 1-4, Oblique N(x,t) and T(x.t) Time, t 10 1112 13 14 6110
7098
-47200
9:11:30
9
1506
7288
3873 2652
2579
8260
T(90,t) - b0(90)t'
9:00 9:01:30
8
3106
8187
1813
-46000
-46600 -15500
-47400
15 16
-15600
-15700
4102 -15800
-15900
T(90,t) - b 0t', b0 = 2800 seconds per hour
2939
7491 7632 4233
8535
8645
7244
N(90,t) - q0(90)t'
8:58:30
7
8:48:30 8:51:00
6 8:45:00
-47000 3836
-46800
8:22:00
-47800 4752
9088
8074
8650
9283
9437
8660
7914
8:15:30
5 7:56:30 8:00 8:02:00
4 2890
2672
3502
2816
2525
-46400
7:49:00
3
7:42:00
2 7:36:00
1 7:29:00
-47600 2164
-46200
7:15:00
7:00
N(90,t) - q 0t', q0 = 8750 vph
Bertini and Myton 16
-15300
-15400
-48000 -16000
SEGMENT # -16100
NO QUEUE QUEUE
-44000
FIGURE 8 3 4
Station 100 – Loops 1-4, Oblique N(x,t) and T(x.t) Time, t 8 9 10 11 12 9:04:00
7
8:59:00 9:00
-42500 1520
3459
2033
2464 2109
2409
-10100
13 14
-10200
-10300
-10400
-10500
T(100,t) - b0(100)t' -10600
T(100,t) - b 0t', b0 = 2000 seconds per hour
8796
8220 8297 8229
8328
8205
7045
9511
N(100,t) - q0(100)t'
8:45:00 8:50:00 8:52:00
6
9206
8453
10500
9327
9612
-41500
8:41:00
2298
10247
2251
-43000
8:16:00
5 3011
2755
2101
2205
2294
9440
-42000
7:54:00 7:58:30 8:00
2 7:50:00
1 7:41:00
2031
-43500
7:36:00
7:09:00
7:00
N(100,t) - q 0t', q0 = 8500 vph
Bertini and Myton 17
-9900
-10000
-10700
SEGMENT # -10800
NO QUEUE QUEUE
Bertini and Myton
18
7905 1724
6579
-10250
T(120,t) - b0(120)t' -10300
8726
-44600
-10350 1393
-44800
-45000
-10400
10 9:07:00
9 9:00
8 8:43:00
7
8:36:30
8:00
Station 120 – Loops 1-4, Oblique N(x,t) and T(x.t)
Time, t
6 8:23:30 8:26:30
5
4 7:52:30 7:55:00
3 7:38:00
7:00
2 7:10:30
1
-45200
FIGURE 9
T(120,t) - b 0t', b0 = 1900 seconds per hour
8105 2061
-10150
-10200
2232
1928
1949
2068
-44400
2119
1798
1854
-44200 N(120,t) - q 0t', q0 = 8500 vph
8522
9565
-44000
9192
8686
N(120,t) - q0(120)t'
8814
-10100 9300
-43800
SEGMENT # -10450 NO QUEUE QUEUE