Using PPG Morphology to Detect Blood Sequestration Stephen P. Linder1, Suzanne M. Wendelken, Susan P. McGrath Department of Computer Science, Thayer School of Engineering, Dartmouth College. Hanover, NH, USA.
Changes in the morphology of the pulsatile component of the photoplethysmogram (PPG) have been shown to vary with the respiratory cycle, but changes in the morphology caused by blood sequestration has not been investigated. The morphological techniques used in this study allow the detection of changes in blood sequestration cause by changes in posture by monitoring how the shape of individual cardiac pulses change with time. Whereas frequency domain techniques can be used effectively to analyze stationary processes, analyzing the morphology of each individual cardiac cycle allows us to detect and characterize the dynamic changes in heart rate, peripheral vasoconstriction and changes in the dynamics of the blood flow to the peripheral associated with the baroreflex response to standing. Because volume sequestration of blood in the lower extremities mimics the effect of rapid blood loss from traumatic injury, these results may have significance for the automatic detection of the baroreflex response to life threatening hemorrhaging in mass casualty and battlefield situations (Shamir, Eidelman et al. 1999; Olsen, Vernersson et al. 2000; Cooke, Ryan et al. 2004).
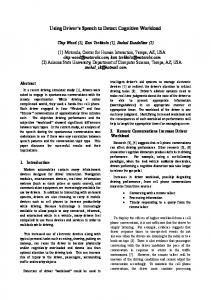
to either a loss of central blood pressure or constriction of the arterioles perfusing the dermis (Partridge 1987; Shamir, Eidelman et al. 1999). The pulse height is also constantly changing due to the RSA (Johansson 2003). A weakness of using pulse height as a feature, even for detecting RSA, is that it can not be calibrated and the absolute pulse height will vary depending on how and where the sensor was applied to the skin. Three morphological features, labeled in Figure 1, are used: the Pulse Height (PH) is the difference between the maximum of a cardiac cycle and the previous minimum; the Cardiac Period (CP) is the difference in time between the peaks of two consecutive cardiac cycles, and the Normalized Peak Width (NPW), the Peak Width (PW) divided by the Cardiac Period (CP). The PW is the width of the peak at a Peak Threshold (PT). A PT value of 10% was selected because it was the mean height at which the slope of the trailing edge of the PPG begins to shift from being nearly linear, indicating rapid and active blood flow from the skin, to being approximately quadratic, indicating that the blood is stagnating between cardiac pressure waves (Wisely and Cook 2001). This is shown graphically in Figure 1 by the superimposed linear and quadratic dotted line.
PPG
METHODS AND MATERIALS A diverse group of eleven subjects, four women and seven men ages 20 – 43, participated in the study with informed verbal consent. The only inclusion criterion was that the subjects did not have a known cardiovascular condition. BACKGROUND Using two FDA approved Nonin® pulse oximeters placed The DC component of the PPG signal is attributable to the on the finger and ear, we monitored 11 subjects, for three trials bulk absorption of the skin tissue, while the pulsatile component each, as they stood from a supine position. Each cardiac cycle is directly attributable to variation in the amount of blood in the was automatically extracted from the PPG waveform and charskin caused by the pressure pulse of the cardiac cycle. Historiacterized using statistics corresponding to normalized peak cally frequency domain analysis (Bootsma, Swenne et al. 1996; width, instantaneous heart rate, and amplitude of the pulsatile Rusch, Sankar et al. 1996; Gratze, Fortin et al. 1998) was used component of the ear PPG. A nonparametric Wilcoxon rank to analyze this pulsatile component. However, the use of time sum test was then used to detect in real-time changes in these domain techniques to extract information from the PPG signal features. Data Analysis has gained acceptance (Shamir, Eidelman et al. 1999; JohansMatlab®-based signal processing software was written to son 2003; Shelley, Tamai et al. analyze the PPG data. The algorithm 125 2005). extracts pulse morphology features Even thought the cardiac pressure 120 Cardiac from the PPG using a mixed-state feaPeriod pulse is somewhat damped by the 115 (CP) ture extractor. time it reaches the skin, it is enough Pulse Derived PPG statistics are filtered 110 Height to distend the arteries and arterioles (PH) using a Savitzky-Golay smoothing filin the subcutaneous tissue. This cor105 ter which fits a piecewise continuous responds to the rising edge of the 100 Peak Peak polynomial spline to data. Events aspulse waveform. The shape of falling Threshold Width (PT) sociated with standing are detected 95 (PW) edge of the pulse and the trough beusing nonparametric single-tail Wiltween pulses characterizes the venous 90 coxon rank sum test. The Wilcoxon response to the cardiac cycle. 85 rank sum test was used to test the null The height of pulsatile compo80 hypothesis (p < 0.01) that one sample nent of the PPG is proportional to the 592 592.5 593 has a statistically significant probabilpulse pressure, the difference between Time (sec) ity of having a higher (or lower) methe systolic and diastolic pressure in dian that another sample. Figure 1. Features of the pulsatile component of the arteries. A reduction of pulsatile the PPG used to detect standing are shown: Pulse amplitude can be directly attributable RESULTS Height (PH), Cardiac Period (CP), and Peak The output of real-time WilcoxonWidth (PW). A fourth feature, the Normalized based detectors was tuned to discern 1 Peak Width (NPW) is the ratio of PW to CP. Email:
[email protected]
PPG
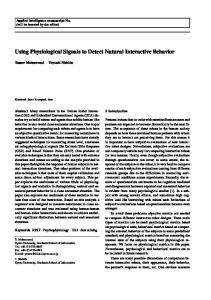
abrupt increase in HR, NPW hypothesis that the baroreflex first 0.9 from the finger sensor, and reduces the percentage of time blood abrupt decrease in ear PH flow is stagnant during the cardiac 0.8 from the ear sensor. A peak cycle, then increases the hear rate, in HR was detected in all and finally vasoconstricts the periph0.7 trials for all subjects with eral tissue in order to reestablishing a one false positive from a nominal blood pressure. These three 0.6 strong RSA. Constriction of features therefore can be used as a rethe PHEAR was detected was liable detector of the baroreflex re0.5 detected for 9 of the 11 subsponse to changes in posture or other 0.4 jects with no false alarms. forms of blood volume sequestration. While Subject 1 has a visuACKNOWLEDGEMENT 0.3 ally detectable pinch, it was This research program is a part of the Instionly detected for one trial. tute for Security Technology Studies, supported 0.2 Subject 9 shows a unique 30 30.5 31 31.5 32 32.5 33 33.5 34 34.5 35 under Award number 2000-DT-CX-K001 from the U.S. Department of Homeland Security, Sciresponse to standing, with Time (sec) ence and Technology Directorate. Points of view the peak amplitude increase in this document are those of the authors and do Figure 2. Comparison of relative trough width 30 sec before not necessarily represent the official position of for all three trials. the U.S. Department of Homeland Security or the standing (black) and just before standing (gray).The graphs A peak in the NPW corScience and Technology Directorate. are aligned so that the second peaks coincide with the responding to standing was graphs for the finger (dashed) and ear (solid) PPG. The detected in all but two triREFERENCES heart rate increase before standing is almost completely atals; detection was missed Bootsma, M., C. A. Swenne, et al. (1996). "Heart rate variability during repeated incretributable to the narrowing of the troughs between the for Subject 2, Trial 1, and mental head-up tilt discloses time dependence of Subject 5, Trial 1. One false peaks. individual autonomic dynamics." Clinical Carpositive was detected coindiology 19(1): 62-8. cident with false positive for HR. Cooke, W. H., K. L. Ryan, et al. (2004). "Lower body negative pressure as a CONCLUSION The blood sequestration from the orthostatic stress induced by standing from a supine position created enough of a physiological response so as to result in reliably detectable changes in the morphology of the PPG pulse. While a peak in HR alone would be ambiguous, the detection of a peak in NPW pulse along with the constriction of the PHEAR clearly indicates that the baroreflex associated with standing has occurred. It was not expected that a rising peak in the NPW would be detected even before standing commenced. In 21 trials the NPW begins to peak after the prompt at 57 seconds, but before the subject actually stands at 60 seconds. This narrowing of this phase of the cardiac cycle is indicative of a shortening of time that blood remains stagnant in the skin between cardiac pressure waves as the cardiovascular system rapidly adapts to orthostatic stress of standing. As seen in Figure 2, the shape of the pressure pulse does not change significantly, yet the trough between the peaks shortens substantially. This would seem indicative of an increase in efficiency of the cardiac cycle. Over 31 trials NPW peaks on average 2.97 (STD = 1.87) seconds before PHEAR. After standing commences the HR quickly peaks, followed by a constriction of PHEAR. In all 33 trials, the standing event was detected as an abrupt change in at least two of these features, with only one false alarm. In 26 trials, an abrupt change was detected in all three features, with no false alarms. An increase in the normalize peak width was always detected before an increase in heart rate, and in 21 trials this feature peaked before standing commenced. After standing, the pulse rate always increases, and then amplitude of the ear PPG constricts by a factor of two or more. We
model to study progression to acute hemorrhagic shock in humans." Journal of Applied Physiology 98: 1249–1261. Gratze, G., J. Fortin, et al. (1998). "A software package for non-invasive, realtime beat-to-beat monitoring of stroke volume, blood pressure, total peripheral resistance and for assessment of autonomic function." Computers in Biology & Medicine 28(2): 121-42. Johansson, A. (2003). "Neural Network for photoplethysmographic respiratory rate monitoring." Medical & Biomedical Engineering & Computing 41: 242-248. Olsen, H., E. Vernersson, et al. (2000). "Cardiovascular response to acute hypovolemia in relation to age. Implications for orthostasis and hemorrhage." AJPHeart and Circulatory Physiology 278: H222-H232. Partridge, B. L. (1987). "Use of pulse oximetry as a noninvasive indicator of intravascular volume status." J Clin Monit 3(4): 263-8. Rusch, T. L., R. Sankar, et al. (1996). "Signal Processing Methods for Pulse Oximetry." Comput. Bol. Med. 26(2): 143-159. Shamir, M., L. A. Eidelman, et al. (1999). "Pulse oximetry plethysmographic waveform during changes in blood volume." British Journal of Anaesthesia 82(2): 178-181. Shelley, K. H., D. Tamai, et al. (2005). "The Effect of Venous Pulsation on the Forehead Pulse Oximeter Wave Form as a Possible Source of Error in Spo2 Calculation." Anesthesia and Analgesia 100: 743-747. Wisely, N. A. and L. B. Cook (2001). "Arterial flow waveforms from pulse oximetry compared with measured Doppler flow waveforms apparatus." Anaesthesia 56(6): 556-61.
2