Using Sentinel Technology in the TARGIT BI Suite Morten Middelfart
Torben Bach Pedersen
TARGIT A/S Hjørring, Denmark
Aalborg University Dept. of Computer Science Aalborg Ø, Denmark
[email protected]
[email protected]
ABSTRACT This paper demonstrates so-called sentinels in the TARGIT BI Suite. Sentinels are a novel type of rules that can warn a user if one or more measure changes in a multi-dimensional data cube are expected to cause a change to another measure critical to the user. We present the concept of sentinels, and we explain how sentinels represent stronger and more specific rules than sequential patterns and correlation techniques. In addition, we present the algorithm, implementation, and data warehouse setup that are prerequisites for our demo. In the demo we present a dialogue where users, without any prior technical knowledge, are able to select a critical measure, a number of cubes, and a time dimension, and subsequently mine and schedule sentinels for early warnings.
1.
INTRODUCTION
Bringing data mining to the masses has been a failed quest by major business intelligence (BI) vendors since the late 1990s [6]. From a business perspective, there is an obvious potential to use the available computing resources to allow users in an OLAP environment to use data mining for exploring data relationships that are practically impossible to find manually. We believe that integration of BI disciplines and usability is the key to unlock the big potential of end user data mining that has not yet reached the business users. With this in mind, we have implemented so-called sentinels in the TARGIT BI Suite that is currently available to more than 250,000 users across more than 3,600 organizations world-wide. A sentinel is a novel type of causal rule-based relationship; the concept and formal definitions have been developed in a collaborative research project between TARGIT A/S and Aalborg University [4, 5]. Sentinels are discovered through a data mining process, where changes in one or multiple source measures are followed by changes to a target measure (typically a KPI), within a given time period, referred to as the warning period. An example of a sentinel for a company could be: “IF Number of Customer Problems go up and Website Traffic Volume goes down THEN Revenue goes down within two months AND IF Number of Customer Problems go down and Website Traffic Volume goes up THEN Revenue goes up within two months”. Such a rule will allow a BI system to noPermission to make digital or hard copies of all or part of this work for personal or classroom use is granted without fee provided that copies are not made or distributed for profit or commercial advantage and that copies bear this notice and the full citation on the first page. To copy otherwise, to republish, to post on servers or to redistribute to lists, requires prior specific permission and/or a fee. Articles from this volume were presented at The 36th International Conference on Very Large Data Bases, September 13-17, 2010, Singapore. Proceedings of the VLDB Endowment, Vol. 3, No. 2 Copyright 2010 VLDB Endowment 2150-8097/10/09... $ 10.00.
tify a user to take corrective action, e.g., if “Number of Customer Problems go up and Website Traffic Volume goes down”. Sentinels are based on the Computer Aided Leadership & Management (CALM) theory [3]. The idea in CALM is to take the Observation-Orientation-Decision-Action (OODA) loop (originally pioneered by “Top Gun”1 fighter pilot John Boyd in the 1950s), and integrate BI technologies to drastically increase the speed with which a user “travels” through the OODA loop. Sentinels improve the speed of the OODA loop’s observation and orientation phases by giving the decision maker an early warning (faster observation) that threatens a KPI. At the same time, the sentinel highlights the threat (faster orientation) by listing the measure changes that appears to be “causing” it. In other words, sentinels contribute with both synergy and efficiency for a user cycling an OODA loop. Sentinels are mined on the measures and dimensions of multiple cubes in an OLAP database, as opposed to the “flat file” formats used by most traditional data mining methods. Sentinels find rules that would be impossible to detect using traditional techniques, since sentinels operate on data changes at the schema level as opposed to absolute data values at the data level such as association rules and sequential patterns typically do [1]. As explained in Section 2, the bi-directional sentinels are stronger rules than those mined by sequential pattern mining [5]. In addition, sentinels are more specific than the relationships that can be found using regression techniques such as [7]. In this context, sentinels are a set of “micro-predictions” that are complementary to regression and correlation techniques. Sentinels are useful for discovering strong relationships between a smaller subset within a dataset [4, 5], and thus they are useful for detecting warnings whenever changes (that would otherwise go unnoticed) in a relevant source measure occur. In Section 2, we present the concept of sentinels with a data example. In Sections 3 and 4 we present the sentinel mining algorithm and its context in the TARGIT BI Suite. In Section 5 we demonstrate sentinel mining from a user context in the TARGIT BI Suite. In Section 6 we conclude and present market feedback.
2.
THE SENTINEL CONCEPT
Table 1 is an example, where two subsets have been extracted from a database. We have assigned short names to the measures as follows: PeoInv = the number of people involved in the decision process for customer projects, UniRev = the revenue of training courses, and Rev = revenue for the entire organization. The source measures, PeoInv and UniRev, have been extracted for January 2008 to April 2009. The target measure, Rev, has been extracted for April 2008 to July 2009; a similar period in length starting three months later. We refer to these three months as the Warn1 Colonel John Boyd was fighter instructor at Nellis Air Force Base in Nevada, the predecessor of U.S. Navy Fighter Weapons School.
1629
Month 2008-Jan 2008-Feb 2008-Mar 2008-Apr 2008-May 2008-Jun 2008-Jul 2008-Aug 2008-Sep 2008-Oct 2008-Nov 2008-Dec 2009-Jan 2009-Feb 2009-Mar 2009-Apr (a) Source
PeoInv 1 2 2 3 2 3 2 4 5 6 4 5 6 4 3 2
UniRev 115 115 100 90 363 310 440 297 260 230 294 264 230 270 353 400
Change PeoInv N UniRev H PeoInv N,UniRev H PeoInv H,UniRev N PeoInv N,UniRev H PeoInv H,UniRev N PeoInv N,UniRev H PeoInv N,UniRev H PeoInv N,UniRev H PeoInv H,UniRev N PeoInv N,UniRev H PeoInv N,UniRev H PeoInv H,UniRev N PeoInv H,UniRev N PeoInv H,UniRev N
Month 2008-Apr 2008-May 2008-Jun 2008-Jul 2008-Aug 2008-Sep 2008-Oct 2008-Nov 2008-Dec 2009-Jan 2009-Feb 2009-Mar 2009-Apr 2009-May 2009-Jun 2009-Jul (b) Target
Rev 900 1001 1200 750 1001 1100 1250 970 850 720 1250 930 800 1100 1400 1600
Change Rev N Rev N Rev H Rev N Rev N Rev H Rev H Rev H Rev N Rev H Rev H Rev N Rev N Rev N
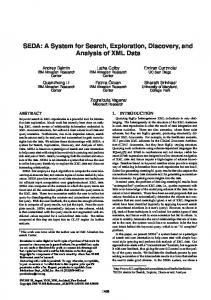
Figure 1: Architecture Table 1: The relationship between two source measures and a target measure ing Period. We have shown the cases where measures change 10% this case, it is done by simply deducting the number of times Rev or more, either up (N) or down (H), from one month to another. changes in the “unexpected” direction from the number of times As seen in the 16 rows in Table 1, the measures PeoInv and Rev changes in the “expected” direction. This means that both UniRev tend to change in a combined pattern such that when PeoInv source measures change 14 times, whereas the target measure after goes up, UniRev goes down, and vice versa. This source measure elimination changes only 11 times (12 − 1). Therefore the simple ) and are slightly pattern is observed 13 times, out of 15 possible. If we combine this sentinels have a poorer Confidence of 79% ( 5+6 14 4×|5|×|6| pattern with the subsequent changes to Rev three months later, we less balanced (Balance = (|5|+|6|)2 = 0.99) compared to the see that Rev changes in the same direction as UniRev in 12, out of sentinel where the source measures were combined. On the other 13 possible times (denoted by #ChangesToSource = 13). Anhand, simpler sentinels with fewer source measures have the advanother observation is that the relationship Rev and the combination tage of being more general than very specific, potentially overfitted, of PeoInv and UniRev goes in both directions, which is a property sentinels with many source measures, and therefore the simplicity we refer to as bi-directionality. Intuitively, one can say that if a of a sentinel is also important. relationship is bi-directional, then there is a greater chance that the relationship is causal, as opposed to a uni-directional relationship 3. THE SENTHIRPG ALGORITHM where a pattern is observed for measure changes in one direction The SentHiRPG algorithm [5] can find so-called generalized senonly. Consider a case where revenue and staff costs increase over tinel rules, like the sentinels found in the previous example. a period of time. This yields the uni-directional relationship that SentHiRPG applies a novel scoring principle, Score (Formula 1), an increase in revenue leads to an increase in staff costs the folwhich incorporates Confidence, Balance, Warning Period, and numlowing month; in this case a decrease in revenue will not necesber of source measures of the sentinels. sarily lead to a decrease in staff costs since these costs tend to be more fixed. Therefore, bi-directional relationships are more desir|A + B| Balance 1 × Confidence × ( + ) Score = able. It is also noteworthy that Rev changes 6 times up (denoted max|A + B| 2 2 by A = 6) and 6 times down (denoted by B = 6) in combina1 + MaxW − Warning Period 1 (1) ) ×( + tion with PeoInv and UniRev since this “balance” again adds to the 2 MaxW × 2 likeliness that the relationship is indeed causal. In summary we 1 + MaxSource − |Source| 1 can say that a sentinel exists in Table 1 where changes in PeoInv ×( + ) 2 MaxSource × 2 and UniRev is able to warn three months ahead about changes to Rev with a Confidence of 92% (12 out of 13 times), defined as Score expresses the quality of a sentinel as a single value and thus |A+B| 4×|A|×|B| allows us to identify the best sentinel(s) in any larger set of senConfidence = #ChangesToSource . Balance = (|A|+|B|) 2 is a tinels. max|A + B| is found in the entire set of sentinels. MaxW measure for the degree to which a sentinel is balanced, and in this and MaxSource are thresholds for the maximum Warning Period case the sentinel is perfectly balanced, meaning that Balance = 1. and the maximum number of source measures we are willing to acWe note that the higher quality from bi-directionality that can be cept. Using Score, the SentHiRPG applies a novel Reduced Pattern achieved by assessing Balance, is impossible to achieve for sequenGrowth (RPG) optimization that can quickly identify which meatial patterns since they can only represent one direction of changes sures that are candidates for the strongest relationships. RPG is in each pattern. facilitated by an intermediate optimized format called The Table of In addition to the combined relationship of the source measures, Combinations (TC). In addition, SentHiRPG applies a hill-climbing we can also observe “simple” sentinels [4] with only one source approach to find the best warning period for the sentinels. and one target measure in Table 1. However, the inverted relationThe Table of Combinations is an intermediate hash table that is ship between PeoInv and Rev, as well as the relationship between generated in one pass over the input data. Once generated, it can UniRev and Rev, each have one occurrence (the first two changes) represent any measure change combination needed to mine all powhere Rev changes in the opposite direction of what we would extential sentinels. pect from all other changes. To assess the prediction ability for Reduced Pattern Growth delivers a good approximation of the such sentinels we must first eliminate its internal contradictions. In top sentinels, and costs only 14% of the comparable cost for a full
1630
pattern growth [5]. The idea is to quickly identify the most influential source measures, where influence is defined as the number of times that a source measure change whenever the target measure also change. Having calculated the influence for all source measures, a Pareto Principle is applied to select the source measures in ranked order that account for 85% (configurable) of the sum of all influences. From this point, we grow sentinels from the measures identified. Starting with 1 source measure, we add the remaining influential source measures one at a time to create longer rules until the maximum number of source measures we desire is reached. In this process we only store a sentinel, and continue to add source measures, if the added source measures give a higher Score. We note that the unique bi-directional nature of sentinels gives rise to the TC and RPG optimizations [5], and thus cannot be offered by sequential pattern mining or other known optimizations for simpler “market basket”-type data such as [2]. Hill Climbing is used to identify the warning period, w, where the sentinel with the highest Score exists as an alternative to calculating all max(Score) for all w. Using a specialized 2-step/1-step hill climbing with two starting points, this approach only consume 53% of the time compared to testing all possible warning periods [5]. The SentHiRPG algorithm can be described as three steps that incorporate these three optimizations: Input: A target measure, a time-dimension, and a set of cubes. Step 1: Build TC during one scan of the input data. Step 2: Hill climb w to max(Score) of the sentinels constructed from TC with the source measures found in RPG. Step 3: Output sentinels for w that meet the quality thresholds.
4.
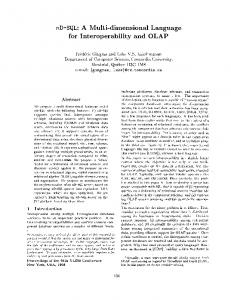
Figure 2: Context in an analysis in TARGIT BI Suite The context also allows the user to move very freely between the different BI disciplines, e.g., from a reporting context (characterized by a formalized layout) directly to an analysis context (characterized by displaying the data over more dimensions) with just one click. Similarly, the user can go directly from an analysis (or report) to a sentinel search simply by clicking the “search for sentinels” button (Figure 2) whenever something is interesting.
5.
SENTINELS IN THE TARGIT BI SUITE
The architecture of the TARGIT BI Suite is shown in Figure 1. The implementation of sentinel mining in the TARGIT BI Suite consists of two parts: 1. The dialogue shown in Figures 3(a) and 3(b) which has been implemented in the TARGIT client, and 2. the sentinel engine in the TARGIT ANTserver (highlighted with red in Figure 1). The client dialogue allows the user to manipulate the input parameters before sending the input (target measure, time-dimension, and a set of cubes) to the sentinel engine. Upon completion of the mining process, the sentinel engine will transfer the sentinels found to the dialogue, that will then present these. From this stage the user can select one or more sentinels to become agents and submitted to the TARGIT ANTserver’s scheduling service. The demonstration in this paper will focus on the client dialogue, and from this perspective we will take the highly efficient SentHiRPG algorithm implemented in the TARGIT ANTserver for granted. A detailed description of the server side implementation and performance can be found in [5]. A few words about clicks and context: As mentioned in Section 1, it is a big challenge to allow users to data mine without any prior technical knowledge. For this purpose we apply ”fewest clicks” as a quantitative approach to usability. The rationale is that minimizing the number of interactions (clicks) the user has during the OODA loop equals reducing the amount of training needed as well as the risk of making mistakes; and most importantly, we improve the speed of the cycle. To reduce the number of clicks, we keep track of the user’s context. The context includes the measures and the dimension levels and criteria over which they are displayed, as well as the importance of a given measure compared to others, e.g., if a measure is analyzed on more dimension levels or more often than others, then it is most likely important. As shown in Figure 2, the context can be used to provide the user with an exact explanation about the data shown.
THE DEMONSTRATION
The setup: The demonstration is run on the data warehouse in TARGIT A/S that has been operational for ten years. The data warehouse has been continuously adapted to the challenges of the organization. Today, the TARGIT data warehouse is based on a Microsoft (MS) SQL Server 2008 which is used for storage and staging of operational data. Upon transformation into cubes for different business areas, these data are made available to users through the TARGIT BI Suite that resides on top of the MS Analysis Services 2008. The data warehouse contains 16 GB of data, organized in 16 cubes with 250 measures and 109 dimensions. It is “mature” in the sense that there has not been any significant change to number of measures and dimensions over the past few years. Searching for sentinels: The following demo flow will be shown live. However, the session will be interactive in order for users to see sentinel mining from other contexts as well. Clicking the “search for sentinels” button (magnified) in Figure 2 will make the dialog in Figure 3(a) appear. We note that the system detects that revenue is most “interesting” over monthly periods since this was the context of Figure 2. From this point we can initiate the sentinel discovery process or use the dialog to change the Prediction Measure, the Source Cubes, Time, or the Criteria before clicking “OK”. The search will typically run for a few minutes on the server before Figure 3(b) appears. The sentinels in Figure 3(b) were found in the TARGIT data warehouse. The best sentinel is based on a combined relationship between the number of people involved in the decision process for customer projects and the revenue of training courses at the “TARGIT University”. The direction in which the measure changes are related is shown by the red and green (dark and light in grey-scale) bi-directional arrows next to each of the measures. The top sentinel shows that if the number of people involved decrease and the university revenue increase, both by 10% or more, then the total revenue for TARGIT A/S is expected to increase by 10% or more within three months. As explained in Section 1, the sentinel is bidirectional and thus works in the opposite direction as well.
1631
(a) Start by selecting the target measure and period for warnings
(b) End by listing the sentinels that can give an early warning
Figure 3: Searching for sentinels in the TARGIT BI Suite By selecting this sentinel and clicking the “schedule” button, the user will now be notified with a given frequency, typically equal to the period over which we searched for sentinels (in this case monthly). If the combined incident of People Involved increase and University Revenue decrease occur, then the user will receive an email or notification directly on the desktop stating that: Revenue is expected to decrease at least 10% in 3 month(s) because: - People Involved has increased at least 10%. - University Revenue has decreased at least 10%. The prediction has a confidence of 92%. Click here to TARGIT the notification context, or click here to review the Agent properties.
This means that the user will know three months ahead that something might happen to the overall revenue, and in addition, the user knows which measures to use as context in order to investigate what is causing the problem. At this point we say that the sentinel has contributed with synergy in the OODA loop since it alerted the attention very early to a problem that was most likely invisible to the user. In this particular case for TARGIT A/S, it was surprising that the number of people involved in the decision process could be used as an indicator, whereas it has been known for some time that selling more training will typically make a customer expand his solution. Intuitively, it does however make sense that the more people are involved in a decision process, the more time it will take, and therefore less revenue will be generated on the short-term; and vice versa. In other words, the users are now able to react faster if future revenue is threatened based on this new knowledge. The TARGIT BI Suite also facilitates an even more radical approach when using sentinels. The “select all” option allows all sentinels to be scheduled as a “sentinel swarm”. In this case the swarm will be monitoring everything that is going on in and around the organization, and report if something occurs, that seems to threaten a critical measure. Once a warning occurs the user will then decide what to do based on his orientation of the situation. Having a “sentinel swarm”, rather than having only the sentinels that makes sense from a human perspective, appears to be an even more synergic approach to facilitating a fast OODA loop.
6.
CONCLUSION
In this demo we presented the sentinel concept, a scoring principle, and its implementation in the TARGIT BI Suite. In addition, we presented the algorithm and data warehouse setup that were prerequisites for our demo. We demonstrated a dialogue in our implementation where users, without any prior technical knowledge, are able to select a critical measure, a number of cubes, and a time dimension, and subsequently mine and schedule sentinels for early warnings. Sentinels was rated the most interesting and promising feature of TARGIT BI Suite version 2K9 in April 2009 by TARGIT partners representing a market footprint of 1,936 customers with more than 124,000 users. In addition, leading industry analyst, Gartner, introduced TARGIT in their Magic Quadrant for BI Platforms in 2010 and listed sentinels as one of the key strengths of TARGIT [5].
7.
ACKNOWLEDGMENTS
This work was supported by TARGIT A/S, Cassiopeia Innovation and the European Regional Development Fund.
8.
REFERENCES
[1] R. Agrawal and R. Srikant. Mining Sequential Patterns. In Proc. of ICDE, pp. 3–14, 1995. [2] S. Brin, R. Motwani, J.D. Ullman, and S. Tsur. Dynamic Itemset Counting and Implication Rules for Market Basket Data. In Proc. of ACM SIGMOD, pp. 255–264, 1997. [3] M. Middelfart. CALM: Computer Aided Leadership & Management. iUniverse, 2005. [4] M. Middelfart and T.B. Pedersen. Discovering Sentinel Rules for Business Intelligence. In Proc. of DEXA, 2009. [5] M. Middelfart and T.B. Pedersen. Implementing Sentinel Technology in the TARGIT BI Suite. In submission. [6] N. Pendse and C. Bange. The missing “Next Big Things”. olapreport.com/Faileddozen.htm, current as of June 16th, 2010. [7] Y. Zhu and D. Shasha. StatStream: Statistical Monitoring of Thousands of Data Streams in Real Time. In Proc. of VLDB, pp. 358–369, 2002.
1632