Jari Kangas, Kari Torkkola and Mikko Kokkonen. Helsinki University of Technology ..... 1] Stephen B. Davis and Paul Mermelstein. Com- parison of parametric ...
Published in the proceedings of ICASSP-92, San Francisco, USA, March 23-26, 1992, Vol. 2, pp. 341-344
USING SOMS AS FEATURE EXTRACTORS FOR SPEECH RECOGNITION Jari Kangas, Kari Torkkola and Mikko Kokkonen
Helsinki University of Technology Laboratory of Information and Computer Science TKK-F Rakentajanaukio 2 C, SF-02150 Espoo, Finland
ABSTRACT In this paper we demonstrate that the Self-Organizing Maps of Kohonen can be used as speech feature extractors that are able to take temporal context into account. We have investigated two alternatives to use SOMs as such feature extractors, one based on tracing the location of highest activity on a SOM, the other on integrating the activity of the whole SOM for a period of time. The experiments indicated that an improvement is achievable by using these methods.
1. INTRODUCTION The Self-Organizing Map (SOM) algorithm of Kohonen [4],[6] is one of the best known arti cial neural network algorithms. SOMs have the ability to construct topology-preserving mappings of the kind that are expected to happen also in the mammalian cortex. SOMs have been used in automatic speech recognition tasks most commonly to derive a vector quantizer, or to do initial clustering to construct a static pattern classi er by the Learning Vector Quantization (LVQ) algorithm [6]. In reference [9] a system is presented, the aim of which is to transcribe speech into phoneme sequences, that is, a phonetic typewriter. The system is based on classifying short-time feature vectors into phoneme classes by using LVQ as a phonemic vector quantizer. The resulting quasiphoneme sequences are then decoded into phoneme sequences by phoneme-based discrete observation Hidden Markov Models (HMMs). The role of SOMs in this application is limited to performing the initial clustering of the data for the LVQ-algorithm, and to attaining a two-dimensional display of the phoneme space, that is easy to visualize [7]. In this work we try to demonstrate that SOMs can have broader usage in speech recognition. In the framework of phoneme-based speech recognition, we investigate two alternatives to use SOMs as feature extractors that can include temporal context of the speech signal.
The outline of this paper is as follows. Section 2 gives a brief overview of the properties of SOMs. Section 3 presents in detail the two feature extraction methods studied in this paper. The experiments are described in Section 4, and nally Section 5 gives the discussion.
2. SELF-ORGANIZING MAPS
The Self-Organizing Maps [4],[6] usually consist of a two dimensional grid of simple cells. Each cell has a weight (reference) vector, mi , that will resemble di�erent kind of input patterns after the learning procedure. The learning algorithm for the SOMs will accomplish two important things: (a) clustering of the input data and (b) spatial ordering of the map in the sense that similar input patterns tend to produce response in cells that are close to each other in the grid. The input pattern vectors are presented to all of the cells in parallel and the best matching (nearest) cell is activated (winner-take-all). The self-organizing phenomenon is achieved by using a spatial neighborhood relation between the cells during learning. Not only the best-matching cell, c, but also its neighborhood, Nc , is adapted, in contrast to basic competitive learning algorithms. The asymptotic values of the weight vectors will de ne the vector quantization of the pattern space. The distribution will approximate the probability density function of the input data. In addition to clustering the weight vectors will be organized so that topologically close cells are sensitive to inputs that are physically similar. The self-organizing process thus creates a two-dimensional topology-preserving mapping of input data onto a grid of cells. A SOM can be used as a classi er by giving interpretations to the cells. To that end, one has to compare systematically each weight vector mi to a set of pattern vectors with known classi cations. Each cell is given a label according to simple majority voting for all of the classes. Cells without a clear majority can be discarded as unstable [6], [7]. In the task of phoneme recognition one is concerned about as accurate as possible classi cation of feature
Published in the proceedings of ICASSP-92, San Francisco, USA, March 23-26, 1992, Vol. 2, pp. 341-344 vectors representing phonemes. It is then bene cial to tune directly the positions of the cells using a set of training feature vectors with known classi cations. This adaptation algorithm, named Learning Vector Quantization (LVQ), and its variants are described in detail in [6]. As a result the decision borders between classes will be adjusted so that the number of misclassi cations is reduced.
3. SOMS AS FEATURE EXTRACTORS
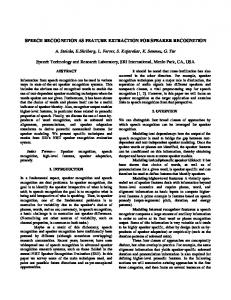
In the following, we present two approaches that try to take advantage of the special properties of the SOMs in feature extraction. In the rst approach the topological ordering of SOM is utilized [11]. Conventional short-time feature vectors computed from the speech signal every 10 ms are mapped onto the best responding cell of a SOM. A sequence of feature vectors is thus mapped onto a sequence of SOM-cells, forming a trajectory, as depicted in Fig. 1. Viewing the trajectory at multiple resolution levels of a period covering 400 ms, feature vectors are formed that take both contextual information and the time evolution of the speech signal into account. k k k k k k k v n m m m m m u u k k k k k k k k m m m v m o u u s s k k k k k k k m m n l l u o s s k k k k k v n n n u o o o o s s s h k k k v d n u l l l o o s s s k h k v d l n m u l a o o s s s s k k k j l n i l l l u o s s s k k r k l l l l u o o a o s s k k h h i y y v a o o l a a s s h s e i y y o e r a r a a a j j i i i e i e e e r r r a a a i i i i i e e e e ä l ä o a a a j i i i y e e e r r ä ä k a a a i i i i e e e e r ä ä ä a a a a i l i i i i e e ä ä ä ä a a a a j i i i e i e e e ä ä ä a a a a
vation distributions (the responses) of a SOM corresponding to each consecutive short-time feature vector are averaged in time by using a leaky integrator. These averages are then used as 'second order' features to be classi ed into phoneme classes (see Fig. 3).
3.1 Forming the trajectory in SOM
A SOM can be used as a vector quantizer for speech as described in [5],[6]. For each consecutive speech frame (represented by a feature vector) the best matching weight vector is computed, and a sequence of SOM cell codes (an index or a coordinate pair on the grid) is obtained. Our aim in this work is to make use of such a sequence of coordinate pairs on a SOM corresponding to consecutive speech frames. If a SOM has been tuned by LVQ to optimize phoneme recognition accuracy, the code sequence will be a sequence of phoneme labels. This is also called the quasiphoneme sequence. To characterize a segment of such a sequence, one could use either simple or weighted majority voting over the code symbols appearing in the sequence. This has been the basic idea in our previous work [10]. We used multiresolution windows framing segments of di�erent length from the quasiphoneme sequence. From these segments new feature vectors were formed with contextual information. In this paper as well as in [11] we have taken advantage of the local topology preserving property of SOMs. Now, consecutive speech frames are similar due to the continuous nature of speech. As these frames are quantized by a SOM, the corresponding code vectors are usually close to each other on the map grid, and thus constitute a path or a trajectory on the SOM. A sequence of speech frames can then be described by the average or median position of corresponding trajectory on the two-dimensional SOM space (see Fig. 1). Ta rg et c od es
ooooiiiiiiiiiiiiiiidddddddddaaaaaaaaaaaaaaaaaaa
Or ig in al c od es
ooooiiiiiiiiiiiiiiiddddvvvddrreoäaaaaaaaaaaaaaa
oiiiiiiiiiiiiiiiddddvvvddrreoäaaaaaaaaaa
Figure 1: An illustration of a trajectory of word
/usea/ on a SOM. The arrowheads represent locations of the best matching cells 10 milliseconds apart. The depicted trajectory has been slightly ltered in time to make the consecutive best matching locations separate from each others.
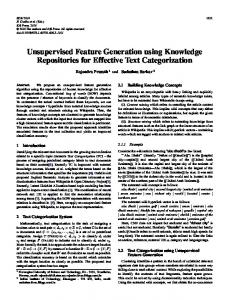
In the second approach not only the best responding cell of a SOM, but the activations of all the other cells are taken into account as described in [2]. The acti-
oiiiiiiiiiiiiiiiddddvvvddrreoäaaaaaaaaaa oiiiiiiiiiiiiiiiddddvvvddrreoäaaaaaaaaaa oiiiiiiiiiiiiiiiddddvvvddrreoäaaaaaaaaaa
Figure 2: The multiresolution window structure. For clarity the window structure is depicted over a quasiphoneme sequence. In this work, however, the windows slide over a coordinate pair sequence.
To construct feature vectors including context in time
Published in the proceedings of ICASSP-92, San Francisco, USA, March 23-26, 1992, Vol. 2, pp. 341-344 we use a multiresolution input built from a 400 millisecond window structure sliding over the map coordinate sequence. The input is constructed by taking a series of gradually focusing windows of the coordinate sequence (see Fig. 2). The longest one of these windows comprise 160 milliseconds, whereas the shortest ones include one coordinate pair. The total number of these focusing windows is 16. A feature vector is now constructed by concatenating the median points of coordinate sequences in each of these windows. The window structure is the same as was used in [11].
3.2 Integrating the responses of SOM
A 'response' of the SOM to an input pattern x(t) is the activity distribution of the units of a SOM, when a function of the distances between the input pattern vector x(t) and the reference vectors mi (t) has been computed. The responses of the SOM are integrated so that a sequence of responses is then taken as the object to be classi ed. The sequence contains information not only of input patterns but also of their order.
x(t)
SOM
y(t)
x (t) Mem w
Figure 3: Responses of a SOM are averaged to collect dynamic as well as static information into one pattern vector.
Responses generated by consecutive feature vectors are combined into one pattern vector by averaging them over time using equation (1). The exponentially weighted average xw (t) of the responses is: xw (t) = y(t) + (1 ? ) xw (t ? 1); (1) where is the weighting factor of the 'memory', x(t) is the input pattern vector of the SOM and y(t) is the corresponding response vector of the SOM. The weighted average xw (t) is then used as a new pattern vector for subsequent classi cation.
4. EXPERIMENTS 4.1 Speech database
The speech data for the experiments was uttered by three male Finnish speakers, each of who read a set of 311 utterances four times in o�ce environment. One set contained 1737 phonemes. The sound was digitized by 16 bits and sampled at 12.8 kHz. The data was windowed using a 256 point Ham-
ming window every 10 ms, and transformed by FFT resulting in 128 point short-time logarithmic power spectra. 20-component MEL-scale cepstrum features were nally computed by cosine transform as described in [1]. Raised-sine liftering was used to weight the cepstrum coe�cients [8]. The SOMs are trained by using these short-time cepstrum vectors. New features containing temporal context are then generated from the SOM responses by using methods described in Sec. 3.
4.2 Classi cation experiments
The baseline against which we present comparisons, is the core of the speech recognition system described in [9]. This system employs SOMs ne tuned with LVQ as vector quantizers. The static feature vectors computed every 10 milliseconds are classi ed into 19 di�erent phonemic classes producing a quasiphoneme sequence, which is decoded into phonemes using phoneme-based HMMs. The experiments were all speaker-dependent. Four tests were run for each of the speakers by leaving one set at a time as a test set and training the recognizer using the three others. Two di�erent kind of experiments were performed. 1. Classifying known speech samples into phoneme classes independently. Both SOMs and nal classi ers were trained and tested using center halves of phonemes. Transitions between phonemes were thus discarded. 2. Using the previous classi ers to classify all of the speech signal to produce quasiphoneme sequences. These were decoded into phoneme sequences by phoneme-based HMMs. The new feature vectors generated as described in Sec. 3 are classi ed into 19 phoneme classes. We experimented with two di�erent classi ers. 1. A multi-layer feed-forward network (MFN) trained by error back-propagation. The structure of the network is the same as in [11], with one hidden layer of 200 units. Depending on the type of new features, the input to the network is composed of either (a) 16 coordinate pairs derived from the 16 focusing input windows. The two components of each pair have been coded separately by using one-of-N coding, or (b) 216 response values from the SOM units. The network is trained to produce the phoneme that would appear in the center of the input. 2. LVQ-classi er using similar input as in (1). The recognition of unvoiced plosives /k,p,t/ was excluded from these experiments, since that can be done
Published in the proceedings of ICASSP-92, San Francisco, USA, March 23-26, 1992, Vol. 2, pp. 341-344 using transient SOMs [3],[9]. In these experiments, the plosives were always clustered to one group. All other phonemes (19 ones) of Finnish were separated.
4.3 Results
The results are listed in the two tables below. First a recognition accuracy for the baseline system (cepstral features and LVQ) is given and then the results of three di�erent new con gurations are listed. features: classi er: accuracy: cepstrum LVQ 88.4 integration LVQ 89.7 integration MFN 89.9 trajectory MFN 92.0 Table 1: The recognition accuracies for phonemes
by the various methods. The middle halves of each phoneme are used in training and in testing.
features: cepstrum integration integration trajectory
classi er: errors: LVQ 9.9 LVQ 8.7 MFN 9.0 MFN 11.6
Table 2: The error rate (the percentage of insertion, deletion and transformation errors) of transcribing speech into phoneme sequences by HMMs.
5. DISCUSSION
The described experiments have shown that the SOMs can capture some essential features of the time development of the speech signal. The di�erencies in recognition of pre-segmented speech samples (table 1) compared to the baseline system, that uses only static vector quantization, are in favour of the new methods in every case. In the last experiment (table 2), in which HMMs were used, the results were not as clearly in favor of the new features. The integration features improved the accuracy compared to the baseline, but the features based on trajectories did not. The explanation for this might be that the context taken into account was too wide (400 ms). The e�ective context width of integration features was only around 80 ms. Future work could include experiments with di�erent kind of window structures and widths for the trajectory features as well as di�erent ways to compute the SOM responses.
REFERENCES
[1] Stephen B. Davis and Paul Mermelstein. Com-
parison of parametric representations for monosyllabic word recognition in continuously spoken sentences. IEEE Transactions on Acoustics, Speech, and Signal Processing, 28(4):357{366, August 1980. [2] Jari Kangas. Phoneme recognition using timedependent versions of self-organizing maps. In Proceedings of the International Conference on Acoustics, Speech and Signal Processing, Toronto,
Canada, May 14-17 1991. [3] Jari Kangas and Teuvo Kohonen. Transient map method in stop consonant discrimination. In Proceedings of the European Conference on Speech Communication and Technology (Eurospeech89),
Paris, France, September 26-28 1989. [4] Teuvo Kohonen. Self-Organized Formation of Topologically Correct Feature Maps. Biological Cybernetics, 43:59{69, 1982. [5] Teuvo Kohonen. The 'Neural' Phonetic Typewriter. IEEE Computer, 21(3):11{22, March 1988. [6] Teuvo Kohonen. The self-organizing map. Proceedings of the IEEE, 78(9):1464{1480, 1990. [7] Teuvo Kohonen, Kai Makisara, and Tapio Saramaki. Phonotopic maps { insightful representation of phonological features for speech recognition. In Proceedings of the 7th International Conference on Pattern Recognition (7th ICPR), pages 182{185, Montreal, Canada, July 1984. [8] Yoh'ichi Tohkura. A weighted cepstral distance measure for speech recognition. IEEE Transactions on Acoustics, Speech, and Signal Processing, 35(10):1414{1422, 1987. [9] Kari Torkkola, Jari Kangas, Pekka Utela, Sami Kaski, Mikko Kokkonen, Mikko Kurimo, and Teuvo Kohonen. Status report of the Finnish phonetic typewriter project. In Proceedings of the International Conference on Arti cial Neural Networks (ICANN-91), pages 771{776, Espoo, Fin-
land, June 24-28 1991. [10] Kari Torkkola and Mikko Kokkonen. A comparison of two methods to transcribe speech into phonemes: A rule-based method vs. backpropagation. In Proceedings of 1990 International Conference on Spoken Language Processing (ICSLP90), volume 1, pages 673{676, Kobe, Japan,
November 18-22 1990. [11] Kari Torkkola and Mikko Kokkonen. Using the topology-preserving properties of SOFMs in speech recognition. In Proceedings of the IEEE In-
ternational Conference on Acoustics, Speech and Signal Processing, Toronto, Canada, May 14-17
1991.