Using System Dynamics for Modeling Benefit Realization in the Adoption of New Business Software Gerrit Heijkoop, Scott Cunningham Delft University of Technology, Faculty of Technology, Policy and Management P.O. Box 5015, 2600 GA Delft, The Netherlands +316 1980 8006, +3115 278 3408
[email protected],
[email protected] Abstract During the late to mid 1990s, many companies chose to implement Enterprise Resource Planning (ERP) systems. Paradoxically, as the potential benefits of these systems are almost self explicatory, only few seem to be able to transform this potential into value. Their mistake? Treating the new software adoption as a mere complex IT project, while instead its huge impact on the entire organisation requires an holistic management approach. Using a System Dynamics approach a simulation tool was developed to get this message around. However, the experimentation was left up to the end-user as a method of leaning; taking simulation models out of the ‘research lab’ into the business world as a new way of communication. Keywords: Business software / Benefit realization / Dynamic business simulation / System Dynamics / User interaction 1. Problem Identification During the late to mid 1990s, over 60% of the Fortune 1000 companies chose to implement Enterprise Resource Planning (ERP) systems, often in the slipstream of the ‘information revolution’ or as a ‘quick’ fix for the upcoming Y2K problem. Paradoxically, as the potential benefits of these systems are almost self explicatory, only few seem to be able to transform this potential into value [Davenport, Cantrell et al., 2002; Hitt, Wu et al., 2002; Ho, Wu et al., 2004]. The combination of the rush into complex technology and the large impact that ERP systems have on organizations, provides a fertile soil for complicated problems. 1.1. Project background This project was conducted for Accenture, a global technology and management consultancy firm, which recognized the need of their clients to improve the benefit realization of large ERP system implementations. They strongly felt that this improvement could be realized by paying appropriate attention to a number of different business aspects surrounding the actual ERP technology. Their hypopthesis was that improving benefits realization requires an alignment of strategy, business processes, information technology, business capabilities, organization, and culture. In order to effectively discuss the possible effects of these business aspects on ERP benefit realization, Accenture wanted a dynamic business model that can act as a basis for structured discussion. The model should demonstrate how these different business
1
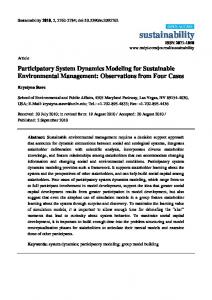
aspects affect the benefits realization of the ERP system and how they relate to each other. It should have an interactive interface, allowing decision makers to run different scenarios and experience the consequences of their choices. The model was built using Powersim, in order to be able to integrate the outcomes of this project with other projects within Accenture. My role as a researcher was to develop and test this model to see if it is an adequate way to reach this objective. 1.2. Problem description Enterprise systems appear to be a dream come true. These commercial software packages promise the seamless integration of all the information flowing through a company - financial and accounting information, human resource information, supply chain information, customer information. For managers who have struggled with incompatible information systems and inconsistent operating practices, the promise of an off-the-shelf solution to the problem of business integration is enticing [Davenport, Cantrell et al., 2002]. In spite of the billions of euros invested in these systems, the return on investment is often not satisfactory. The system does not deliver the expected value, reaches its desired level of value to slow, or a combination of both occurs (see figure 1.1)
Figure 1.1: Effect on business performance of an ERP implementation
[Davenport, Cantrell et al., 2002; Hitt, Wu et al., 2002; Hawking, Stein et al., 2004]. Making a bad investment decision is undesirable, endangering the future of an entire organization is even worse. The impact of ERP systems is so large, that failed implementations can turn into nightmares. FoxMeyer Drug argues that its system helped drive it into bankruptcy. Mobil Europe spent hundreds of millions of dollars on its system only to abandon it when its merger partner objected. Dell Computer found that its system would not fit its new, decentralized management model. Applied Materials gave up on its system when it found itself overwhelmed by the organizational changes involved [Davenport, Cantrell et al., 2002]. Some of the blame for such debacles lies with the enormous technical challenges of rolling out enterprise systems - these systems are profoundly complex pieces of software, and installing them requires large investments of money, time and expertise. But the technical challenges, however great, are not the main reason enterprise systems fail. The biggest problems are business problems [Davenport, Cantrell et al., 2002]. To
2
achieve best business performance, other business aspects, such as organization, business processes, human capabilities and culture also have to be addressed. Although this idea might not be new, and when carefully analyzing the impact of ERP, the only logical conclusion, it is not picked up by decision makers. Senior management often fails to recognize the impact and importance of the ERP project, simply approaching it as another IT project, which is disastrous for the benefit realization process [Sarker and Lee, 2002; Nah, Zuckweiler et al., 2003; Shehab, Sharp et al., 2004]. 1.3. Social and scientific relevance The results of this project can be used to improve business performance. Previous research shows many companies have largely invested in ERP systems [van Everdingen, Hillegersberg et al., 2000; Hawking, Stein et al., 2004]. However, after the turbulent implementation phase is over, companies notice that expected benefits are not realized and business performance has not significantly meliorated. The high costs of these large information systems are a burden on business results, while its opportunities are not fully exploited. Even by providing small improvements to the current situation, large benefits can be achieved. This model enables companies and other stakeholders to learn how the different business aspects interact with and on the benefit realization process of an ERP system implementation. With this insight they can develop a policy to make the necessary improvements to increase their business performance. This project will hold scientific value, in two different ways. First, the approach used during this research differs from the traditional System Dynamics approach (problem identification, hypothesizing, simulation, experimenting and implementation). Instead, since the focus of the objective is so much on communicating the findings, building and validating the simulation model will be the last step. The experimentation and implementation of different possible strategies is left to the end-user; consultants and/or their clients. This is a redefinement of the standard System Dynamics paradigm. Second, this project will provide insight in the dynamic relationship of the different business aspects influencing the benefit realization of ERP systems. It can be seen as an elaboration of Repenning’s Dynamic Model of Innovation Implementation [Repenning, 2002], where this study applies his model to the innovation brought by ERP systems. This is achieved by combining different models on technology diffusion, group learning and dynamic system behavior, and applying them to the use of ERP. Many authors have addressed specific aspects of ERP implementation and use. Another group of authors, of which Shehab and Sharp are the most recent example [Shehab, Sharp et al., 2004], have bundled this knowledge in an integrative review. My contribution is presenting these views in a dynamic model. 2. Previous research and scientific models To create an integrative view and to assure the validity of my constructs, I based them on a large body of previous scientific research and models. Those that were most important for development of the conceptual understanding I will summarize in this chapter. These are Roger’s Innovation Diffusion Theory, Repenning’s Dynamic model of innovation implementation, the Delone and Mclean model of Information Systems success and the Technology Acceptance Model.
3
2.1. Innovation Diffusion theory Theory on the diffusion of innovations is relevant for this research because an ERP system can also be seen as an innovation in an organization. The implementation of ERP will demand significant change of behavior. This puts users in a position to make an adoption decision. Understanding the dynamic behavior of the spread of adoption and ways to influence the adoption will be valuable input for the model. Roger’s Innovation Diffusion Theory has been a robust foundation through the years, while Repenning offers a practical application of dynamic modeling on innovation diffusion processes. The Innovation diffusion theory is developed by Everett Rogers in 1995 [Rogers, 2003] and has been widely used in all sorts of research. The main argument is that change can be promoted rather easily in a social system through a domino effect. Understanding this process and being able to identify the ‘tipping point’ improves the capacity to take efficacious action to speed up the diffusion. Rogers defines diffusion as the process by which an innovation is communicated though certain channels over time among members of a social system. This process follows through 5-steps: knowledge, where a user becomes aware of an innovation; persuasion, where the user forms a favorable or unfavorable attitude toward the innovation; decision, to adopt or reject the innovation; implementation, putting the innovation to use; and confirmation, evaluating the results of the decision made. Another feature of diffusion theory is that the innovation-decision heavily depends on the innovation-decisions of the other members in the social system [Rogers, 2003]. This spread of adoption follows an S-shaped curve, due to differences among members of the system. People will adopt an innovation if they believe it will increase their utility; thus it must have a relative advantage to the idea it supersedes. This utility has not purely economic features, but also involves the compatibility with existing habits and values and difficulty of use. Diffusion is made possible because the valuation of these aspects differ between individuals. Basically five groups of users can be identified: innovators, early adopters, early majority, late majority and laggards [Rogers, 2003]. The innovators get excited by the possible benefits and are eager to try something new. The early adopters base their opinion on the experience of the innovators when making their innovation-decision. This group earns respect for their well-informed decision-making and hence this is the group where most opinion leaders of the social system reside. Much of the social system merely wants to stay in step with the rest, and follows the trusted opinion leaders. This is the point where the rate of adoption rapidly increases, as those not adopting lose status or economic viability, which results in contextual pressure. So the tipping point is marked by the opinion leader adoption. Thus a powerful way to affect the diffusion of an innovation is to influence the opinion leader attitude. However, the effectiveness of this approach largely depends on the nature of the social system. Rogers introduces two characterizations of social systems: heterophilous or homophilous [Rogers, 2003]. On one hand, heterophilous social systems tend to encourage change from system norms. These systems have opinion leadership that is
4
more innovative because these systems are desirous of innovation, e.g. always willing to learn and adopt to change. On the other hand, homophilous systems tend towards system norms. People and ideas that differ from the norm are seen as strange and undesirable. Trying to influence opinion leaders in a heterophilous system takes far less effort than influencing opinion leaders in a homophilous system. Strong arguments, convincing them that the innovation is compatible with existing system norms, might be able to push the homophilous system to the tipping point. Although Roger’s innovation diffusion theory is a strong start-off point for modeling the innovation diffusion process, it is based on the assumption that organizational members have a free and independent choice in adopting an innovation. With ERP systems, often there is little free choice and adoption is inevitable. However, it is relevant how this process of adoption naturally works, because it is a strong determent of organizational behavior. 2.2. Repenning’s dynamic model of innovation implementation In section 1.2 several examples where mentioned that illustrated a strange paradox of ERP implementation. Despite some great success stories, many seem to fail at realizing the potential benefits of the technology. The remarkable thing is that in general the failure cannot be attributed to a lack of implementation effort. Similarly, a variety of theories and frameworks speak to the difficulties organizations experience in their attempts to capitalize on the opportunities presented by technological advances [Repenning, 2002]. These include discussions of induced change (van de Ven and Poole, 1995), goal commitment (Locke et al, 1998) and motivation (Steers and Porter, 1991).This section discusses a theory that explains big changes in system behavior due to apparently small changes in circumstances. Faced by the mentioned paradox, Repenning proposes dynamic simulation modeling as a methodology suitable for the dynamic nature of the process of innovation implementation [Repenning, 2002]. By identifying generic feedback-loops from existing literature and simulating them, the range of organizational outcomes can be characterized. The result is an internally consistent theory that, while firmly grounded in previous work, reaches a new level of specificity about the failure and success of innovation implementation. It offers an exact specification of the core dynamics of the implementation process. The focus of the analysis is the process through which organizational members form believes concerning the innovation’s efficacy. The central construct in the model is commitment to using the innovation [Repenning, 2002]. Commitment is defined as one’s attachment to a goal or determination to reach it. Through the intermediate variable effort, commitment is positively influencing results. Results are defined as any increase in organizational effectiveness attributed to the use of the innovation. Finally the link between results and commitment, firmly embedded in both cognitive and human rationality theory, closes the first feedback-loop: ‘Reinforcement’. This is a positive feedback-loop that can either increase or drain commitment. A second dynamic process Repenning introduces in his model is ‘Diffusion’ [Repenning, 2002]. In line with Rogers’ theory described in a previous section of this
5
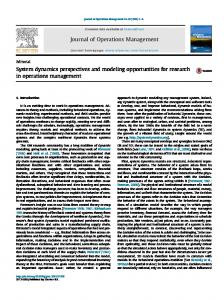
chapter, Repenning quotes Wood and Bandura (1989) who state that virtually all learning phenomena resulting from direct experience can also occur from observing other people’s behavior and consequences of it. The influence of results on the commitment of nonusers is captured by introducing the variable observation of effortresult linkage by others. This second feedback-loop is also a self-reinforcing loop like ‘Reinforcement’. As the number of users increases, there are more opportunities for learning from others. Besides these two, there are also external sources influencing commitment. Repenning represents this as the ‘Normative pressure’ feedback-loop [Repenning, 2002]. He introduces a variable for the commitment gap, which is the difference between the current level of commitment and a target level for commitment set by management. Management’s actions to close the gap will adapt when commitment increases, which results in a balancing feedback-loop. The model is presented in figure 2.1.
Figure 2.1 Repenning’s dynamic model of innovation implementation
Results
Increase in organizational effectiveness
Commitment to innovation
Determination to reach a goal
Effort allocated to the innovation
Costs and time dedicated to innovation
Observations of effort-result linkage
Interactions between users and nonusers
Commitment gap
Difference between goal and actual level of commitment
Management’s goal for commitment
Level of commitment needed to realize results of innovation
Normative pressure from management
Management’s actions undertaken to stimulate commitment
When specified and simulated, the results demonstrate three important features of system behavior. First, the two basic patterns emerging reproduce actual implementation experience. Depending on the duration of management’s pressure, the effort either produces early results but quickly dies following the elimination of management’s pressure, or it becomes self-sustaining and generates significant results. Second, the system produces no intermediate results; the effort either succeeds or fails. Third, the relation between the duration of normative pressure and commitment is highly non-linear. The first key to understanding the dynamics of implementation is to recognize that the ‘Reinforcement’ and ‘Diffusion’ loops can work in one of two directions, either driving the effort forwards or driving it towards failure. This direction is determined by the variable word of mouth (introduced in the specification), which is determined by the actual results compared to a certain expectation of results. Initially word of mouth is negative as, in absence of results, participants are skeptical about an innovation’s efficacy. Despite this drain, commitment grows due to the normative pressure from management. If normative pressure is applied long enough, increased commitment will lead to increased results, eventually turning the sign of the word of mouth. Once this happens, the ‘Reinforcement’ and ‘Diffusion’ loops switch directions and start spiraling
6
up the system. Normative pressure is then no longer necessary. This point Repenning calls the ‘motivation threshold’, as the implementation effort changes from a reversionary to a regenerative one. Existence of the motivation threshold offers a number of important insights in the dynamics of innovation implementation and the effectiveness of trying to influence this process. First, the impact of normative pressure depends on the state of commitment relative to the motivation threshold. In the reversionary state the system seems to resist the implementation effort, while above the threshold normative pressure will have little effect. Below but near the motivation threshold small changes in normative pressure can dramatically influence the outcome of the effort. Whether an implementation effort becomes self-sustaining depends on the level of results and their location relative to the motivation threshold, which is determined by other variables such as the initial level of skepticism, the strength of the ‘Reinforcement’ and ‘Diffusion’ processes and people’s expectations considering success [Repenning, 2002]. An important lesson is learned, which answers why the motivation threshold is rarely achieved. Management often underestimates the delay required for an innovation to be successfully implemented and do not fully account the downward pressure initially created by the ‘Reinforcement’ and ‘Diffusion’ processes. This leads too soon to the conclusion that the innovation in question does not work and they abandon their efforts to implement it. In this way the failure to sustain normative pressure creates a selfsealing logic that confirms the logic of poor decisions [Repenning, 2002]. Although this theory is providing qualitative system behavior consistent with real-life observations, it also has some drawbacks. The specification of structure into behavior comes at the cost of imposing precision, which can threaten the external validity of the analysis. Further a number of variables, which have already proven their contribution to the innovation implementation, are left out of this model to reduce complexity. Finally, this theory has not yet been challenged much or improved. Especially the formulations of equations deserve closer attention. Repenning also recognizes these drawbacks and recommends further improvements in the direction of applying the model to a more specific innovation and context, the extension with more feedback-loops and the improvement of the formulations [Repenning, 2002]. The model also has some great strengths and shared points of interested with this project. Rifkin has evaluated this model to use it for the evaluation of software adoption and states the following advantages: the model is firmly embedded in existing theories, it has face validity, it can both explain success and failure and it represents the characteristics associated with implementation success, such as leadership, change management, and rewards [Rifkin, 2003]. These arguments, together with Repenning’s recommendations for future research, makes this model very suitable to function as a basis for the modeling of ERP benefit realization. To enhance the application in this project, the next section presents two models developed specifically for the adoption of Information Systems.
7
2.3. The use of Information Systems Repenning’s model provides a lot of insight in the adoption of an innovation in general. However, his model lacks the relation between specific qualities of the innovation and adoption. The adoption of Information Systems as an innovation is often expressed by the term ‘use’ or ‘usage’ of the system. In order to experience the benefits of any information technology, it has to be used and internalized by the organizational members [Delone and McLean, 2003; Legris, Ingham et al., 2003; Amoako-Gyampah and Salam, 2004]. There is a growing body of academic research examining the determinants of information technology acceptance and utilization among users. Two important models are the ‘Delone and Mcleane model Information Systems (IS) success’ and Davis’ ‘Technology Acceptance Model’. These two models are described in this and the next subsections. 2.3.1. The Delone and Mcleane model of Information Systems (IS) success The main reason to include the ‘DeLone and McLeane model of IS Success’ in this chapter is, that it addresses the relation between the properties of the Information System and its usage. Like Repenning’s model it is based on the proposition that more effort leads to more results. Central thought is that in order to realize the benefits of IS, the system has to be used. Just like Azjen (see section 2.3.2), it recognizes the preference of voluntary use over mandatory use, and defines the variable intention to use. This intention is positively influenced by the rise of three different system qualities, the user satisfaction and the realized net benefits. Information quality is a variable that describes if the information conveys the intended meaning, while system quality considers the technical workings of the IS system. The service quality consists out of elements such as up-to-date hard- and software, responsiveness and the ability for users to use the system’s full capabilities. These three qualities also impact the user satisfaction of the system in a positive way. The model is presented in figure 2.2.
Figure 2.2 Delone and McLeane model of IS success
Use
Actual behavior of usage
Intention to use
Indicator for the voluntariness of the system usage; an attitude
User satisfaction
Indicator for the appreciation of the user for the use of the system
Net benefits
Value created by the use of IS systems
Information quality
Describes if the information conveys the intended meaning
System quality
Technical performance of the ERP system
Service quality
Describes the quality of the service the system delivers to the user
The model presents three feedback loops; two involving the net benefits and one between use, user satisfaction and intention to use. This last one might seem a little awkward, especially the positive link between use and user satisfaction. The explanation is found in experience; by using the system, a user gains experience, which makes it easier to use the system, which increases the user satisfaction. The other two feedback loops demonstrate that, once a user experiences the net benefits of the system, he or she will be more willing to use the system again and will also be more satisfied with the use of the system. The loop also works the other way around: the lack of positive benefits will lead to decreased use and possible discontinuance of the system [Delone and McLean, 2003].
8
Since the original paper in 1992, the model has been tested and validated by many authors. Though it proves to be a robust model, issues are repeatedly raised about the variable use. The definition is too simplistic for this complex variable. Simply saying that more use will lead to more benefits, without considering the nature of this use, is insufficient [Delone and McLean, 2003]. The nature, extent, quality and appropriateness of use should also be addressed to determine if the full functionalities of are used. This was important to keep in mind when building the dynamic model for this project. So although the model introduces the relation between system qualities and usage, its drawbacks are that there is an awkward feedback-loop involving experience and the variable use is too broadly defined. The Technology Acceptance Model can help to better understand the intention to use variable and is described in the next subsection. 2.3.2. Technology Acceptance Model As mentioned in the opening paragraph of the previous section, a large body of research has focused on modeling the utilization of Information Systems. Among these, Davis’s Technology Acceptance Model (TAM) seems to be the most widely used by IS researchers [Amoako-Gyampah and Salam, 2004]. TAM is based on Azjen’s Theory of Reasoned Action (TRA), which states that behavior is a result of an intention [Azjen, 1991]. This intention is the result of an attitude towards a certain behavior. TAM applies this theory specifically on the voluntary use of Information Systems. An original part of TAM is presented in the bottom-right part of figure 2.3. The model is somewhat simplified to the three key variables: Perceived usefulness, perceived ease of use and intention to use. TAM states that perceived usefulness and perceived ease of use are of prime relevance in explaining the behavioral intention to use Information Systems [Amoako-Gyampah and Salam, 2004]. Although the use of ERP applications is often mandatory, research has observed that voluntary use proofs more effective [Agarwal and Prasad, 1997]. Therefore, if one can influence the intention to voluntary use the system, this is preferable. Davis defines perceived usefulness as “the degree to which a person believes that using a particular system would enhance their job performance”. He defines perceived ease of use as “the degree to which a person believes that using a particular system would be free of effort”. The understanding of these two beliefs enables the design of effective interventions to increase the use of a new IT system [Venkatesh and Davis, 2000]. The degree to which a person believes that Perceived usefulness
Figure 2.3 Extended TAM
using a particular system would enhance their job performance
Perceived ease of use
The degree to which a person believes that using a particular system would be free of effort
Image of the system
Common public belief of the quality, usefulness and benefits of ERP
Job relevance
Indicates how much support a user receives form the IS system in his or her job
Output quality
Quality if the results produced by the system
Result demonstrability
Indicator for the visibility of the benefits achieved by use of the system
Experience
Experience is the familiarity with and knowledge of a system, obtained over time through using
Communication on ERP project
Expresses the frequency, content and accuracy of the communication
Training on ERP system
Indicator for the amount of specific ERP training received by the users of the system
Belief in benefits of ERP
The amount of users that personally beliefs in the benefits of the ERP implementation
9
Since the original model proposed in 1985, several researchers have suggested modifications and extensions. The top part of figure 2.4 shows five factors proposed by Venkatesh and Morris to extend the original TAM [Venkatesh and Morris, 2000]. These external factors have an effect on the perceived usefulness of the IS system. Development over time is introduced by the factor experience and both image of the system and result demonstrability refer to stimuli from the environment. The output quality is partly a property of the IS system and the job relevance depends on the organizational and business process design. In 2003 Amoako-Gyampah and Salam have extended TAM specifically for ERP implementations [Amoako-Gyampah and Salam, 2004]. Their added variables are in the bottom-left corner of figure 2.4. Their argument is that since an ERP implementation has so much impact on an organization, change management should be an integrated part of the approach. They thereby focus on communication, training and the common belief of the benefits of the ERP system. This belief can be created by training, the understanding of the system’s workings and communicating changes, progress and results. Then, when users share their belief in the benefits of the new ERP system, their perceived ease of use and perceived usefulness will increase. TAM is a robust and widely used model to understand the use of information systems. However, even with the additions of Amoako-Gyampah, it seemed to be a too generic model for the purposes of this project. Hu et al state that when TAM is applied in a more specified context, it can and should be modified [Hu, Chau et al., 1999]. This is valid because the fundamentals of TAM have been confirmed and validated by many researchers. Furthermore TAM is mostly tested in situations with relatively simple information systems [Legris, Ingham et al., 2003], while the use of ERP is more complex. So TAM provided a valuable start-of point for this project, though it had to be specified to the benefit realization of ERP. 3. Research Approach As was mentioned in section 1.3, the approach used during this research differs from the traditional System Dynamics approach (problem identification, hypothesizing, simulation, experimenting and implementation). Instead, since the focus of the objective is so much on communicating the findings, building and validating the simulation model will be the last step. The experimentation and implementation of different possible strategies is left to the end-user; consultants and/or their clients. The objective of this research was: Providing insight into the key business requirements necessary to improve the ERP benefit realization process, by modeling the dynamic relationships of these requirements. To reach this objective, two different research issues will be addressed: A. Benefit realization: What are the key requirements in order to realize the benefits? B. Providing insights: How can a dynamic business model play a role? The complexity and the dynamics of the problem situation, in combination with the client’s desire that the model had to be built in Powersim, made System Dynamics an
10
appropriate methodology. System Dynamics is a scientific method, typically used for modeling complex problems on a strategic level. It is designed to deal with numerous variables, interconnected into multiple feedback-loops. Because the method focuses on the essential determinants of system behavior, transparency and structural validity are more valued than the precise and quantitative representation of empirical observations [Enserink, Koppenjan et al., 2001]. The users of the final model will be high level decision makers and consultants. The effects of their policies, like change management initiatives, will only appear after a certain time. This justifies addressing the problem at a strategic level. Since the objective is to have a generic model, the outcomes should be proportionally and directionally right, not quantitatively predictive. This matches with System Dynamics focus on system behavior. Finally, since the objective is to communicate the understanding of the system, the model should be ‘white box’. This is also a typical property of System Dynamics models, which again confirms this choice of methodology was a smart one. However, the System Dynamics methodology also has some drawbacks. System dynamics has critics on both ends of the hard-soft spectrum because of its position right in the middle of hard- and soft system thinking [van Daalen, 2001]. According to soft system thinkers it focuses too much on mathematical modeling. On the other hand, hard system thinkers say that some qualitative aspects are impossible to model quantitatively. However, according to Lane [Lane, 1994] this form of ‘hybrid modeling’ is very suitable for problems in between the strategic and tactical level. The benefit realization of ERP systems is a problem typically between the strategic and tactical level. Although communication is the primary goal of the model and System Dynamics is a ‘white box’ modeling approach, there exists a paradox [van Daalen, 2001]. Since a model is a simplified representation of reality, choices about content have to be made. These introduce uncertainty about the validity of the model. The easiest way to deal with this uncertainty is by introducing a variable for it. However as a result, the model will have a tendency to grow more and more complex, which endangers the transparency and communicative quality. So the biggest design challenge was to make well motivated choices in order to reduce the number of variables, while in the mean time maintaining the validity and relevance of the model. This challenge was met by basing the model on widely accepted and verified theoretical models (see chapter 2) and validating the model through expert interviews. The project ran through six different phases. These phases each represent a specific step in the System Dynamics process, however in this case the processed stopped after building and testing the simulation model. The experimentation and decisionmaking was left to the clients instead of to the researchers and/or model builders. The process is described in table 1.1. Phase
Process
Methodology
Research proposal
Problem and objective definition
Social and scientific relevance
Exploration
Gaining input for dynamic model
Literature review and Expert interviews
Conceptualization
Hypothesizing the causes of the problem
Causal Relationship diagramming
11
Model building
Specification
Flow diagramming and Differential equations
Testing
Verification, Validation and Usability
Qualitative feature analyses and Expert interviews
Communication
Conclusions and answers
Interactive simulation tool and report
Table 1.1 Phases of the research approach
Exploration An important step to start with was a broad exploration of relevant theories, previous research and people actually experiencing the problem. Before diving into these sources of information, some important assumptions were made. These assumptions were mainly based on talks with the client of the project and Repenning’s article on a dynamic model for innovation implementation [Repenning, 2002]. The assumptions were: • An effective implemented ERP system will improve organizational performance. However, not necessarily all organizational members know this. • In order for the ERP system to be effective, members of the organization have to change their behavior in significant ways. This change mainly arises from new business processes and operation of a new IT system. • The model will represent the situation where the actual adoption or implementation phase is already over. So the focus will be on the period after ‘Go Live’. • During the course of the simulation, the external environment will not change in such a way that the ERP system is no longer appropriate. To get a valid representation of different actors’ views on the benefit realization process, both a literature review and several interviews were conducted. The literature served as a basis of empirical observations of ERP benefit realization processes. An article by Shehab et al, which offers a comprehensive review of the research literature concerning ERP in the period from 1990 till 2003, has been a valuable start off point. They reviewed 76 scientific resources written by researchers and practitioners from a variety of functional disciplines [Shehab, Sharp et al., 2004]. Many other researchers have also conducted interviews with actors and experts involved. Two important study’s were a report by the Boston Consulting Group, who have interviewed more than 100 executives across North America who had taken responsibility for ERP initiatives between 1996 and 1999 [Archibald, Saeed et al., 2000] and an article by Nah et al, who did a broad literature review and interviewed 54 CIO’s (Chief Information Officer) of Fortune 1000 companies. Conceptualization To be able to process and work with all this information, it was then transformed into clear propositions that express a conceptual vision of (a part of) the benefit realization process. A system diagram would then further be explored using Causal Loop diagramming. This resulted in a clear understanding of variables and causal relationships. In the causal diagrams several feedback-loops appeared. Their impact, speed and delay was assessed because, especially in this phase, it was important to address the challenge of complexity reduction.
12
Model building The model building phase started of with defining the design requirements. These could be derived from an audience analysis. During this analysis it was important to keep intensive contact with the client of the project. The variables from the conceptualization were categorized in levels, flows, auxiliary variables or constants. The challenge was to express some of the more qualitative or soft variables in quantitative, hard formulations. Testing the model The results of any modeling study will only hold value if thoroughly verified and Actors / Experts
1 6
3
Problem entity 5
Computerized model
2
Interviews & actor analysis Literature review
3
Expert validation
1
Figure 3.1 Sargent's model development process
2 Conceptual model
4
4
Verification
5
Face validation (non-) Expert usability tests
6
Figure 3.2 Threats to validity
validated. Before discussing the results of the validation and verification, it is important to understand its different aspects and its place in the model development process. The relationship can be viewed in either a very detailed or a rather simple type of model development process. Sargent argues, based on previous research, that the simple way more clearly illuminates model validation and verification [Sargent, 1999]. The simplified version of the modeling process is presented in figure 3.1. The problem entity represents the system or phenomena to be modeled, in this case the benefit realization process. The conceptual model is the logical and verbal representation of the problem entity, developed for a particular study. The computerized model is the conceptual model implemented in the computer, in this case the simulation model. Based on this model, Sargent then defines three types of validity. Conceptual model validity is defined as determining that the theories and assumptions underlying the conceptual model are correct and the model representation of the problem entity is ‘reasonable’ for the intended purpose of the model. Computerized model verification is defined as ensuring that the computer programming and implementation of the conceptual model are correct. Operational validity is defined as determining that the model’s output behavior has sufficient accuracy for the model’s intended purpose over the domain of the model’s intended applicability [Sargent, 1999].
13
A problem with Sargent’s model is that it assumes a problem entity can clearly and objectively be defined and measured. Based on an actor analysis preformed during the project one can say there are many views, definitions and opinions about the benefit realization process. It is unlikely these can be unified in one objective definition of the benefit realization process. That is the first of three reasons the ‘problem entity’ cannot be quantitative defined in this particular study. The second reason is closely related, being the inaccessibility to data of the problem entity because business performance measures are often both confidential as well as very hard to measure. The benefits of an ERP system are both tangible and intangible; measuring the performance improvement of an ERP system can be an entire field of study on its own. The third reason for not quantitatively defining the problem entity is a modeler’s choice. This study focuses on developing a qualitative model of the benefit realization process. The computerized, and thus quantitative, representation of the model serves pure for visualization purposes. Therefore a new entity is suggested in Sargent’s model of the model development process: the actors or experts. Those are the ones that have experience, knowledge and vision on the problem entity. Those are also (partly) the ones that will use the model to better understand the benefit realization process, or teach it to others. Figure 3.2 demonstrates the new proposed model. In this model there are six links in which threats to validity could arise. Compared to Sargent’s model, the conceptual model validation is represented by three (1, 2, 3) instead of one links, which is just another sign of its importance in this study. The computerized verification link (4) is comparable between the two models. The operational validity (5) is not based on a comparison of data but on the analysis of system behavior. A usability link (6) is added, which connects the simulation model to the users or experts. In the table under figure 6.2 the techniques used to address the validity of the six links are mentioned. The conceptual model validity means determining that (1) the theories and assumptions underlying the model are correct, and that (2) the model representation of the benefit realization process and the model structure, logic and causal relationships are ‘reasonable’ for the intended purpose of the model [Sargent, 1999]. Since the conceptual validity is the most important in this qualitative study, it deserves a lot of attention. It represents the three links between the problem entity and actors’ vision on it, the problem entity and the conceptual model of it and the link between the experts or actors and their vision on the conceptual model. Therefore an extra ‘expert validation’ step was introduced, which is uncommon in the ‘standard’ System Dynamics process. 4. Conceptualization The repeatedly mentioned complexity and impact of an ERP implementation can best be understood by vividly imaging its consequences. Implementing one central database means that all applications have to use the same types and formats of data. This requires a data cleaning operation [Borsboom, 2005]. If all applications have to standardize their data, all users and business processes have to make that same change. This inevitably results in business process re-engineering which, if done anyway, can then best be done thoroughly to comply with best practices. When business processes are changed, the roles in the processes also have to be redefined. The possibility of enterprise-wide sharing of information requires a clear and effective authorization scheme. Redefinition of process roles and authorizations is likely to raise issues about the current
14
organizational structure. Through this process, the organizational members are confronted with a new IT system, new business processes and new roles and functions. This means they need training and time to learn to perform on their pre-ERP level again. When not addressed properly, all these changes will encounter a large resistance, compromise ongoing operations and thereby endanger the continuity of the entire enterprise. Of course an ERP implementation does not automatically endanger the continuity of an enterprise, but the description above gives a good feeling for the pitfalls and different aspects involved. The five different business aspects (technology, business processes, organization, capabilities and culture) mentioned in the project assignment are clearly recognizable. In order to develop a concetpual model, seven dynamic hypotheses were developed based on the results of the ‘exploration phase’. They were formulated in the following propositions: 1. Benefit realization is limited by the internal demand for the system’s potential 2. Benefit realization demands organizational determination to fully exploit the new system 3. Ability to use can be split up in knowledge, understanding and skill 4. Enterprise wide systems are most successful in a ‘Machine bureaucracy’ organisation 5. Organizational misfit impacts on the new system’s appreciation by users 6. Benefit realization demands fit between actual and embedded processes, which is continuously under pressure in a changing environment 7. Downtime, data quality, speed and access are the system’s key technological properties 4.1. Integrated view Based on these hypotheses, the previous built models and theories and the results of the exploration phase a integrative concteptual model was depicted in a causal relation diagram. Looking at the main constructs and feedback loops of the conceptual model, it is so generic it could apply to almost any information technology, or maybe even innovation, implementation. This is not strange, considering the theoretical basis of the model. However, there are certain parts of the model that add the specific ‘ERP flavor’ to the conceptual model. Those have been colored red in figure 4.1. Searching for archetypes in the causal relation diagram one can find directly one of Senge’s 11 archetypes. The ‘fixes that fail’ archetype is visible in the ‘pressure to use’ versus the ‘diffusion’ loop part of the diagram. Although pressure to use is effective on short term, it decreases the appreciation of the ERP project. In the long term this means the ERP system will never become a self sustaining success. Once the pressure is turned off, users will not use the system by themselves. This can be avoided by keeping the focus on the long term and be very careful in pressuring people to use the ERP system. Furthermore the ‘limits to growth’ can be recognized in the positive and negative feedback loop influencing the benefit realization rate. This is however a rate, and not a
15
level, so it is not exactly the same. The behavior expected in the ‘limits to growth’ archetype can also be expected in this system though. Initial growth of the benefit realization rate, which slows down and can eventually decay once a certain limit is (+) Achievable performance improvement
(+)
Quality of technology
(+)
-
(+)
Benefit realization
(+)
(+)
Pressure to use
(-)
(-)
(+)
(-)
(+) Expected benefit realization
Fit betw een business processes and ERP processes
Quality of use
(+)
(+)
Ease of use (+)
(-)
(+)
ERP appreciation
(+)
+ Commitment to use
Ability to use
(+)
+ (+)
Training (+)
+
(+)
(+)
(+)
(+) Diffusion Organizational fit
Experience Employee turnover
(-)
(-) Erosion
reached. The limit is in this case the maximum achievable performance improvement. Figure 4.1 The interaction of the different business aspects
5. Model building This chapter describes the transformation of the qualitative conceptual model into a quantitative computerized model and simulation tool. The causal relationships were expressed in formal equations based on their expected qualitative behavior. The formal values of the variables were estimated using firsthand knowledge of the ERP benefit realization process. Although not based on actual empirical evidence of the real-life system, it was possible to estimate a value within reasonable upper- and lower limits. This was appropriate for the purpose of the final simulation tool, as long as the assumptions were agreed on by users. The formalization started with the definition of a set of design requirements for the simulation tool, which will be described in section 5.1. After the computerized model was constructed, a user interface was designed to allow future users to interact and learn with the simulation tool. The interface design is described in section 5.2. 5.1. Design requirements The design requirements are based on an audience analysis for future use of the model. Therefore three different use cases have been developed, which each pose different requirements for the building of the computerized model and the interface.
16
5.1.1. Consultant – Client meeting Purpose of model: In the relation between a consultant and its clients, the model can have two purposes: first, functioning as a structured base for discussion, visualizing the ideas the consultant wants to convey. The main idea is the impact of certain levers and different business aspects on the benefit realization of an ERP system. Second, allowing the clients to use the model for themselves, so they can experience and learn the most distinctive ideas behind it. Implications for design: For both purposes it is extremely important that the model can almost instantly be used. When aiding a discussion as a visualization tool, it is undesirable that the interface and output of the model first need a lengthy explanation. The same can be said for the use as a learning tool, although in that case some extra information on the assumptions and workings of the model is appropriate to improve its credibility. This had the following implications for the design of the model: • To allow ‘instant use’, the interface should be visually attractive and easy to understand and use. • The ease of use is also improved if the input and output variables appear intuitively appropriate to the users (face validity). • In order to facilitate learning, a change in behavior should be clearly visible and comparable with previous runs. • Also there should be increasing levels of complexity for those who want to learn more (like a website). • The client has no interest in the actual flow model, so this has no dominant place in the interface. It can be used though to demonstrate the complexity and broadness of the underlying computerized model in order to gain confidence in the simulation. 5.1.2. Consultants expanding model Purpose of model: This model can become a part of a larger dynamic business model built by consultancy firms. In that case the purpose of this model is to convey the findings of this specific research to the analysts building the larger model. It is also possible that those consultants are not entirely satisfied with the end result of the model and wants to make some modifications before they can use it. Either way, people will be working with the model as ‘model builders’ in the future. Implications for design: In order to convey the modeling choices and assumptions, not only the interface, but also the model itself must be easy to understand and use. This has the following implications on the design of the model: • To allow later modification, all variables, parameters, relations and equations should be well documented, both in a report as in the model. • Also for modification, as for validity, all sources and assumptions should be very well documented in a report. • To make the model easy to understand, the model has to be split up in manageable and intuitive sub-models; the relations between the sub-models must be clear.
17
•
In order to integrate with other dynamic business models of a specific consultant Accenture (the client and sponsor of this project), Powersim will be used as modeling software.
5.1.3. Future scientific research Purpose of the model: The model can also be used as a base or part of future scientific research; either for using System Dynamics models as a learning tool or for better understanding the benefit realization of ERP implementations. While the previous use case focused on future use of the model, this case considers future use of the knowledge obtained from this modeling project. Although this difference in purpose, the implications for the design are similar: well documented and understandable design choices and model building. 5.2. Interface design Without an effective simulation interface, the mathematical model formulated during the simulation development are useless. The interface of the simulation has to be able to attract the user to the simulation and enable him to learn something. The audience analysis described in section 5.1 expresses three design criteria specifically for the interface: it must be visually attractive and easy to understand, it must allow simulation runs to be compared and it must be possible for a user to experience increasing levels of complexity. A fourth design criterion is added, also specifically for the interface: because it is an Accenture simulation, its brand has to be recognizable in the layout. These design requirements almost intuitively lead to a website-like design. A website can be made visually attractive and the Accenture branding style is easy to apply. It is almost unthinkable that future users of the simulation do not have prior experience with websites. So a website-like interface will be easy to understand. Also the increasing level of complexity is typical for a website where users can get further and further into specific content using hyperlinks. The simulation tool which was used to build the simulation, Powersim, allows working with hyperlinks. The basic layout of the interface consists of three frames. One ‘title frame’ at the top with the Accenture brand, the name of the simulation and a graphic that is used to strengthen the simulation’s identity. The graphic depicts the hands of different people reaching out and joining in the group’s middle, which is a symbolic representation of an ERP system. Then there is one ‘navigation frame’ on the left side of the screen, with in the top half the six navigation buttons and in the bottom half a brief explanation of the displayed screen. The third frame is the ‘content frame’ which has a different color. All used colors are part of Accenture’s visual identity palette. There are six different main screens: Home, Play & Learn, Causal diagram, Close up of results, Assumptions & constants and Flow diagram. Through the navigation buttons a user can access the other screens from every point in the simulation. In the screen that is presented, the activated navigation button has a yellow border. To increase the visual attractiveness, the navigation buttons exist of both text and a graphic.
18
The most important screen in the simulation is the Play & Learn screen. This is where future users of the simulation will spend most of their time. The screen has the basic three frame division as described, however the content frame is split-up in two parts: a top half with the graphs of the four performance indicators and a bottom half with levers and buttons. In this way the ‘control panel’ looks somewhat like a dashboard in a car, which can help to make the interface easy to understand. The levers are grouped into seven different sections. There are different techniques used to set the values of levers: table inputs, where users have to type in certain values for a parameter, which are used when a parameter can be set in a continuous range; drop-down menus, where users can choose between several options, which are used when a parameter can be set in certain discrete options; and a gauge, where users can slide a parameter to a certain value, which is used for the continuous parameter Length of management commitment because the system can be very sensitive to this parameter.
Other very important screens are the Causal diagrams. This is a set of several screens which interactively build up the qualitative model underlying the simulation. In this way a user can be talked through the model step by step to better understand the dynamic processes and create confidence in the simulation. The screen starts with the main ‘benefit realization’ feedback loop and its ‘complications’. Then, via hyperlinks, other feedback loops are added one at a time. After the dynamic ‘heart’ of the conceptual model has appeared, users can further explore the build up of the different subsystems fit between processes, change management, organizational fit and quality of technology. Ability to use is presented as one variable in the main model, however by clicking on it, the users comes one level deeper and can see how it is built up out of ERP knowledge, business process understanding and ERP skill.
19
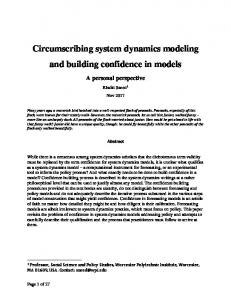
The Close up of results screen presents more graphs of internal variables of the system. In this way the build up of the graphs of the performance indicators can be further explored. Since the ‘Diffusion’ loop has such a large impact on the failure or success of the ERP benefit realization process, the graphs of the variables of diffusion loop take an important place here. More experience users can browse through the more numerical assumptions behind the model in the Assumptions & Constants screen. Since the model is not based on any empirical data, the input value of every variable is entirely transparent and changeable. This allows future users of the model to customize the simulation to their specific situation or improve the results of the simulation by inputting empirical data. The Flow diagram screen is added to give future users a glance at the size and complexity of the computerized model. This might increase their confidence in the simulation. More experienced modelers can see how the model is built up and can follow hyperlinks to the real ‘raw’ Powersim diagrams. 6. Face validation As described in chapter 3, validation and verification was done very thoroughly. In this paper I only discuss some face validation results. To determine if the behavioral output is as intuitively could be expected, several cases were ran through the simulation and the results graphically presented. Some of these scenarios have also been presented to the interviewed experts and they agreed with the displayed behavior Case Case 1 represents a possible realistic situation of a failing benefit realization process. The implementation phase was mainly a technological success, while the ‘people aspects’ got much less attention. The initial level of commitment is 15%, which is comparable to the ‘early adopters’ from Rogers’ Innovation diffusion theory. Half of the organization has received training on operating the ERP system, up to three months before ‘Go Live’. The organizational members’ understanding of the business processes and ERP’s added value to them is poor: 25%. The technology subsystem receives high scores because that was the focus of the implementation. The organization is not quite fitted for an ERP system as jobs are mainly vertically specialized and behavior and communication are rather informal. The system is implemented in a simple, but dynamic environment and after ‘Go Live’ no major system maintenance is performed. Management enthusiastically promotes use and generates commitment during 12 months, when they lose interest in the project. Users are pretty well represented in the ERP project team, though communication is of poor quality. The settings of the case are presented in the table below. Figure 6.1 demonstrates the behavior of the performance variables. External variables In. level of commitment In. level of ERP sys. knowledge In. level of BP understanding In. level of ERP sys. experience Network speed Quality of authorization Quality of data
Value 15 % 20% 25% 1% 10 9 9
External variables Initial down time Organizational fit Type of environment External image of ERP Minimal needed ability to use Organizational ability to learn Formalization of behavior
Value 1 %/mo 50% 4,1 %/mo -1 12,5 % 20 %/mo Organic
Instrument variables
Value
Pressure to use Training on ERP system Training on BP User involv. in develop. Project communication Presence of ERP champion System maintenance
12 mo 0 0 7 3 7 0
20
Performance improvement
B 100
Commitment to use
N 100
80
80
60
60
40
40
20
20
0
0 2005
F 100
2006
2007
2008
2005
2006
A 100
Proccess fit
80
80
60
60
40
40
20
20
0
2007
2008
Ability to use
0 2005
2006
2007
2008
2005
2006
2007
2008
Figure 6.1 Performance of Case
Case – solution 1 – The most important measure management has to take is to set up a system maintenance and management organization. Due to the dynamic nature of the environment, these ERP specialists have to stay around all year. Furthermore the communication about the ERP project is much improved so it receives the grade 9. Also directly after ‘Go Live’, 50% of the organization is sent to training on the business processes and potential benefits of an ERP system. Then the benefit realization is much improved, and the performance improvement achieved. Case – solution 2 Performance improvement
B 100
Commitment to use
N 100
80
80
60
60
40
40
20
20
0
0 2005
F 100
2006
2007
2008
2005
2006
A 100
Proccess fit
80
80
60
60
40
40
20
20
0
2007
2008
Ability to use
0 2005
2006
2007
2008
2005
2006
2007
2008
Figure 6.2 Case - solution 1 -
Another simple possibility is to focus more on the ‘people’ side during implementation. In this way the commitment to use at ‘Go Live’ can become 50%. Together with the system maintenance this also makes sure the benefit realization process becomes a success. 7. Usability and Applicability When the verification and validation had established trust in the simulation model, it was time to assess how the simulation can be used. The verb ‘to use’ has two different
21
meanings in this context: using the model by playing with it (usability) and using the model as a communication tool (applicability). There are basically three requirements for usability and applicability: structure discussion, demonstrate the effect of the different business aspects and how they relate and an interactive interface. The usability part of this section will focus on the interactive interface and a little bit on the demonstration. The applicability part of this section will mainly focus on the basis for discussion and also a little bit on the demonstration of the workings. 7.1. Usability of the ERP Benefit Realization Simulation The usability has been tested by both experts on ERP systems as well as non-experts. A psychologist, who is a non-expert on ERP systems but a big expert on interactive learning, tested one of the earlier versions of the simulation interface. He pointed out that the purpose of the simulation, what it simulated and who it is intended for should be included in the start-up screen. He also suggested the layout of a ‘dashboard’, with the control buttons at the bottom and the results above in the ‘windscreen’. A second version of the interface was tested by the experts in the validation interview and by four non-experts. The most important feedback was then that the simulation is too complex for independent use without further instruction and that users first have to gain trust in the model before using it. A final version was then developed based on the received feedback and the modeler’s own experiences during the testing phase. Although Powersim offers an extensive package of buttons, sliders and gauges to construct an tempting and attractive interface, running the simulation is not just ‘Plugand-Play’. Before changing any of the input variables, a user has to hit the ‘reset’ to clear the simulation. The user can then make the desired changes and has to hit the ‘runbutton’. This has two important drawbacks: the procedure is not intuitive and the model can possibly produce false results. To address the unnatural operating sequence, a clear stepwise instruction was placed in the left-bottom part of the screen. However, because there is so much ‘new’ information on the screen, this gets not picked up by a new user. False results can occur because users are able to input ‘wrong’ numbers; there is no error message when an input parameter is set at an ineligible value. The simulation model is a mathematical representation of a conceptual model which was constructed with a lot of scientific literature. Furthermore, the ‘viewer’ of the simulation does most likely not have the same understanding of the ERP benefit realization process as the ‘show-er’. With this in mind, it is not very likely a new user / viewer will directly be convinced by seeing some buttons and a few graphs that tell if an organization will realize an enormous performance improvement or not. A new user needs to get confidence in the model and the behavior it displays. Therefore the user first has to walk through the conceptual model underlying the simulation model. The ‘ERP Benefit Realization Simulation’ offers the opportunity to click through an ‘interactive causal diagram’. However the tests demonstrates users are not likely to do that by themselves because they either do not understand the workings of a causal diagram or are too eager to go ahead and play. It would be better if a ‘show-er’ walks and talks a new user through the main propositions of the causal diagram before they let them loose and play.
22
There is also another problem considering trust and confidence in the model. Because the simulation is a computerized, and thus quantified, representation of a qualitative conceptual model, it falsely gives an impression of accuracy. This notion will not sound strange in the ears of an experienced System Dynamics user and those users will know how to interpret the results of the simulation. However, a large part of the intended audience will not have experience with System Dynamics and will interpret the quantitative outcomes of the simulation as predictions. If they hear that the core uncertainty of the simulation is in the numbers, they might lose their confidence in the simulation. In conclusion the simulation model meets the requirement to have an interactive interface and to demonstrate how the business aspects affect the ERP benefit realization process. It can probably not be used independently by a new user because he/she would experience trouble with ‘playing with the simulation’ and with confidence and trust. They would have either not enough confidence because they do not understand the underlying conceptual model or too much confidence based on the quantitative results produced. Therefore a new user should always be guided through the simulation by an experienced user. 7.2. Applicability of the ERP Benefit Realization Simulation The applicability of the simulation answers if it can function as a basis for a structured discussion and if it is a useful tool to demonstrate the effects of the different business aspects on the ERP benefit realization. This was also tested through the expert interviews. All experts agreed that if a person is open for learning more about the benefit realization process, this tool can certainly aid in demonstrating the coherence about certain aspects. It also clearly structures discussion by addressing all relevant aspects and dividing them in comprehensible subsystems. The experts saw four different applications of the ERP Benefit Realization Simulation, presented in chronological order: •
•
• •
All four mentioned the commercial potential of the tool: during a ‘sales talk’ or a ‘pitch’ (= a private tender) Accenture can demonstrate they are not only focused on the (technological) implementation phase, but recognize the importance of different ‘people’ aspects, also in the operational phase. This could Accenture give a competitive edge over its competitors. Upfront, before the ERP implementation is started, the tool can be used to develop an integrative approach and also draw attention to the after-‘Go Live’ phase in an early stage. In this way it could prevent the ERP benefit realization process from failure. When designing the ERP system management structure and organization, the tool can make sure no relevant aspects are forgotten. During the failure of an ERP benefit realization process, the tool can aid to visualize the diagnoses and develop a strategy to improve the process. The tool can have an important role in aligning mental models by structuring the discussion and setting definitions.
23
8. Conclusions, recommendations and reflection Section 8.1 discusses the most noticeable results of this research project and answers the research questions stated in section 3. Next, section 8.2 presents the leads for future elaboration, for both business and science, which surfaced during the course of this project. Finally, in section 8.3 I will reflect personally on the followed project approach. 8.1. Conclusions The objective of this research was to provide insight into the key business requirements necessary to improve the ERP benefit realization process, by modeling the dynamic relationships of these requirements. The sponsor of the project has recommended that at least the aspects business processes, information technology, business capabilities, organization, and culture should be addressed. The sponsor also insisted that a System Dynamics modeling approach would be used to reach this objective. Key requirements to improve benefit realization In the explorative phase of this project a combination of scientific theories, literature on ERP systems and explorative interviews learned that an ERP benefit realization process is very complex and often problematic. The complexity and problems arise from the fact that a new information technology, with a large impact on the primary business processes, is introduced in complex organizations (large, geographically dispersed). It was found that there are quite some scientific theories and models on the introduction of innovations and information technology in organizations, but very few deal specifically with ERP systems. This distinction is important because of the major difference between ERP systems and other information technology: the inevitable integration of (at least!) organizational data. There has been a lot or research into specific Critical Success Factors of ERP systems. However, this existing research mainly focuses on the implementation phase; success or failure is determined by whether the implementation project stays within budget and time and not whether an organization is able to generate performance improvement with the ERP system. The interviews with practitioners confirm this view on ERP system’s success or failure, while in fact the implementation phase is where the money is spent, not earned. The return on the often multi-billion investment in ERP can only be achieved with a management scope far beyond ‘Go Live’. The opportunity to enrich an underexposed area of scientific research, and at the same time aid in a process with which many organizations struggle, motivated to construct a conceptual model of the benefit realization process after ‘Go Live’. Following the System Dynamics approach, seven propositions about the causes of the problems have been constructed. The search for causes was guided by the five aspects given at the start of the project, though these were slightly modified. The aspects business processes, information technology, business capabilities, stayed the same while ‘organization’ and ‘culture’ changed in organizational structure and organizational commitment. Three propositions deserve extra attention because they really embody the added insights of this research. These are:
24
Proposition 2: In order to realize the benefits of an ERP system, an organization must have the determination to fully exploit the opportunities the ERP system offers. Simply put, introducing an ERP system means replacing all organizational information systems with one new system, with new processes and interfaces, and asking people to work with different or new data types and formats. It is not hard to imagine this will have a huge impact on day to day operations and thus on organizational performance. It is quite a struggle to get used to these new systems and get things back to the way they were. And that is where the mistake is made: doing things as they were always done, with new systems, is not going to deliver significant performance improvement. An organization must be willing, must be committed, to invest time, money and effort to discover, learn and exploit the opportunities the ERP system offers. This will not happen when the organization is only trying to get back on its feet; this will only happen when the organization is committed to make a step forward. Organizational commitment is a vital determinant of success or failure of the benefit realization process. Proposition 4: In order for an ERP system implementation to become successful, an organization is forced into the configuration of a ‘machine bureaucracy’. Although this proposition is somewhat theoretical, it can be a lead to further research that might result in very practical solutions. A reader of both literature on the Critical Success Factors of ERP systems, and Mintzberg’s theory on organizational structure, will find that a lot of the same factors are mentioned. Therefore the properties of Minztberg’s five organizational configurations were compared with the properties of an organization ideal for ERP systems; a striking fit with the ‘machine bureaucracy’ surfaced. ERP is at its best in an organization where: standardization of processes and communication is the key coordination mechanism; the strategic top and technostructure are able to be the most important part of the organization; there is some horizontal and vertical job specialization; behavior is very much formalized; and there is some horizontal decentralization. There are many organizations which do not fit the conditions described above. And the further an organization’s structure is diverted from a ‘machine bureaucracy’, the more forces of resistance will arise when an ERP system is implemented. However, the notion that most of these aspects are Critical Success Factors, makes them rather compelling. If an organization is changing itself to meet these critical requirements, it is slowly forcing itself towards a ‘machine bureaucracy’. It must be noted that this is a processes that cannot ‘just be done’. Whether an organization is able to organize itself in a ‘machine bureaucracy’ configuration depends on forces in the organization, the primary work processes and the environment. So this proposition is not presented as a solution (“become a ‘machine bureaucracy’ and your benefit realization process will be a success”), but rather as a way to understand failure (“the ERP system does not fit in your organization, and that is an important reason why it encounters so much resistance”). Proposition 6: Benefit realization demands fit between actual and embedded processes, which is continuously under pressure in a changing environment. A ‘machine bureaucracy’, and thus also an ERP system, fits best in a simple and stable environment. The ERP system supports, and in some cases automates, business processes of the organization. Therefore these processes have to be parameterized in the system, which
25
takes quite some time and effort of ERP specialists. Organizations in a changing environment, either due to its dynamics or complexity, continuously adapt their business processes to the new environment. If the processes embedded in the ERP system are not updated, there arises a divergence between system and reality. The processes and data of the ERP system do no longer match the actual business processes and needed information. If not corrected by system maintenance, in the end the system will be useless and will not generate any performance improvement. Lack of system maintenance, as well as implementing an ERP system in a very dynamic or complex environment, is bound to lead to a failure of the benefit realization process. The propositions presented above are the most noticeable that surfaced during the construction of the conceptual model. The previous paragraphs present the insights in the key requirements necessary to improve the benefit realization process of ERP systems. Next, these insights will be conveyed using a dynamic model. The next paragraphs present the results of the development of the ‘ERP benefit realization simulation’ by answering research question B. B. Providing insights: How can a dynamic business model play a role? Following a System Dynamics research approach, the conceptual model is formalized into a computerized simulation model. The mathematical formulations are based on the seven propositions and insights from academic literature. There is no empirical data used to parameterize the simulation model. All quantitative factors are based on face validation and the modeler’s accumulated knowledge of the ERP benefit realization process. Therefore all constants are made transparent and changeable in the final simulation model. To answer to the second research question is built up out of the answers to the three sub-questions: B1: was it justified to build a simulation model? The ERP benefit realization process is very complex and dynamic. For example the commitment to use has an impact on the ability to use, and vice versa; both directly effect the benefit realization process, which in turn has also has a large impact on the commitment to use. The seven propositions independently already provide insight in the benefit realization process; seeing them integrated as a whole provides even more insights. The integrated whole is more than the sum of the separate elements. The presence of these multiple feedback loops makes it too hard to effectively address the effect of different policies by plain mono-causal reasoning. By developing a simulation model the behavior of the system over time can be made transparent. The simulation model helps to visualize the constructs of the conceptual model and their interaction. It allows users of the simulation to experiment with different levers and see the effect of their choices before those are made. They were probably not able to see all these effects beforehand. So yes, it was justified to develop a simulation model. B2: What are the strengths and weaknesses of the developed simulation model? The main strength of the simulation is that it is a visually attractive tool to structure the discussion about the ERP benefit realization process after ‘Go Live’. The underlying conceptual model is strongly embedded in existing academic models on innovation
26
diffusion and use of information technology. It presents all relevant aspects and processes of the benefit realization phase. Especially the combination of an interactive causal diagram with a ‘dashboard’ where users can see the impact of different levers is useful. The model cannot be instantly used, which is not directly a weakness of the model, but more not entirely fulfilling the objective of this project. Users need to understand the basics of a System Dynamics simulation, develop trust in the underlying causal model and understand how to interpret the results of the simulation. Therefore there should always be a ‘guide’ who is more experienced with the simulation. Upfront this condition was not foreseen. Another weakness might be that the operational validity is only based on face validation. However this seems appropriate for the intended purpose of the simulation. The validity of the model is very sensitive to assumptions around the dynamic core of the model. Changes in the five feedback loops have a large impact on system behavior. These changes can be in the numerical value of the assumptions, as well as in added causal relationships. 8.2. Recommendations Although the described research project is finished, there is future work left to be done. The added value of the project has been the integration of many insights on ERP benefit realization into one conceptual model. Much (empirical) research has been done into how specific business aspects or Critical Success Factors during the implementation phase influence the benefit realization process. However, the strength of this project, that it integrates all business aspects, can at the same time be its weakness. It forces the model to be on a high level of aggregation. This means the model might stand quite far from the operating practice. Those who intent to elaborate on this thesis and the simulation tool should really ask themselves in which way they want to continue. Do they want to enrich the current work? Do they want to improve the ‘teaching capabilities’ of this current simulation? Or do they want to develop a more extensive business simulation? And how far will this go? Is it possible to ever develop an actual predictive simulation of a business organization? Or do they maybe really want to develop practical solutions to improve the benefit realization process? I will present my thoughts on where future work can be done, both for business and science. The link between the model and the ‘problem entity’ is still rather weak. Therefore, based on reactions during the expert validation interviews, it is recommended that future work is done to enrich both the conceptual model as the simulation tool with concrete examples from practice. So when a conceptual proposition or mathematical relation is introduced, it can directly be supported by one or more real-life examples. This aids both the confidence in the model and simulation as well as the effectiveness of the interactive learning. Another recommendation deals with the ‘teaching ability’ of the simulation tool. Most of the learning about the ERP benefit realization process is done by me, as a modeler in the past few months. My learning has resulted in a simulation tool, which bares my acquired knowledge in it and should be able to convey this knowledge. There is a big
27
chance it will only partly succeed in this, because someone who wants to learn from the simulation must have a high level of trust in it (see also chapter 6). It would be better if that person was somehow involved in the simulation building process. Therefore I suggest exploring the possibilities of building a sort of ‘simulation’ library. In this library several pre-defined elements of the benefit realization process are present; e.g. an ability to use module, with a training sub-module and an experience sub-module. Next one could design an interactive workshop in which you let people brainstorm about the relevant aspects of ERP benefit realization; it is very likely they will come up with most of the elements present in the library. In the next step the participants of the workshops are going to structure and link the different elements; since the dynamic processes embedded in the ‘ERP benefit realization simulation’ are based on models which have been empirically tested, it is likely the same feedback loops will appear. Finally the participants parameterize the different modules themselves, so they automatically have confidence in the values. With a few clicks then a new version of the ‘ERP benefit realization simulation’ can be build, and those who are supposed to learn from it, are involved in the development. In this way they have come up with the knowledge themselves, instead of that is shot at them in ‘ready-to-swallow’ pieces. It is also an option to extent the current business simulation. The proposed conceptual model should not be treated as ‘finished’. During the search for real-life examples one might find that certain causal relations have to be refined, variables added or removed. In this way, the conceptual model can function as a structured basis for future scientific research. Now, after this study has lifted many aspects to a higher aggregate level and integrated them, it is time to go back in to a deeper level of refinement and detail. Instead of a purely qualitative approach used in this study, it is recommended to more quantitatively explore the boundaries of the model and see where further refinement could be useful. Another possibility is to go search for actual practical solutions to improve the benefit realization process. I believe interesting new views can be obtained by approaching from a more organizational perspective. Using the proposition that an ERP system fits best in a machine bureaucracy, the effect on benefit realization can be analyzed for each organizational parameter not matched with this configuration. This will then lead to a much better problem understanding, which can be used to effectively design solutions. 8.3. Reflection The objective of this research was to provide insight into the key business requirements necessary to improve the ERP benefit realization process, by modeling the dynamic relationships of these requirements. The results of this research are a conceptual model based on seven propositions and a simulation tool. Was it necessary to build a dynamic simulation tool to acquire the insight in the ‘key business requirements to improve the benefit realization process’? In a new study about the ERP benefit realization process, would I use this approach again? What other approach could have been used? These questions will be answered in this section. First of all, I think the objective of the sponsor of this project is more extensive than the objective of the project itself. For a large business consultant not only the insight in the
28
key requirements, validated by academic research, is important, but also the possibility to clearly communicate these findings. To judge the followed approach, these two objectives are separated, because they have different implications. There are approaches to obtain the desired insight and there are other approaches to communicate those findings. This project is for a large part an extension of Repenning’s dynamic model of innovation implementation. Using his dynamic model as a start off point really focused the exploration of the ERP benefit realization process. It lead to several extensions, mainly in the ‘organizational fit’ and ‘fit between processes’ subsystems. The formulation step of the System Dynamics approach really forced to clarify and understand the impact that the different subsystems had on the benefit realization process. So although a much heard critique is that is sometimes impossible to capture certain phenomena in mathematical equations, trying to do so really aids the conceptual understanding. This improved understanding then lead to the construction of the seven propositions. However, the final dynamic behavior of the system did not really come as a surprise because it is fairly similar to Repenning’s system behavior. Though in the simulation built in this project there are more factors that can lead to a failure of the benefit realization process. The model and simulation are much richer and provide much more insights than Repenning’s model. There are other research methods, both on the hard and on the soft side of the spectrum, which could have been used to acquire more insight in the ERP benefit realization process. The research could have focused much more on the soft side, providing insight in the organizational processes around an ERP system, the flows of authority and decisions and the ‘force field’ around the ERP system. On the other hand the research could have been much more quantitative, using discrete modeling to simulate the processes in the ERP system and see how value is created; or using economic studies by performing a full-scale cost benefit analysis or developing an economic rationality model. All methods would have provided much more insight in the ERP benefit realization process. However I strongly doubt if they would have been able to clearly identify the different levers decision makers have to influence this process. And even if they did, they would not have been able to visualize the different effects that occur via the different feedback loops. And this brings me to the second important objective: transferring the obtained insights. If a business consulant wants to convince their clients or colleagues of the importance of an integrative approach and a focus on the period after ‘Go Live’ they have several options. They could simply approach their clients with a fancy presentation and explain their insights to them. I find a problem with this type of communication that is only ‘sending’ information by the consultant, while ‘receiving’ on the other side is not guaranteed. Anther option could be that the consultant develops a ‘decision support tool’ for their clients. This will allow decision makers to insert certain information about their organization and ERP system, and the decision support tool will prescribe them what is best to do. I do not doubt that this could be a very useful tool, however again the decision makers are not learning to understand the processes going on inside their organization.
29
A simulation tool on the other hand demands interaction between the simulation and its user. A user interactively learns more about the effect of his/her decisions. In the mean time this can form a basis for discussion; the user can ask questions about the experiences he/she has with the tool. On the other side Accenture can see how the user approaches the (virtual) benefit realization process and better understand where problems might arise. Thus to reach the communicative and learning objective I find simulation the strongest tool. So in conclusion: yes, I would follow this approach again if I was trying to achieve this specific result. However, if I was trying to contribute to the improvement of the ERP benefit realization process in a more practical way, I believe more concrete problems and solutions can be found by analyzing the process from a more organizational perspective. I would then still follow the first steps of the System Dynamics approach (explorative and conceptualization phase) but would go on and computerize the model. I would elaborate the conceptual model and in order to communicate my findings I would go further down the path of ‘interactive causal diagrams’ (as can be seen in the simulation tool). Final remark to the reader This paper is compiled of a more extensive master thesis report. In this report you will find all the relevant technical details on stock & flow diagrams, mathematical formulas specifications and validation and verification reports. If you are interested in the full report or in the ERP Benefit Simulation Tool, please contact us. References Accenture (2003). SAP ROI: the pursuit of unrealized benefits. Agarwal, R. and J. Prasad (1997). "The role of innovation characteristics and perceived voluntariness in the acceptance of information technology." Decision Sciences 28(3): 557-582. Aladwani, A. M. (2001). "Change management strategies for successful ERP implementation." Business Process Management Journal 7(3): 266-275. Amoako-Gyampah, K. and A. F. Salam (2004). "An extension of the technology acceptance model in an ERP implementation environment." Information & Management 41: 731 - 745. Archibald, N., B. Saeed, et al. (2000). Getting Value from Enterprise Initiatives: A Survey of Executives. BCG Research Report. Boston, The Boston Consulting Group: 25. Askenäs, L. and A. Westelius (2000). Five Roles of an Information System: a social constructionist approach to analyzing the use of ERP systems. Proceedings of the 21st International Conference on Information Systems, Brisbane, Australia, AIS, Atlanta. Azjen, I. (1991). "The theory of planned behavior." Organizational behavior and human decision processes 50: 179 211. Bagchi, S., S. Kanungo, et al. (2003). "Modeling the use of enterprise resource planning systems: a path analytic study." European Journal of Information Systems 12: 142 - 158. Bancroft, N. H., H. Seip, et al. (1998). Implementing SAP R/3: How to introduce a large system into a large organization. Greenwich, CT, Manning Publications. Borsboom, H. (2005) Interview Benefits Realization. by G. Heijkoop, April 7th, 2005 at Accenture, Amsterdam Boyce, W. E. and R. C. DiPrima (2000). Elementary differential equations and boundary value problems, John Wiley & Sons, Inc. Brown, C. V. and I. Vessey (1999). ERP implementation approaches: toward a contingency framework. Proceedings of the 20th International Conference on Information Systems, Charlotte, North Carolina. Collins (1995). Collins Cobuild English Dictionary. Birmingham, Harper Collins Publishers. Croteau, A.-M. and L. Raymond (2004). "Performance outcomes of strategic and IT competencies alignment." Journal of Information Technolgoy 19: 178 - 190. Davenport, T. H. (1998). "Putting the enterprise into the enterprise system." Harvard Business Review 76(4): 121 131. Davenport, T. H., S. Cantrell, et al. (2002). Enterprise solutions: Get with the program. Accenture Outlook: 48-55. de Bruijn, J. A. and E. F. ten Heuvelhof (1999). Management in netwerken. Utrecht, Uitgeverij Lemma BV. de Weerdt, M. (2005) Interview Benefits Realisation. by G. Heijkoop, April 22nd, 2005 at Accenture, Amsterdam
30
Deloitte (1999). ERP's second wave, Deloitte consulting: 48. Delone, W. H. and E. R. McLean (2003). "The DeLone and McLean model of Information Systems Success: a TenYear update." Journal of Management Information Systems 19(4): 9-30. Dong, L. (2001). "Modeling top management influence on ES implementation." Business Process Management Journal 7(3): 243 - 250. Enserink, B., J. F. M. Koppenjan, et al. (2001). Analyse van complexe omgevingen. Delft, Faculty of Technology, Policy and Management, TU Delft. Francalanci, C. (2001). "Predicting the implementation effort of ERP projects: empirical evidence on SAP R/3." Journal of Information Technolgoy 16: 33-48. Hawking, P., A. Stein, et al. (2004). Revisiting ERP Systems: Benefit realisation. Proceedings of the 37th Hawaii International Conference on System Sciences, Hawaii. Hillman Willis, T. and A. H. Willis-Brown (2002). "Extending the value of ERP." Industrial Management & Data systems 102(1): 35 -38. Hitt, L. M., D. J. Wu, et al. (2002). "ERP Investment: Business Impact and Productivity measures." Journal of Management Information Systems 19(1): 71 - 98. Ho, C.-F., W.-H. Wu, et al. (2004). "Strategies for the adaption of ERP systems." Industrial Management & Data systems 104(3): 234 - 251. Hofstede, G. (1980). Culture's consequences; international differences in work-related values. Beverly Hills, Sage. Hu, P. J., P. Y. K. Chau, et al. (1999). "Examining the technology acceptance model using physician acceptance of telemedicine technology." Journal of Management Information Systems 16(2): 91-112. Huber, G. P. (2001). "Transfer of knowledge in knowledge management systems: unexplored issues and suggested studies." European Journal of Information Systems 10: 72 - 79. Lane, D. C. (1994). "With a little help from our friends: how system dynamics and soft OR can learn from each other." System Dynamics Review 10(2-3): 101 - 134. Legris, P., J. Ingham, et al. (2003). "Why do people use information technology? A critical review of the Technology acceptance model." Information & Management 40: 191 - 204. Levitt, R. E. and A. Mahalingam (1997). Presentation on Modeling Culture, Stanford University. Mabert, V. A., A. Soni, et al. (2001). Enterprise Resource Planning: Common Myths versus Evolving Reality. Business Horizons. Markus, M. L., S. Axline, et al. (2000). "Learning from adopters' experiences with ERP: problems encountered and success achieved." Journal of Information Technolgoy 15: 245 - 265. Marsh, A. (2000). The implementation of Enterprise Resource Planning systems in small-medium manufacturing enterprises in South-East Queensland: a case study approach. Proceedings of the 2000 IEEE International Conference on Management Innovation and Technology. Mintzberg, H. (1983). Structure in Fives. Englewood Cliffs, New Jersey, Prentice-Hall International Editions. Nah, F. F.-H., K. M. Zuckweiler, et al. (2003). "ERP Implementation: Chief Information Officers' Perceptions of Critical Success Factors." International Journal of Human-Computer Interaction 16(1): 5-22. Nicolaou, A. I. (2004). ERP Systems Implementation: Drivers of post-implemtation success. Proceedings of the International Conference on Decision Support Systems, Prato, Italy. Repenning, N. P. (2002). "A Simulation-based approach to understanding the dynamics of innovation implementation." Organization Science 13(2): 109 - 127. Rifkin, S. (2003). Two good reasons why new software processes are not adopted. International Conference on software engineering, Portland, Oregon. Roberts, E. B. (1978). Managerial applications of System Dynamics. Cambridge, MA, MIT Press. Rogers, E. (2003). Diffusion of Innovations. New York, The free press. Ross, J. W. and M. R. Vitale (2000). "The ERP revolution: Surviving vs. Thriving." Information Systems Frontiers 2(2): 233 - 241. Rummler, G. A. and A. P. Brache (1990). Improving Performance: How to manage the White Space on the organization chart. San Francisco, Jossey-Bass Publishers. SAP. (2005). "SAP.com." Retrieved March 28th, 2005, from http://www.sap.com/index.epx. Sargent, R. G. (1999). "Validation and verification of simulation models." Proceedings of the 1999 winter simulation conference: 39 - 48. Sarker, S. and A. S. Lee (2002). "Using a case study to test the role of three key social enablers in ERP implementation." Information & Management 40(8): 813 - 829. Scheer, A.-W. and F. Habermann (2000). "Making ERP a Success." Communications of the ACM 43(4): 57 - 61. Schneiderman, A. (1988). "Setting quality goals." Quality progress 21(4): 51-57. Scott, J. E. and I. Vessey (2000). "Implementing Enterprise Resource Planning Systems: The role of learning from failure." Information Systems Frontiers 2(2): 213 - 232. Sedera, D., M. Rosemann, et al. (2001). Using performance measurment models for benefit realization with enterprise systems - the Queensland government approach. Proceedings of the 9th European Conference on Information Systems, Bled, Slovenia. Senge, P. M., R. Charlotte, et al. (1994). The fifth discipline fieldbook. London, Nicholas Brealey Publishing Limited.
31
Shehab, E. M., M. W. Sharp, et al. (2004). "Enterprise resource planning; an integrative review." Business Process Management Journal 10(4): 359 - 386. Sherer, S. A., R. Kohli, et al. (2003). "Complementary Investment in Change Management and IT investment Payoff." Information Systems Frontiers 5(3): 321 - 333. Society, S. D. (2005). "System Dynamics Home Page." Retrieved June 18th, 2005, from http://www.systemdynamics.org. Somers, T. M. and K. G. Nelson (2003). "The impact of strategy and integration mechanisms on enterprise system value: Empirical evidence from manufacturing firms." European Journal of Operational Research 146: 315 338. Sterman, J. D. (2000). Business Dynamics: systems thinking and modeling for a complex world. Sumner, M. (2000). "Risk factors in enterprise wide/ERP projects." Journal of Information Technolgoy 15: 317 - 325. Swart, J. (2005) Interview Benefits Realization. by G. Heijkoop, April 20th, 2005 at NAM, Assen Trochim, W. M. (2002). "Deduction and Induction." Retrieved February, 2004, from http://www.socialresearchmethods.net/kb/dedind.htm. van Daal, P. and K. Beijer (2005) Interview Benefits Realization. by G. Heijkoop, May 17th, 2005 at SAP Office, 'sHertogenbosch van Daalen, C. (2001). Continue Modellen - Deel A. Delft, Faculty of Technology, Policy and Management. van den Goor, G. (2005) Interview Benefits Realization. by G. Heijkoop, April 14th, 2005 at Accenture, Amsterdam van Everdingen, Y., J. V. Hillegersberg, et al. (2000). "ERP adoption by European mid-size companies." Communications of the ACM 43(4): 27-31. Venkatesh, V. and F. D. Davis (2000). "A theoretical extension of the technology acceptance model: four longitudinal field studies." Decision Sciences 46(2): 186-204. Venkatesh, V. and M. G. Morris (2000). "Why do not men ever stop to ask for directions? Gender, Social influence and their role in technology acceptance and usage behavior." MIS Quarterly 24(1): 115-139. Walker, W. E., P. Harremoës, et al. (2003). "Defining Uncertainty: a conceptual basis for Uncertainty Management ion Model-Based Decision Support." Integrated Assessment 4(1): 5-17. Willcocks, L. P. and R. Sykes (2000). "The role of the CIO and IT function in ERP." Communications of the ACM 43(4): 32 - 38.
32


![Modeling Start-ups using System Dynamics - System Dynamics Society [PDF]](https://m.moam.info/img/260x300/modeling-start-ups-using-system-dynamics-system-dy_648bbbc3098a9e4e318b459b.jpg)