Sep 29, 2011 ... SAS Enterprise Guide is a Windows client application with an easy-to-use ....
tutorial. Connect to the online SAS Enterprise Guide resources.
2011-2012
Using the SAS Enterprise Guide (Version 4.2) Table of Contents Overview of the User Interface ...................................................................................................1 Navigating the Initial Contents of the Workspace .................................................................................................. 3
Useful Pull-Down Menus ............................................................................................................3 Working with Data ......................................................................................................................4 SAS Data Files ....................................................................................................................................................... 4 Other Data Files ..................................................................................................................................................... 5
Working with Tasks ....................................................................................................................6 Choosing a Task .................................................................................................................................................... 6 Performing a Task .................................................................................................................................................. 6 Exploring a Typical SAS Task Window .................................................................................................................. 7 Example: Creating a Simple Report ....................................................................................................................... 8
Working with Results ..................................................................................................................8 Changing the Result Format .................................................................................................................................. 8 Changing the Result Style .................................................................................................................................... 10 Exporting a Result as a Step in a Project ............................................................................................................ 10
Working with Process Flow....................................................................................................... 12 For More Information and Assistance ....................................................................................... 13 SAS Enterprise Guide Help .................................................................................................................................. 13 SAS Enterprise Guide Tutorials ........................................................................................................................... 14 Books ................................................................................................................................................................... 14 SSDS at Stanford ................................................................................................................................................. 14
Overview of the User Interface SAS Enterprise Guide is a Windows client application with an easy-to-use graphical user interface (GUI). The GUI consists of pull-down menus, dialog boxes, and windows that display and organize data, and perform numerical and graphical tasks. You can perform all tasks in SAS Enterprise Guide by pointing and clicking the mouse. This section describes the basic features of the SAS Enterprise Guide pull-down menus and windows. SAS Enterprise Guide is a stand-alone application that requires a SAS server, which can be either a local server or a remote server on any major computer platform. To use SAS Enterprise Guide with a remote server, SAS Integration Technologies is also required. A basic familiarity with the Windows operating system is all you need to get started with SAS Enterprise Guide. You can access SAS Enterprise Guide on a PC from the Start menu, or by doubleclicking on the Enterprise Guide icon (shown below) on the desktop if applicable.
Enterprise Guide 4.2
Stanford University Social Science Data and Software
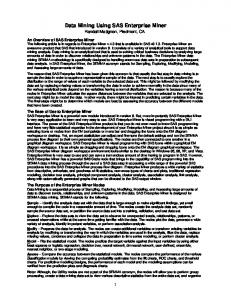
When you first start SAS Enterprise Guide, you may see a screen like the one below.
For the purposes of this guide, you should select New Project. You will then see a screen like this one: 1. Project Tree
2. Pull-Down Menu
3. Process Flow Window
5. Task List
2 – Using the SAS Enterprise Guide (Version 4.2)
4. Task Status
This area is the workspace, and the Process Flow should be the only window open in the workspace.
Navigating the Initial Contents of the Workspace 1. The Project Tree window displays a hierarchical view of the active project (see screenshot on previous page). When you start with a new project, the Project Tree window is empty. As you add data, run tasks, and generate results, an icon for each object is added to the Project Tree window. 2. As new windows open in the workspace, which happens when you run analyses or open data, you need to navigate between them. The pull-down menu at the top of the open window allows you to do so. 3. The Process Flow window is a container for one or more components of the project. Unlike the Project Tree, the Process Flow offers a relational view of the objects in the project. As you add data, run tasks, and generate results, an icon for each object is added to the Process Flow window and any relationship between the objects is shown with an arrow. If you want to run multiple sets of analyses, you can create new Process Flows. You can also copy or move objects between Process Flows. Additionally, you have the option of running a portion of the Process Flow or the entire Process Flow. 4. The Task Status window, usually located at the bottom of the screen, displays messages about the status of tasks as they are processing. 5. The Task List is hidden by default, but you can display it by clicking or moving your mouse pointer over the Task List icon, labeled in the screenshot on the previous page. The Task List allows you to perform various kinds of tasks (e.g., statistical analysis, graphs, etc.) with a simple click. Once you perform a task, it will show up in both the Process Flow and Project Tree. Comprehensive help is available from the Help menu. By using the tabs in the Help window, you can browse the contents or index, perform a search, or bookmark pages for future reference.
Useful Pull-Down Menus Like most Windows programs, SAS Enterprise Guide has a toolbar and a menu bar with pull-down menus that you can use to access many of the features of the program. The toolbar contains buttons for more commonly used procedures. To see what each button does, hold the mouse over the button for a moment and a description of what the button does will appear. The following is a summary of the main pull-down menus and their functions:
3 – Using the SAS Enterprise Guide (Version 4.2)
Menu File Edit View
Tasks Program Tools
Help
Functions Open and save project, data, code, report, and process flow. Import and export data. Print process flow. Modify or copy text, search and replace data. Expand or collapse data. Customize the look of the SAS Enterprise Guide window by selecting to view the tool bars for Project Flow, Task List, and Task Status. Perform statistical procedures to manage data, create graphs, and produce descriptive and inferential statistics. Open new or existing program (where you type SAS code to perform analyses), run or stop current program. Combine multiple reports into one. Set style of report. Set options such as window layout and enabling particular features. Get help on SAS Enterprise Guide tasks. Getting Started tutorial. Connect to the online SAS Enterprise Guide resources.
Working with Data Before you can do anything in SAS Enterprise Guide, you need to add the data that you want to analyze to your project. In addition to SAS data files, SAS Enterprise Guide can read most PC data files such as HTML, Microsoft Access, dBASE, Microsoft Excel, Microsoft Exchange, IBM Lotus 1-2-3, and Paradox files. You can open data that are located on your own computer or on the SAS server that you are authorized to access.
SAS Data Files Data on a server can either be opened from the Libraries or Files folder. SAS libraries are pointers to locations that store SAS data sets. The Files folder enables you to browse the directory structure of the server and open any data file that SAS Enterprise Guide can read. If you choose to look for data on your local computer, you can browse the file structure of your computer. There is a large collection of sample data that is installed with SAS Enterprise Guide in the Data folder of the Sample directory. Here is an example of how to open a SAS data set on the local computer: From the File menu, select Open Data. Select Local Computer, find the folder where the data are located, and double-click the data file. When you open a data file, it opens in a data grid that is located in the workspace area (see screenshot on page 5). The pull-down menu at the top of the data grid shows the name of that data file. At the same time, a shortcut to the data is automatically added to the Process Flow of the current project, and the data open in a data grid. By default, the data open in read-only mode. In the Process Flow window there are shortcuts to a SAS data set. 4 – Using the SAS Enterprise Guide (Version 4.2)
Other Data Files If you select an Excel file to open, you must decide if you want to open the file as it is or if you want to import the data to create a SAS data set. If you choose to create a SAS data set from the data, the Import Data task opens automatically. If you have data in a text file that you want to use in a task, you must import the data or create a SAS data set first. You can open the Import Data task from the File menu. After having added data to your project, you can explore the data by viewing them in the data grid. You can also view the properties of data by right-clicking the data object in the Process Flow window and selecting Properties from the pop-up menu. The Columns pane in the Properties window lists all the columns, or variables, in the data as well as the properties of each column. You can also set options for your task results by going to Tools, selecting Options and making changes in the pop-up menu. Setting these options affects the way that data are opened and displayed in SAS Enterprise Guide. SAS reads the data in each column as either character data or numeric data. Icons for the variables appear in the column headings of the data grid and provide information about the variables’ type. 5 – Using the SAS Enterprise Guide (Version 4.2)
Character variables have a pyramid icon at the top of the column whereas numeric variables have a circular icon with numbers inside. In addition to opening existing data and using them, you can also work with your data in the following ways: • use the Import Data wizard to create SAS data sets from raw data files and Excel files by going to FileI mport Data and selecting the desired data or Excel file; •
use the New Data wizard to create a new SAS data file by going to FileNewData;
•
use the Query Builder to manipulate your data, including filtering, joining, adding columns, and sorting (see Building Queries in SAS Enterprise Guide Help for more information);
•
make changes directly to data in the Data Grid by double-clicking on any cell in the data grid and clicking yes in the window asking if you would like to switch to update mode.
Working with Tasks Choosing a Task After you have data in your project, you generally want to work with them in some way. In SAS Enterprise Guide, you use tasks to do everything from manipulating data, to running specific analytical procedures, to creating reports. After you have opened a task window, you can view help for the entire task by pressing F1 to open the help window for that task. In addition, in the task window you can view a short description of each option that you can select in a task by moving your mouse pointer over the option and reading the description in the help pane at the bottom.
Performing a Task One way to select tasks is by using the Task List. The Task List is hidden by default, but you can display it at anytime by clicking the Task List icon (see screenshot on page 2). Once you click the Task List icon, you will see a pull-down menu allowing you to display Tasks by Category or Tasks by Name. Select Tasks by Category. If a task has a wizard version and you want to use it, you can click Use Wizard to the right next to the task name in the Task List. As you scroll down in the Task List, you see tasks in the Graph category. As you scroll down further, you see tasks for Statistical Analysis. Now switch to Tasks by Name from the pull-down menu. This way of viewing tasks lists individual tasks alphabetically. It also lists the SAS procedure or procedures that are used in the task, which is helpful is you plan on writing your own SAS code in the future. In each task window, there are certain steps that you must complete before you can run the task. For example, you must specify which variables you want to analyze and how you want to analyze them. 6 – Using the SAS Enterprise Guide (Version 4.2)
After that, you can select from a variety of options that pertain to the particular task. The most common options for each task are selected for you, so after you've specified the information that is necessary to run the task (e.g., indicated which variables to use), the Run button becomes available and you can run the task and get the default results.
Exploring a Typical SAS Task Window All tasks have a Task Roles list where you assign variables to roles in the task. This is how you tell SAS Enterprise Guide how you want to analyze your data. The Task Roles list displays all the ways that variables can be used in a task. The Variables to Assign list displays all the variables from the data that you have selected. The small window on the right of the screen gives a demonstration of what to do with instructions beneath it. Note: The data icon next to each variable shows the variable’ s type, and the icon next to each task role shows the type of variable that the role will accept. Demonstration Variables to Task roles with instructions assign
Preview code 7 – Using the SAS Enterprise Guide (Version 4.2)
To assign a variable to a task role, select the variable and drag it to the role. You can also select the variable, click the right arrow, and select the role from the menu that appears. Most tasks enable you to set a title (which appears at the top of the results) and footnote (which appears at the bottom of the results) for the task. Note: As you assign variables to roles and select options, SAS Enterprise Guide generates code that it will send to SAS to process. You can see this code by clicking the Preview code button in the lower-left of each task window.
Example: Creating a Simple Report The most basic report that you can create in SAS is a List Report. This type of report has one line for each row (or observation) in your data. You can select the columns (or variables) that you want in your report, group the data, and add totals and subtotals. The task that creates this report is the List Data task. •
In the Process Flow window, select the data set. Then in the Describe menu of the Task List, select List Data.
•
Select variables of interest by pressing CTRL and clicking them. Drag them to the List Variables category on the right, or click the right arrow and select List variables.
•
After that, assign the grouping variable (if applicable) by dragging it to the Group analysis by role, and the Identifying label role.
•
You can now set Options if needed and click Run.
•
Once the results appear in the window, click the Create pull-down menu at the top of the window and select Create Report. Doing so will allow you to alter the format and style of the report as discussed below.
Working with Results Changing the Result Format The List Report created above opens as a default in the SAS Enterprise Guide main window. If you want to save it in a format other than SAS, you can easily do so by clicking on Export and selecting Export SAS Report. Then click the pull-down menu for Files of type at the bottom of the window (see screenshots below). You’ ll see that you have the option of saving the report as a SAS, an HTML, a PDF, or an XML file.
8 – Using the SAS Enterprise Guide (Version 4.2)
Modify Report
Files of type
9 – Using the SAS Enterprise Guide (Version 4.2)
Export
Properties
Changing the Result Style You can also change the style and layout of the report. The style dictates such characteristics as the color and font of the tables and graphs in the report. SAS Enterprise Guide has several preset styles, and you can set the report to one of them by clicking Properties in the upper right-hand corner of the List Report window, then clicking the pull-down menu next to Style and selecting the preferred style (see top screenshot on previous page). You can also join reports from separate analyses you have run and choose their layout (e.g., have the two reports be side-by-side or one on top of the other) by clicking M odify Report at the top left-hand side of the window (see top screenshot on previous page). This also allows you to insert text or image into the report.
Exporting a Report as a Step in a Project Now suppose you would like to export the List Report as a step in a project, and you would like it to be an HTML file. That way, each time you run the project an updated HTML file will be exported to a specified location. First, in the List Report window, click Export Export Report As A Step In Project from the pop-up menu. The first page of the Export wizard enables you to select the file that you want to export. In this case, you should select SAS Report – List Data. Click Next.
10 – Using the SAS Enterprise Guide (Version 4.2)
The second page of the Export wizard enables you to choose the file type of the exported file. To save the report as an HTML file, select HTML documents.
The third page of the Export wizard allows you to specify a location for the exported file. If you would like to change the name of the file, simply type over the default name. Take care not to change the file extension (.html) or where it will be saved when changing the file name. Click Next.
11 – Using the SAS Enterprise Guide (Version 4.2)
The fourth page of the Export wizard enables you to review the selections that you have made. Click Finish.
The Export task runs and creates the HTML file. You have changed the result format and style, and you have learned to export an HTML file as a step in a project.
Working with Process Flow In practice you will probably have multiple data sets and tasks in one project. Sometimes it is helpful to create a new Process Flow and move some of the objects from the default Process Flow to a separate Process Flow. This makes it easy to run a Process Flow to refresh your results. You can even use File in SAS Enterprise Guide to schedule the task to run automatically (see Automating Projects in SAS Enterprise Guide Help for more information). Here is an example of how you can run the same task repeatedly, on different data sets without doing everything from scratch. In the main Process Flow window, click the New button (the document icon shown in the screenshot on the next page). From the pull-down menu, select Process Flow. Once you have the new Process Flow (which SAS Enterprise Guide assigns the name Process Flow 1) open, you can rename it by clicking Properties at the top right-hand side of the screen. Then you can copy parts of your original Process Flow and paste them into the new Process Flow you have just created. For example, if you would like to run a List Data analysis on the SAS dataset “ cars” instead of “ candy,” create a new Process Flow as outlined above, click on Properties, and type “ Car Analysis” in the Label field to rename it. Then go to FileOpenData and select “ cars” from the SAS Sample Data folder. Once the icon for the cars dataset has appeared in the Car Analysis window, you can right click on List Data on the left-hand side of the screen under Project Tree and select Copy. Then right click on the icon for the cars dataset in the Cars Analysis window and select Paste. You now have a List Data analysis set up for the dataset cars. 12 – Using the SAS Enterprise Guide (Version 4.2)
Project Tree
List Data
New Button (for creating a new Process Flow)
Properties
For More Information and Assistance SAS Enterprise Guide Help SAS Enterprise Guide has an extensive help system that provides information about using it and understanding the results. To access the Help system, go to the Help menu and select an option. The Explore SAS Enterprise Guide lists a table of contents from which you can link to the topics listed. The Getting Started Tutorial walks you through the most frequently used features of SAS Enterprise Guide. You are also only a click away from online resources for SAS Enterprise Guide. This resource contains much up-to-date information about this product.
13 – Using the SAS Enterprise Guide (Version 4.2)
SAS Enterprise Guide Tutorials For information on SAS Enterprise Guide tutorials and resources, see http://support.sas.com/documentation/onlinedoc/guide/
Books The following books are available digitally through the Stanford Libraries using SearchWorks. Slaughter, S. J. & Delwiche, L. D. (2010). The little SAS book for Enterprise Guide 4.2. Norwood, MA: SAS Institute. David, J. B. (2007). Statistics using SAS Enterprise Guide. Cary, NC: SAS Institute. Please see also the document on Resources for Learning SAS compiled by SSDS staff at:
https://www.stanford.edu/group/ssds/cgi-bin/drupal/content/getting-started-guidesdocuments
SSDS at Stanford Software Services provides technical support for SAS users at Stanford. Users can ask questions or make appointments with SSDS consultants via our website. For more information or to contact us, please visit: http://ssds.stanford.edu/ Copyright © 2011 by The Board of Trustees of the Leland Stanford Junior University. Permission granted to copy for non-commercial purposes, provided we receive acknowledgment and a copy of the document in which our material appears. No right is granted to quote from or use any material in this document for purposes of promoting any product or service. Social Science Data and Software Document revised: 9/29/2011
14 – Using the SAS Enterprise Guide (Version 4.2)