Working Group Reports and Supplemental Proceedings
ITiCSE'97
Using the WWW as the delivery mechanism for interactive, visualization-based instructional modules Report of the ITiCSE’97 Working Group on Visualization Thomas Naps (chair) Lawrence University, USA
Marta Patiño-Martínez
[email protected]
Universidad Politécnica de Madrid, Spain
Joseph Bergin
[email protected]
Pace University, USA
Viera K. Proulx
[email protected]
Northeastern University, USA
Ricardo Jiménez-Peris
[email protected]
Universidad Politécnica de Madrid, Spain
Jorma Tarhio
[email protected]
University of Joensuu, Finland
Myles F. McNally
[email protected]
Alma College, USA
[email protected] Abstract
1
Visualization has long been an important pedagogical tool in CS education. The widespread use of the Web and the introduction of Java, with its ability to present interactive animated applets and other types of animation, all provide opportunities to expand the availability of visualization-based teaching and learning tools. In addition, the Web introduces new opportunities not available in traditional settings.
Visualization in general, visualization delivered over the Web, and the nature of the Web itself all support many different learning objectives. Like many other visualization and graphics-display systems, Web-based systems can provide support for learning concepts, understanding techniques, and learning programming and problem-solving skills. However, the Web also creates new opportunities by providing a medium where students can become actively engaged in creative processes and research.
We start by identifying the types of learning objectives that can be supported by visualizations and the Web environment. Next we look at specific areas where the use of the Web enhances learning beyond the usual visualization, as well as at new learning and teaching paradigms supported by the Web. We then discuss a number of different mechanisms that can be used to deliver visualizations over the Web and new ways of managing displays in the Web-based environment. We point out both advantages and disadvantages of using the Web. A look into the future follows. We consider what changes and improvements we can expect and what specific activities we would like the CS community to undertake. We end with a brief survey of currently available Web-based visualization teaching tools and a commitment to maintain a list of links to these and other sites.
Desired outcomes
We briefly summarize the types of learning objectives supported both by classic visualizations and graphics and by visualizations and graphics used in the Web setting.
Permission to make digital/hard copy of part or all of this work for personal or classroom use is granted without fee provided that copies are not made or distributed for profit or commercial advantage, the copyright notice, the title of the publication, and its date appear, and notice is given that copying is by permission of ACM, Inc. To copy otherwise, to republish, to post on servers, or to redistribute to lists, requires prior specific permission and/or a fee. ITiCSE'97 Working Group Reports and Supplemental Proceedings © 1997 ACM 1-58113-012-0/97/0010 …$3.50
13
•
Understanding an algorithm as a recipe. Visualization of an algorithm can be presented in a lecture and can also be available for students to explore on their own. By watching the animation, students can deduce the steps the algorithm takes and the decisions that are made, and they can describe the process or predict future steps. An early example of such animation was the film Sorting Out Sorting; many others have come since, ranging from prepackaged modules to highly interactive systems.
•
Developing code for the algorithm. Often students understand the algorithm and can predict next steps, but have a difficult time extending their understanding to develop another algorithm and implement it as a program. Visualizations combined with annotations that explicitly describe the data structure changes or other highlights of the algorithm’s progress, as well as visualizations that display the code concurrently with corresponding changes in data structures, often help in bridging this gap.
Working Group Reports and Supplemental Proceedings •
•
•
Exploration, experimentation, and reasoning about algorithms and programs. Students may work with animations that provide the user with options to select a range of input parameters, including input data and viewer controls. This creates an environment where a student can ask questions, observe patterns, and look for special cases. By exploring a number of different cases, students can study the computational complexity of a particular algorithm, compare the complexity of several algorithms that solve the same problem, or learn how to prove correctness of a given algorithm. In addition, students learn the value of learning through discovery and experimentation — a very powerful lesson.
between students with different schedules, possibly in different locations, becomes possible.
Writing correct programs. Creating visual displays as part of a programming assignment may be a powerful motivator for students learning to program. The animation may be the end requirement of the programming assignment or animation of a data structure may be an incidental part of the program goals. Many students get excited, take pride in their product, and care more about the correctness of their program and the overall look of the final product when animation is part of the product. Debugging. By having visual displays incorporated into a program, students can often detect errors, observe problems with their solutions and speed up the debugging process. Similar results can be obtained from systems that automatically animate the behavior of some of the data structures or even display in parallel the code and the corresponding changes to the data. Observing the result of their mistakes represented as a graphic display gives students another view into the nature and source of the problem.
•
•
Searching and research. The Web is a vast open space filled with an enormous amount of information — not all of it good or useful. Students using Web exploration to research specific problems learn not only basic search techniques, but also the fundamentals of doing research: reading, evaluating the collected material, selecting relevant information, and using it as a foundation for their own work. For example, students can search the Web to locate visualizations of a particular graph algorithm, examine them, and critique their educational quality. Besides gaining a deeper understanding of the particular algorithm, they also practice basic research skills and critical thinking. These skills, which are necessary to becoming a self-directed learner, are most valuable for students who will work in the rapidly changing computer science world.
•
Creation of student presentations. One of the key requirements in the workplace today is the ability to communicate one’s ideas to clients, colleagues, superiors, and others. Students take great pride in creating work that will be seen not only by their instructor, but also by their peers or even the whole world. Web authoring with multimedia capabilities makes creation of complex multimedia documents easily accessible and at the same time available for review by a wide audience. Students creating a Web-based presentation not only improve their presentation skills, but also learn basic research skills and gain a better understanding of the topic they are presenting.
2
Engaging the student with Web-based visualization
Visualizations and visualization systems are used in many ways in the delivery of instruction. In this section we examine ways in which visualization can be used to engage the student and we comment on their relation to Web-based delivery. In the next section we continue this discussion with a more formal taxonomy.
Next we define some learning objectives that are particularly well supported in a Web-based environment and give examples of actual uses. •
ITiCSE'97
In-depth understanding and creativity. Program-generated visual representation of a process provides a student with another view of an algorithm or data structure manipulation. In addition, the act of producing the visual representation requires a deep understanding of the processes. The interface for creating such visualizations can be at quite a high level, perhaps tailored for the particular assignment; or it can be based on a general algorithm visualization system. More advanced students benefit from creating their own visual representation of their program, be it a game, an algorithm, or a simulation. Java support for graphics and interactive controls makes this possible. When creating the visualization, students have to think about the key steps and their effect on the data, and must design a way to represent these changes. By reflecting on the nature of the algorithm, students get more involved and gain a better understanding of the process their program is animating.
One way to categorize these methods is the degree to which they actively engage the user. At the most passive end of the scale are view-only systems, which demonstrate one or more concepts with no interactive control. Such demonstrations are often useful when first introducing a concept or algorithm in a classroom setting or as a part of electronic text. Much like when watching a video, the viewer has no control over the presentation. In the classroom setting the instructor provides a context for the visualization. When delivered over the Web the context can be provided by the surrounding HTML-based content. The Web’s ability to deliver multimedia allows for (relatively) easy creation of such electronic documents and has led to a rapid proliferation of visualizations available over the Internet. Most visualizations allow some degree of interaction, if nothing more than being able to control the speed of an animation or deciding when a basic operation is to be visualized. As such, interactive controls and a more complex event-driven design are required. With the use of CGI-based forms or the Java Abstract Window Toolkit (AWT) components, a great deal of interactivity can be incorporated into a Web-based visualization. The level of interactivity
Communication and collaboration. The Web provides an environment where the communication is quite easy. Messages can be sent to one recipient or to a group, can contain a number of different documents, and can be posted in a publicly accessible place. This provides support for collaboration, sharing ideas, asking questions, comparing solutions, and discussing alternatives. Collaboration
14
Working Group Reports and Supplemental Proceedings possible in a particular visualization is determined by its designer, but the degree to which interactive possibilities are exploited by the user depends on the ease of interactive use, the interest and skill level of the user, and the degree to which the instructor provides a structure for the use of the visualization.
problem. Students may read an image file and process the image data, creating new images [1]. (See also http://lml.ls.fi.upm.es/epd/epd.html, in Spanish). The Web extends the opportunities for these types of projects by providing access to a large collection of different types of images — from NASA and other scientific sites (maps, weather data) to photographs and art from the world’s museums.
Students learn better by doing rather than watching. When teaching a data structure or algorithm, a common approach is to reinforce conceptual knowledge by asking the student to do some actual programming, to implement the concept under discussion in a high-level language. A natural extension of this is to have the students themselves generate a visualization of the concept. This can be done in a number of different ways.
Typical programming taught in introductory computer science courses can be described as a single-thread-of-control problemsolving view of the role of the computer program: computation as calculation. By using Java with its support for both graphics and for multi-threaded operations, it is possible to replace this model “with a model of computer programs as simultaneous ongoing entities embedded in and interacting with a dynamic environment: computation as interaction; computation as it occurs in spreadsheets and video games, web applications and robots” [11].
A first possibility is to extend the programming language to be used so that the visualization is a pure side-effect of the implementation. For example, Java classes can be extended and methods overridden so that graphical displays are automatically generated during the execution of a program. This approach has been taken by Haajanen, et. al., in the Jeliot system [3]. Students need learn nothing new (or at least very little) in order to create the visualization and can concentrate on understanding the concept, rather than on the details of a visualization system or the design of an effective visualization.
The Web allows new possibilities for student engagement with visualizations. For example, students can be asked to search the Web for visualizations of a particular concept and compare and contrast their pedagogical effectiveness. This requires that students consider what the essential nature of an algorithm is and how that nature can be effectively illustrated.
However, allowing the student to design the nature of the visualization itself forces thought about the nature of the concept and its essential characteristics. Such assignments force the student to come full circle: from the concept to its implementation and back again to the concept. But there is a cost. Students must learn to use some method for creating these visualizations. We suggest three possibilities: (i)
A second possibility is to have students publish an electronic book on a particular topic, complete with both discussion and visualization of the topic under consideration. This makes a particularly effective project for individuals or groups. Webbased development reduces the costs of collaboration because of the ease of sharing and viewing files and, as noted above, motivates students because of the possibilities of wider dissemination of their work
Using graphics and AWT component primitives in a programming language like Java (the hardest to learn and use, but most flexible).
(ii)
Using a visualization system like John Stasko’s XTango [9], which has been ported to Java by Steve Hartley (see http://www.mcs.drexel.edu:80/~shartley), or Susan Rodger’s JAWAA (see http://www.cs.duke.edu/ ~rodger), each of which provide higher level animation primitives (medium level difficulty with some overhead to learn but more powerful animation primitives).
(iii)
Using systems of primitives specially designed for the creation of particular visualizations, such as a set of primitives for displaying binary trees (easiest to use in generating visualizations but the least flexible). Such an approach is easy to implement in Java.
ITiCSE'97
3
Taxonomy of Web visualization delivery mechanisms
Visualizations can be delivered to the user in many ways over the Web. There are issues as to who creates the visualization and when the visualization is created, and as to the role of the end user in creating and/or interacting with the visualization. The user can be totally passive or extremely active in creating and guiding the development and progress of the visualization. Different tools may be used to create and to present the visualization. Traditional tools may be employed with the results presented with a Web wrapper such as Adobe PDF files, or Web-specific tools may be used.
3 . 1 Hypertext (HTML) Most presentation systems will use HTML and related systems (e.g. VRML) to package the visualizations and present them to the user. HTML is probably the best known of these as it is the standard Web page markup language. Students creating visualizations will need either the rudiments of the language or WYSIWYG HTML editors. Current Web browsers have convenient HTML editors integrated into them. Instructors can provide sample HTML documents so that students will have examples of the typical syntax. On-line tutorials can be used to teach students the rudiments of the language quickly. There are also translators to and from HTML source, such as rtftohtml, which can be used to translate Microsoft Word documents conveniently into HTML. latex2html is a similar tool for LaTex and wp2html for WordPerfect (look at http://www.kt.tu-
The clear advantage of approach (i) is that it allows the broadest range of creative possibilities. However the amount of time that students need to construct such visualizations is considerable relative to approaches (ii) and (iii), even when Java is the language employed. In any case, being able to deliver the resulting visualizations on the Web, perhaps in class-wide collections, usually strongly motivates students to do very good work. Another way to engage students is to make a visualization an integral part of their program. Rather than animating a programming concept, the graphic image is at the center of the
15
Working Group Reports and Supplemental Proceedings cottbus.de/info/word2html.html for a comprehensive list of links to this kind of tool). Current versions of most word processors allow HTML as an output format without need for conversion.
ITiCSE'97
TextArea, for example.
3.2.3 Helper functions and plug-ins The visualization system can be a Netscape plug-in, for example, or a helper function known to the browser. The helper or plug-in is then retrieved once from the Web and the Web can be used to deliver information to it. There are fewer security restrictions imposed by the system in this case, but the source of the helper must be trustworthy.
CGI forms and Java applets embedded in HTML documents can be used for user input. VRML can be used to show animations and provide two- and three-dimensional views of outputs. Another way to generate applets is to use AdaMagic, which generates applets from Ada95 programs. (It can be found at http://www.intermetrics.com.)
3.2.4 Native code It is also possible to deliver native applications via the Web either in source or compiled form, though the latter limits portability. If source is delivered, then the user must possess some specific software system, either a compiler in the case of something like C++ code or an application such as Excel. If compiled versions are distributed, the user may need specific hardware as well.
3 . 2 Remote computation vs. local computation Visualizations can be delivered to the user in a variety of ways. In addition, the necessary computations can be done on the client side or the server side or can be shared by both. Different client/server architectures result depending on where the computation is done.
3.2.5 Remote-run visualizations 3.2.1 Local-run visualizations
The power of the server can be used to do the computations in a remote-run visualization system. In this kind of system the Web client receives commands from the user via a fill-in form and sends them to the server, the server communicates with the remote visualization system using the CGI interface and then it generates and delivers to the client a Web page with the next frame of the visualization. Remote-run visualizations are illustrated in Figure 2.
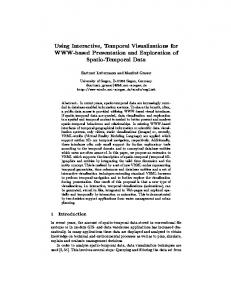
In this architecture the whole visualization system runs on the client side. The visualization is selected via a Web page, and it is delivered by the Web server to the Web browser. It can then be viewed on the client node. There are two possibilities for this approach: the Web browser can act as viewer (if the animation is an applet or is written in Java script or Java) or a helper application can be used as the viewer (as would be the case for an Excel or a Quicktime animation). On the other hand, if the visualization system is not in the client node it can be downloaded the first time. Local-run visualization is pictured in Figure 1.
3.2.2 Applets Visualizations can be run entirely within applets served off the net. The security model of Java makes user inputs problematic as file I/O cannot be used. The latest version of Java permits relaxed security for trusted signed applets, so this restriction may be relaxed somewhat. ActiveX, with a weaker security model, provides more flexibility, of course. Even with the secure Java model, however, much can be done through the interface elements. Inputs can be provided by the user in a
CGI interface
Web Server
Visualization System
User command
Web Browser
Visualization frame
Remote Server
Client Server
User Commands Visualization Selection Web Server Visualization
Figure 2. Remote-run visualization
3.2.6 Distributed-run visualizations
Web Browser
In a mixed approach, the visualization system is split between the client and the server. A possible (and natural) division is to run the model on the server side with the viewer on the local side. The communication server and client can be made using the socket library of Java.
Visualization
Visualization Repository
3 . 3 Architectures for delivery 3.3.1 Model-view architecture
Remote Server
A user-centered (event-driven) application can be divided into two kinds of classes: a model, implementing basic functionality, and one or more views, implementing the “look and feel” of the application. The view incorporates both visual elements of the user interface and control mechanisms for the
Client Server
Figure 1. Local-run visualization (browser acts as viewer)
16
Working Group Reports and Supplemental Proceedings
ITiCSE'97
keeps a list of all registered views. A view can also de-register if appropriate. update
When a model changes, either because of internal computations or because an external agent has called one of its setter methods, it sets its own member variable “changed” to true and executes its method notifyObservers. This latter function sends the notify message to all registered views with a reference to the changed model and an additional reference parameter that can be an object of any type.
View
Model register
register When a view gets the notify object, it can use the passed object to decide what to do. It usually polls the model (calls getter methods of the model), to determine if information important to the view has changed. If so, it updates the display as appropriate. A view can also query the model as to whether it has changed by sending it the hasChanged message. If true is returned, the view can query for values and update itself as needed.
View
Figure 3. Illustration of model-view architecture application. Originally this was called model-view-controller (MVC), and there were three elements, but in this simplified arrangement, the original view and controller have been combined. MVC was originally a basic design paradigm in Smalltalk. It is discussed extensively in the Smalltalk literature; see, for example, [6]. An illustration of model-view architecture is given in Figure 3.
User control is achieved when the user manipulates one of the control components of the view. This component sends messages to the model (setter methods), that cause the model to update and start the notify process in motion. Notice that several views can be kept synchronized with this mechanism. It is also relatively easy to add new views to an application, since the underlying model generally does not need to be modified to do so. It is also somewhat easier to update the model for new functionality, since the interface and the functionality are kept separate.
As an example, in a heapsort visualization built with the model-view methodology, the model would consist of the algorithm itself and some suitable representation of the data. It would be necessary, perhaps, to implement the algorithm so that it can be run incrementally (stepped). There is no visual or control mechanism. However, the class implementing the model provides getter and setter methods for all important model parameters (variables). Getter methods get information from an object (usually just the values of instance variables) but, more generally, any pertinent information. Setter methods give information to the object, often just new values for the instance variables.
More than anything, however, the model-view paradigm is just a way of thinking about user-centered software that gets us to clearly separate interface elements from functionality elements. It doesn’t depend on a framework, for the necessary elements can be quite easily built in C or other languages. It leads to enhanced portability (of the model part at least) because system-specific user interface elements are not mingled with the basic functionality.
To continue the example, a view in the heapsort visualization might be a balanced binary tree view of the heap together with some stepping controls and a fill-in form for entering data into the heap. Another view might be the typical array view of the heap. Here the controls might permit direct entry of the data into the array. The different views might be visible simultaneously in different frames or alternately visible, as appropriate to the application. The views can run in separate threads if needed.
In Java you can actually think of a model as a collection of observables rather than a single one. This can give you finergrained control over your application. Each observable in a model can then have its own observers. Each value in a heap could be an observable with its own views. Since Java is a single inheritance language (of classes, anyway), it is a bit of a restriction that models must inherit from the Observable class. The trade-off, however, is that all of the scaffolding of registering observers and notifying them is handled by the Observable superclass and doesn’t need to be implemented for each model.
In Java, a model (or part of a model) is a class that extends the Observable class. A number of the methods will be discussed below. A view is a class that implements the Observer interface. As such it must implement the update method:
The above is discussed briefly in [2] and more extensively in [12].
public void update(Observable O, Object arg);
3.3.2 Other architectures
This method will be called by a model object whenever the model changes as discussed below.
Other architectures could also be discussed in terms of the underlying model and the various views that might be used to show progress and results of a visualization.
The way that this system works is as follows. The programmer creates a model and at least one view. The model object is constructed first and then the views. Each view “registers” with the model by sending it the addObserver message. The model
The model must communicate with the viewer in order to display the different steps of an algorithm. This interaction can vary from loosely coupled to highly coupled. The looser the
17
Working Group Reports and Supplemental Proceedings coupling the easier will be its reuse. The communication coupling can be classified as follows: •
Loosely coupled communication. The model is run, generating a trace file (a file of view commands, for instance a VRML file or a SAMBA file). The viewer can be run at any time by just using the trace file. Components in this category are totally reusable.
•
Medium coupled communication. Model and Viewer use a common communication system, but are different programs. If the communication system is a network, they can be located in different nodes. Some examples of this kind of communication are pipe communication, socket communication, or a higher level one as CORBA. Components of this kind are less reusable as they can be reused only if the same communication system is used.
•
•
Previously prepared non-interactive visualizations. The role of the student is passive as she just sits and watches the visualization, she is just a spectator. This kind of role can be adequate for showing examples in lectures and/or electronic books and notes. There is a rather high ratio of creation effort to usability in this type of visualization. It can take a few hours of development effort for a few minutes of use within a course. Such visualizations can be very useful to students, but the development effort should not be underestimated. The ability to publish these materials on the Web helps to amortize this cost over the potential for use.
•
Previously prepared interactive visualizations. Here, the student must interact with the visualization, he cannot just watch. There are different interactions the user can have with the visualization, the simplest one is to control the progress and detail of the visualization. A more involved interaction is to input data to the algorithm. Another kind of interaction is to customize visualization parameters. Interactive ready-made visualizations can also be used in electronic books for at least two goals: to let the student experiment with the algorithm and to ask questions of the student. For instance: “Determine an input value that exercises a certain branch of the algorithm”.
•
Visualizations automatically generated from the student’s program/algorithm. The role of the student is fairly active as she must write a program/algorithm. The student visualizes the algorithm by just running it, without any effort in creating the visualization itself. These visualizations can be useful for the lecturer as they are easily created. From the student point of view the visualization can be used as a debugging tool that helps them to understand the insights of the algorithm as well as to debug it. There are many ways to achieve automatic visualizations, for instance: a preprocessor that extends the program with visualization commands, the student uses data structures that visualize themselves, the program is run using a visual debugger, etc.
•
Student-created visualizations. This is the most involved role, as the student has to write the algorithm and its visualization. The degree of involvement depends on the kind of primitives used to create the visualization. The primitives can be low-level graphical primitives such as lines and circles (this implies a lot of work) or they can be high-level problem-specific (perhaps created by the lecturer) so visualizations can be created more easily. Another possibility is to provide the student with an algorithm with visualization commands annotated and let the student modify it in some way. This role can be a motivator for the student (as he creates fancy visualizations and he does not just write “boring” programs). This approach has the danger of distracting the student from the important topic (make a program) as he can waste time with unimportant graphical aspects (a nice picture, ...). The level of the primitives is also important to allow the student to concentrate on the important aspects of the assignment. Low-level primitives are not adequate as the quantity of work to be done by the student to make the visualization is quite high. On the other hand, medium- and high-level primitives are more suitable for this task as they minimize the work to be done to make the visualization.
Highly coupled communication. The model and the viewer are part of the same program and they interact via procedure calls. This class is the least reusable of all, since to reuse components in this class one is forced to write in a particular language and to compile one’s new component along with the reused component.
Another issue in the interaction between model and viewer is the level of the primitives used in the communication between the model and the view. This depends on the nature of the viewer. If the viewer is very generic, the primitives will be very low level and if it is problem-specific the primitives will be of higher level. The level of the primitives in animations that are not automatically created will affect the degree of involvement of the student with animations, as will be discussed in the next section. The level of the primitives can be classified as follows: •
Graphical primitives (low-level). These primitives are fairly general graphical primitives, so there is a lot of work to be done to create an animation. For this reason they can be adequate for building animation systems but not for animations.
•
Animation primitives (medium level). This kind of primitives are oriented to draw simple graphics and animate them (usually in a smooth way). They usually offer primitives to group drawings and identify the group with a name, easing the task of moving complex objects.
•
Application-specific primitives (high level). These primitives allow easy development of an animation without spending much effort. Being quite specific is an advantage but also a disadvantage as a different application usually requires a new specific set of primitives.
Another important feature of an animation system is platform independence to ensure the widest possible use. While this has always been an important goal, it becomes more important in Web-based environments.
3 . 4 Role of the student The way visualization is created affects the role of the student. The role of students with respect to visualizations can vary from a passive one to a very involved one. In increasing order of involvement they are:
18
ITiCSE'97
Working Group Reports and Supplemental Proceedings High-level application-specific primitives are well suited for debugging programs, while animation (medium-level) primitives give more freedom to the creativity of the student. The latter approach is a better motivator, although it is more time consuming.
Remote accessibility to visualizations over the Web also allows their use for distance learning. Students can reproduce the contents of a lecture any time it is needed, showing the dynamic behavior of topics presented in the classroom using visualizations. Without leaving their home or dorm room, students can now “plug into” visualizations that provide them with an abundant supply of visually stimulating examples to reinforce concepts to which they have been introduced in the classroom. For example, a student who is studying and having trouble understanding Dijkstra’s shortest path algorithm can continue to rerun visual traces of the algorithm on different data sets until understanding is finally achieved. As another example, real-time video provides the necessary framework for remote lectures.
3 . 5 Other mechanisms A number of additional tools can be effectively used in the creation and delivery of visualizations and animations. •
Animated gif files can be used to animate simple concepts.
•
Quicktime movies can be prepared using proprietary software and achieve very sophisticated results, though at the cost of a higher learning curve.
•
Java Generic Library (JGL) provides a good basis for the development of data structures, though it has no visualization primitives. It should be possible to extend the library to provide at least simple visualizations of the structures.
•
Java has some additional features that make visualizations easier to prepare. These include the platform-independent GUI and the thread interface, making sophisticated animations relatively easy to do. Remote method invocation and object serialization in the latest version of Java (v. 1.1) permit sophisticated distributed computation architectures to be employed.
4
ITiCSE'97
Web tools allow the development of system-independent applications. This feature makes Web-based visualizations available to users with any kind of system or platform. With the advent of Web-based visualizations, no installations are required, hence making visualizations available also to those who otherwise would not bother with them. This property is what makes remote accessibility really useful, as without system independence a user could access a visualization, but would be unable to run it without the adequate platform. The best examples of this system-independence are visualizations written in Java. For example, prior to the Web, running visualizations of algorithms often required a fairly elaborate installation procedure on each system where the visualization was to be run. Students were loathe to install such visualization-based learning tools on their own computers because the installation time involved was often not viewed as providing an adequate payback. The same rationale was often used by instructors who hesitated to install visualization software on institutional lab computers. With the advent of Web-based visualizations, no installations are required and trying out the visualization is merely a mouse click away.
Advantages and disadvantages of the Web
Next we will consider the impact of using the Web as a delivery system for visualizations.
4 . 1 Advantages The Web fosters collaboration and communication among students by, for example, integrated email and discussion groups (newsgroups). With the emergence of collaborative learning environments over the web the collaboration and communication are highly increased, particularly in distance learning where students cannot meet face-to-face or do it rarely. As an example of various configurations for Web-based collaboration, a group of students or researchers can share the same visualization over the Web and discuss it on-line by phone.
The advantages of delivering visualizations on the Web are numerous. Clearly the ease of accessing Web sites from remote locations will enable us as educators to share materials and leverage off each other’s work in a way not before imaginable. For our students, the ease with which Web-based visualizations may be accessed encourages their use. Remote accessibility to materials on the Web allows quick access to information and increases sharing and exchange of information. For developers of Web-based visualizations, this means that the enormous amount of time spent in constructing an effective visualization can be amortized over a greater number of students. No longer are the viewers of an instructorcreated visualization limited to the students in her class. Visualizations served on the Web are immediately available to students and educators everywhere. Whereas the ratio of amount of time spent to number of students helped by a visualization may have once been quite high, serving your visualizations on the Web will dramatically lower that ratio. Moreover, increased author recognition will hopefully be a byproduct of such effective and widely disseminated visualizations. Will this encourage more educators to develop visualizations? To answer that question, one need only look at the growth already evident in the number of Web-based visualization tools that are available (see Section 6).
Web pages are real interactive multimedia hypertext documents. They allow designers to combine static text, graphics and images, animations, video, audio, etc. By doing this, we create electronic books, which students can consult from anywhere. These electronic books not only contain static text, graphics and images, but also dynamic material such as video, audio and visualizations that allow dynamic explanations of concepts that otherwise would be difficult to present. The interactivity supports evaluation tests with autocorrection (see http://www.niksula.cs.hut.fi/~tik76122 /index-eng.html). It also allows the creation of material where the student can experiment with interacting with visualizations, so he can improve his understanding of the topic. The hypertext allows the building of indexes as well as hyperlinks to related materials in the same document or in other sites, thus providing a “hyper-encyclopedia.” Prior to
19
Working Group Reports and Supplemental Proceedings Web-based visualizations, it was very difficult to have a visualization accompanied by appropriate explanatory materials. Although most algorithm visualization systems offered some means of attaching a caption to a picture, these captions were typically brief and served more as a means of highlighting what was happening in the picture instead of offering a detailed explanation of the actions depicted by the visualization. The use of links allows a different learning style, based on search of information on the same topic, encouraging critical evaluation and research abilities, as well as motivating independent learning skills. Moreover, students are no longer limited to viewing only those demonstrations that are done in the style of their own instructor. By exploring the Web, many differently styled visualizations of the same concept may often be found. The student can focus on those visualizations that best reinforce the concept for him.
ITiCSE'97
be independent learners who pursue understanding in depth instead of merely learning what is needed to pass an objective test.
4 . 2 Disadvantages Poor performance is a common problem with the Web. Loading times of large visualizations may be irritatingly long and, in a slow client machine, presenting animation might be impossible in practice. Visualizations under Web browsers require more computing resources than stand-alone applications. One reason for that is the architecture of applets. Communication reliability is problematic as is link obsolescence. A link or host may be down or the network may be overloaded. Moreover, the life span and future contents of most pages are unpredictable. One can never count on being able to access a certain page in the same condition again at a specific time.
Web-based visualizations are not just nice pictures, where students play a passive role like watching TV. Students can now play an active role in visualizations. Student participation can range from activities where she controls the progress of the visualization or inputs data, to those where she constructs her own visualizations. In independent studies, John Stasko [10] and Lahtinen, et.al. [5], have noted that one of the factors that has kept students from learning as much as we would like from algorithm visualizations is that students merely watch the visualizations in a very passive mode. Consequently, students often watched the visualization as they would television — impressive graphics but little or no understanding of what was happening. The hypertext abilities of the Web and HTML change all of this dramatically. Now we can link an algorithm’s visualization to synchronized text in HTML frames. In the resulting electronic book, students can maneuver at their own pace and according to their individual abilities. Those students who are more visual in their thinking can more frequently launch appropriate visualizations from the textual material. The interaction between students, textual materials, visualization, and perhaps even Web-delivered audio make the student an active participant in the learning process instead of a passive viewer. Anecdotal evidence offered by Stasko [8] and Proulx [7] indicate that algorithms are understood at their deepest level when the student herself becomes the creator of the algorithm’s visualization.
Testing of Web-based visualizations can be a nightmare. There are too many platforms and browsers with various plug-ins and user preferences. Moreover, the fast development of the technology may also cause problems: we do not know whether all the current implementation techniques of visualizations are supported in future versions of browsers. One can never be sure if the visualization works everywhere it should. The lack of reward structure for authors does not presently encourage us to create sophisticated visualizations for the Web. The motivation for making high-quality material for free is lower than if one gets some profit. Also tenure and evaluation committees are often unwilling to reward this kind of work. When creating or running a Web-based visualization, one sometimes encounters difficulties related to security control (for instance, ActiveX). Some essential services, like the execution of Java code or CGI programs, may be temporarily disabled because of detected security problems. A strict system manager can forbid using some advanced features of the Web. There are also many other disadvantages. Generally, it is tougher to build interactive control in a Web-based visualization than in a stand-alone application. Published solutions on student assignments available on the Web could possibly encourage cheating.
Interactive visualizations, the possibility of development of new visualizations, the ease of searching and finding related topics together over different links can be highly motivational. For example, visualizations served off the Web offer a natural opportunity to engage the creative talents of our students. Visualization systems and methods that allow students to construct their own visualization offer an ideal means for us to have students do projects in which the student himself becomes the author and, thereby, the teacher of other students. For example, assigning projects in which each student is responsible for developing a Web-based module, accompanied by visualizations, for a particular algorithm turns the student into the class expert on that algorithm. Students are excited about working on such projects for a variety of reasons, for example, the “sexiness” of the Web as a development platform and the student’s perception that his work is being “published” on a medium where it will be of value to others. Using Web-based visualizations in this fashion takes advantage of the collaboration and communication opportunities offered by the Web, encouraging our students to
5
Future evolution of Web
In this section, we consider the evolution of the Web in the future and how it will affect visualization delivery
20
•
Level of sophistication of visualization will increase. As the bandwidth and other resources of the WWW increase, educators will find it possible to create increasingly sophisticated visualizations, taking advantage of the resources. While speed-up of execution can be expected for the visualizations created today, the increased resources are likely to be quickly saturated with new uses. Threedimensional and real-time visualizations are difficult to achieve in today’s environment, but will be the norm in the fairly near term.
•
More visualizations written in Java. We expect that the current enthusiasm for Java is not a passing fad, but that the advantages of the language will lead educators to port
Working Group Reports and Supplemental Proceedings existing visualization software to Java and to increasingly choose Java as the language of choice for visualizations— especially visualizations intended for web delivery. Among the advantages of Java are the platform-independent graphics model and the multi-threaded and object-oriented nature of the language. •
•
•
•
ITiCSE'97
There are advantages to the library developer to port libraries to Java and other Web-enabled languages. Java in particular seems to be becoming ubiquitous and so Java libraries will have wide audience and wide applicability. It is unlikely that a single library will serve all needs, so the opportunity exists for those with experience in a specific domain to have an impact on the state of the art. We encourage this, but recommend that such work be undertaken collaboratively and publicly so as to minimize redundancy and achieve a uniformity of terminology and programming style.
Will other languages be able to deliver Web applets? While Ada can currently be used to deliver Web applets, it is questionable whether other languages can be used effectively and securely to do so. The Java Virtual Machine, in particular, is not well suited as a target for C and C++ program translation. This is due to the strength of the security model, which is essential to ensure users that no harm will come to them from executing found software on the client side. There are fewer issues, of course, with server-side computation.
6
Survey of some available sites
Although it is not our intent to provide a comprehensive survey of links to algorithm visualization Web sites in this paper, we can provide some Web-based examples of the approaches that we have been discussing. These approaches include (1) non-interactive visualizations hyperlinked into HTML documents, (2) interactive visualizations running on client-specific software, (3) interactive visualizations using CGI scripts, (4) interactive visualizations running from Java applets, and (5) complete visualization systems. We emphasize that this list does not pretend to be exhaustive, nor do we intend to evaluate such systems here. The working group does commit itself, after the current conference, to constructing and maintaining a more comprehensive listing of Web-based algorithm visualization sites. This comprehensive survey will be maintained at http://sol.pace.edu/webvis.
Dramatically increased availability of materials. The ease of publishing educational materials on the Web changes the way we think about instruction. The platform independence of Java ensures that materials developed by one professor will be usable by others. This is a large change from the Tower of Babel situation that has been a limiting constraint in the past. Students are especially sophisticated in Web searching for materials that apply to their course work. This has both good and bad aspects, however. While we should (must) encourage our students to take advantage of existing work and not recreate it, there are also increased opportunities for plagiarism and improper collaboration among students at different institutions. Realizing this, educators must change their expectations about what are proper student activities.
6 . 1 Non-interactive visualizations Non-interactive visualizations hyperlinked into HTML documents is a technique that essentially amounts to an on-line version of a traditional textbook with the advantage of being able to incorporate hypertext links to other Web sites. Since it does not take advantage of the dynamic nature of algorithm visualization, it is no doubt the technique of least interest to us in our deliberations. Nonetheless, there are some excellent sources of material that can help students understand difficult concepts.
Easier pooling of resources and enhanced collaboration among creators of visualizations. Web communication facilities make it relatively easy for educators and other developers to share tools and libraries. Even simple tools like Telnet, FTP, and HTML make communication and collaboration easy with null turn-around times on new versions of documents. The general availability of such tools should tend to increase the opportunities for interinstitutional and international collaboration. Central repositories such as that maintained by SIGCSE (see http://www.tcnj.edu/~compsci/) can be very helpful, not only as a place to find resources, but also as a source of collaborators with similar interests. See also the collaboration repository at http://www.sbu.ac.uk/ opencore/acm .
For example, Thomas Niemann of Santa Cruz, California has authored a very nice explanation of various sorting algorithms. This explanation includes very understandable discussions of the efficiencies of the algorithms and is accompanied by a large collection of detailed figures. Niemann’s work can be found at http://www.geocities.com/SoHo/2167/book.html. José C. Castillo, Mourad Fahim, and L˙cio C. Tinoco of Virginia Tech have created a presentation of operations on binary tree structures that includes a variety of static visualizations created by Macromedia Director 4.0. This presentation includes textual definitions of the operations, pseudo-code versions of key algorithms, and visualizations that are linked to relevant portions of the pseudo-code. Their work may be viewed at http://wasabi.cs.vt.edu/~josec/sciviz/.
Libraries, particularly in Java. There is currently rapid development on the Web of libraries tailored to specific subject domains. The Java Generic Library (JGL), for example, is an excellent example of a well defined and documented data structures and algorithms library. One can only hope that the Java AWT, while somewhat volatile recently, has settled into a stable form. Libraries for visualization are a distinct possibility. A visualization library extending and tied to the JGL would be very useful. Animation libraries are likely to arrive soon — some by large software vendors such as Macromedia, though these may or may not be applicable to algorithm visualization.
6 . 2 Interactive visualizations with clientspecific software There are several approaches to providing interactive visualizations. The first is to do the visualizations running on client-specific software. Harriet Fell, Viera Proulx, and Richard Rasala of Northeastern University have prepared a variety of Mac-specific visualizations for CS1 and for algorithms and data structures courses. These visualizatiosn may be downloaded
21
Working Group Reports and Supplemental Proceedings from http://www.ccs.neu.edu/teaching. Once downloaded, the visualizations are interactive but require Macintoshspecific software to run.
ITiCSE'97
a variety of controls. Hausner’s work may be viewed at http://www.cs.princeton.edu/~ah/alg_anim/ index.html. Susan Rodger of Duke University has authored several Java visualizations of parsing algorithms. FLAP is a package of graphical tools which can be used as an aid in learning the basic concepts of formal languages and automata theory. Pâté is a program (unfortunately written as a Java application instead of a Web applet) which transforms context-free grammars and parses restricted and unrestricted grammars. PumpLemma is a tool for experimenting with the Pumping Lemma for regular languages and context-free languages. These are accessed via her home page at http://www.cs.duke.edu/~rodger.
Marta Patiño-Martínez and Ricardo Jiménez-Peris at Universidad Politécnica de Madrid have a set of visualizations on recursion and operations on linked lists created with Macromedia Authorware. They animate particular algorithms showing the source of different subprogram calls in different windows as well as a visualization of the state of dynamic memory. The visualizations provide a menu to select different data sets. A web page with these animations can be found at http://lml.ls.fi.upm.es/VisualGroup/Animations.html. Another approach to the distribution of interactive, clientspecific visualizations is taken at the site http://SunSITE.univie.ac.at/Spreadsite/. Available here are a variety of scientific animations that require Excel spreadsheet software. If the client has Excel, the client system’s browser may be configured to immediately launch the Excel-based animation when the corresponding spreadsheet is downloaded.
Michiel van de Panne of the University of Toronto has a marvelous collection of Java applets to illustrate concepts in computer graphics. Among the graphics algorithms for which van de Panne has developed applets are: 3D Translations and rotations; an interactive tutorial on cross-products; interactive illustration of L-systems; graphics tutorials on transformations, projections, curves, and surfaces; and curve tutorial. The material may be accessed at http:// www.dgp.toronto.edu/people/van/courses/csc418/.
6 . 3 Interactive visualizations with CGI scripts Another approach to interactive visualizations is to use CGI scripts. In his Web page at http://www.cs.rpi.edu/projects/ STL/htdocs/node50.html, Ken Zalewski illustrates several sorting algorithms by having the Web surfer fill out an HTML form to provide input to the sorting algorithm and then providing a visualization of the algorithm in a window opened on the client machine. Here, the interaction with the viewer is very limited because of the form-based input involved.
Joe Bergin of Pace University has written a Java applet that provides animations of bubble, selection, and quick sorts with a variety of options for input generators. Bergin’s work is at http://csis.pace.edu/~bergin/Java/applets.htm.
6 . 5 Complete visualization systems with automatic creation Complete visualization systems with automatic creation form the visualizations in a completely automatic fashion, transparent to the program code that implements the algorithm. Many of these systems include a variety of examples and demonstrations.
6 . 4 Interactive visualizations with Java applets Interactive visualizations can also be done using Java applets. Glenn Rowe of University of Dundee provides a nice illustration of the quicksort algorithm accessed via http://orange.mcs.dundee.ac.uk:8080/CS202/tuts/mosaic/ sorting/QuickDemo/QuickSortDemo.html. Viewers are allowed to enter a small set of data and then watch the algorithm in continuous-play or one-step-at-a-time mode.
Rockford Ross’s Dynalab system provides a very complete program animation system for Pascal programs and also animations of programs written in subsets of Ada and C++. At the moment Ross only has a prototype of what the Web version of his system will look like. However, there is every indication that the entire Dynalab system will be ported to Java and the Web in the near future. Look at http:// www.cs.montana.edu/~dynalab for details and the current status of Ross’ project.
Yin-so Chen of the University of Washington has developed Java-based illustrations of five classic sorting algorithms. Although Chen’s illustrations only run for small sets of data, his views of the algorithms provide some very useful insights for beginning students. Chen’s applets with accompanying explanations of the algorithms may be found at http://gaigs.cmsc.lawrence.edu/animation/.
Ricardo Jiménez-Peris and Marta Patiño-Martínez of Universidad Politécnica de Madrid have a visual programming environment for Modula-2 programs that automatically visualizes recursion, dynamic memory, input/output, arrays, etc. It currently runs under DOS but they are adding a facility to generate traces that are interpreted by a Java applet, so a visualization of a particular run of a program can be introduced in a web page. A link to this project is http://lml.ls.fi.upm.es/ VisualGroup/VisMod.html. A similar project for functional programming languages is Visual Hipe [4] by Jiménez-Peris, Patiño-Martínez, Cristóbal Pareja-Flores, and Ángel Velázquez-Iturbide at the same university. In this environment the rewriting process uses a mixed textual/graphical notation, where structured values such as trees and lists are represented graphically while functions and other constructors are shown textually. There are DOS and MS-Windows versions and a
Students of Myles McNally at Alma College have created a variety of interesting algorithm animations in Java. These include animations of linked lists, searching, sorts, and queues. They may be accessed at http://charis.mcs.alma.edu. The animations are accompanied by hypertext descriptive materials and links to additional sites. Alejo Hausner of Princeton University has developed a collection of excellent animations of sorting and computational geometry algorithms. Many of these animations include three-dimensional views of the algorithms and all of them are driven by an interface that offers the viewer
22
Working Group Reports and Supplemental Proceedings similar trace facility similar to that described above is being added. This work is at http://lml.ls.fi.upm.es/VisualGroup /VisualHipe.html .
ITiCSE'97
John Stasko of Georgia Tech developed the XTango system to facilitate the animation of algorithms developed in Xwindows using the C programming language (see http://www .cc.gatech.edu/gvu/softviz/SoftViz.html). Steven Hartley of Drexel has recently ported a subset of XTango to Java. For documentation and sample illustrations, point your browser at http://www.mcs.drexel.edu:80/~shartley.
Jorma Tarhio’s Jeliot offers a Java programming environment with animation hooks automatically built into the system. Web viewers of Jeliot can enter a Java program, which Jeliot will interpret and execute. Moreover, if the program uses the visualized data types provided by Jeliot, animation of the program will be automatic because the animation operations are embedded (transparently to the Java programmer) in the operations of the data types. Tarhio encourages interested surfers to check out Jeliot at http://www.cs.helsinki.fi/ research/aaps/Jeliot.
John Stasko’s Samba system makes it possible to add animation to programs by simply adding to a program textual output statements in Samba’s scripting language. The Samba script reader then reads from this textual script to produce the animation. The advantage of Samba, as opposed to XTango, is that the animator of the algorithm does not have to understand a detailed set of graphics function calls. Consequently, Stasko maintains that animating an algorithm becomes easy enough for undergraduates to do in a data structures and algorithms course [8]. Stasko has a “beta” version of Samba in Java available to test at his Web site http://www.cc. gatech.edu/gvu/softviz/SoftViz.html. One of the current drawbacks of the Java version of Samba is that the scripting commands for Samba in Java must be fed to the system in a Java text window because the security restrictions of Java do not allow reading from a local file.
6 . 6 Complete visualization systems requiring program annotation Complete visualization systems with program annotation require that the designer of the animation make some form of annotations to the program code. Many of these systems include a variety of examples and demonstrations. Bertrand Ibrahim of the University of Geneva has directed a project that allows the surfer to control the execution of Pascal programs from within an HTML document. The approach used by Ibrahim’s group is based on CGI scripting. The best description of the technique is the following, which appears on Ibrahim’s Web pages at http://medusa.acs.uci.edu/indiv/ franklin/doc/ibrahim/abstract.html and http://cuisung.unige .ch/eao/www/WWW 94/paper.html.
Susan Rodger’s JAWAA system at Duke is similar in principle to Stasko’s Java version of Samba. That is, a Java applet reads commands from a textual scripting language to construct an animation of the algorithm. Rodger solves the file access problem cited above with respect to Stasko’s Java version of Samba by directing the JAWAA applet to a URL that contains the JAWAA script. To find out more about JAWAA, consult http://www.cs.duke.edu/~rodger.
The solution we finally chose consists in having the shell script, invoked by the HTTP server, spawn a child process to run a slightly modified version of the Pascal program. The modification consists in adding, between each original Pascal instruction, a call to a synchronization procedure. The synchronization procedure checks whether the execution of the Pascal program should continue, or be interrupted. Whenever there is a breakpoint on the current instruction, or when the user has selected the single step button, the current state is sent to the client viewer, and the synchronization procedure waits for a signal from the server-activated shell script to resume execution, with possibly new breakpoints and selected variables, based on the latest user request. [REF?]
Tom Naps’ WebGAIGS portrays the actions of a variety of algorithms through a sequence of discrete snapshots of data structures that the algorithm manipulates. The surfer provides input to the algorithm through an HTML form that triggers a CGI script which runs the algorithm (on the server) for that set of input. The WebGAIGS system then computes a collection of graphic primitives that will ultimately depict the algorithm. These primitives, along with a Java applet that renders them and provides a viewing environment for the snapshots, are then transmitted to the Web client. The graphical snapshots are accompanied by explanatory text appearing in a HTML frame. To view the collection of algorithms currently depicted by this system, aim your browser at http://gaigs.cmsc .lawrence.edu .
Marc Brown of Digital Systems Research has developed a methodology for visualizing algorithms over the Web using the Visual Obliq programming language. Sample algorithms available for viewing at Brown’s site include bin packing, selection sort and Dijkstra’s shortest path algorithm. Unfortunately, although intended to be system-independent like Java, the Visual Obliq language currently will only execute programs under browsers such as DeckScape, WebCard, or WebScape that have also been developed at the same System Research Center. Although Brown states “We are currently investigating how to implement CAT [his system] using standard components, such as Java and ActiveX,” the status of this once promising project is unclear since Brown recently left the DEC SRC group. Consult Brown’s Web page at http://www.research.digital.com/SRC/webbrowsing/#oblets for more information.
The WWW-TRAKLA system developed by Ari Korhonen and Lauri Malmi at the Helsinki University of Technology is a Web-based, computer-aided learning environment for helping to teach algorithms and data structures. Not only does TRAKLA provide links to Java applets that portray a variety of algorithms, but it also distributes tracing exercises to the student and then evaluates the student’s answers to the exercises. The student enters her answers to these exercises using an interactive graphical editor that is coded in the Java language. Korhonen and Malmi encourage interested parties to visit their pages at http://www.niksula.cs.hut.fi/~tik76122 /index-eng.html. A Web-based visualization system soon to be made available by Dimitrios Theotokis of the University of Athens will offer
23
Working Group Reports and Supplemental Proceedings student viewers of the visualization the opportunity to “customize” the version of the electronic book they are currently reading. Theotokis is exploring the use of JavaScript to achieve a high degree of interaction between the student, visual representations of algorithms, and accompanying textual materials. You can stay posted on the progress of Theotokis’s project by checking http://www.di.uoa.gr/ ~dtheo.
7
on what is available. First, Scott Grissom of the University of Illinois at Springfield has started the Visualization Resource Center for computer science educators at http://www.uis.edu/ ~grissom/VRC. Grissom’s VRC promotes the use and development of visualizations (not limiting itself to Webbased visualizations) to teach computer science. It is a peerreviewed collection of tools, visualizations, demonstration ideas, references, and Internet resources. Authors wishing to submit their visualizations to Grissom’s center may do so through forms available at the Web site. A second on-line resource for strictly Web-based visualization will be maintained by our own working group after the conclusion of this year’s ITiCSE Conference. To access this site, point your browser at http://sol.pace.edu/webvis. Anyone interested in suggesting sites to be listed on this page should contact any member of our working group. (The email addresses appear on the first page of this report.)
Conclusions
Web-based visualization tools for helping our students understand and explore computer science concepts are destined to be a medium that will evolve very fast. As such, any survey in a static document such as these proceedings is bound to be obsolete almost as soon as it is published. Consequently, we offer at least two Web sites which will help keep you up-to-date
6
References 1
2 3
4
5
Fell, H. and Proulx, V. Exploring Martian planetary images: C++ exercises for CS1. SIGCSE Bulletin, February 1997, 30–34. Flanagan, D. Java in a Nutshell (2nd). O’Reilly & Associates, 1997, 539–540. Haajanen, J., Pesonius, M., Sutinen, E., Tarhio, J., Terasvirta, T., Vanninen, P. Animation of user algorithms on the Web Proc. Visual Languages '97, Capri, Italy, September 1997. Jiménez-Peris, R., Pareja-Flores, C., Patiño-Martínez, M., Velezquez-Iturbid,A . Graphical visualization of functional programs. SIGCSE Bulletin 28 , 3 (September 1996), 36–38. Lahtinen, S. P., Lamminjoki, T., Sutinen, E., Tarhio, J.. and Tuovinen, A.-P. Towards automated animation of algorithms. Proceedings of Fourth International Conference in Central Europe on Computer Graphics and Visualization University of West Bohemia, Department of Computer Science, 1996, 150–161.
ITiCSE'97
7
8 9 10
11
12
24
LaLonde, W. R. and Pugh, J. R. Inside Smalltalk, Vol II. Prentice Hall, 1991, 7-12. Proulx, V.,. Rasala, R. and Fell, H. Fundamentals of computer science: What are they and how do we teach them. . SIGCSE Bulletin 29 , 3 (September 1997) 42–48. Stasko, J. Using student-built algorithm animations as learning aids, SIGCSE Bulletin 29 ,1 (March 1997). Stasko, J. A framework and system for algorithm animation. IEEE Computer, September 1990. Stasko, J., Badre, A. and Lewis, C.. Do algorithm animations assist learning? An empirical study and analysis. Proceedings of the INTERCHI'93 Conference on Human Factors in Computing Systems, Amsterdam, Netherlands, April 1993. Stein, L. A. Interactive programming: Revolutionizing introductory computer science. Computing Surveys, 28A,4, (December, 1996) http://www.acm.org/surveys/1996 /Stein/Interactive/ Winston and Narasimhan, On to Java,. Addison-Wesley, 1996, 239ff.
Working Group Reports and Supplemental Proceedings
ITiCSE'97
Appendix A Additional resources • Arnold, K. and Gossling, J.. The Java(TM) Programming Language, Addison Wesley, 1996. • Baecker, R., DiGiano, C. and Marcus A. Software Visualization for Debugging. Communications of the ACM 40 , 4 (April 1997). • Baker, J. E. Cruz, F. Liotta, G. and Tamassia R. Algorithm animation over the World-Wide Web. Proceedings of International Workshop on Advanced Visual Interfaces (AVI '96), 1996, 203–21. • Ben-Ari, M. Distributed algorithms in Java. SIGCSE Bulletin 29 , 3 (September 1997) 62–64. • Bergin, J, Brodlie, K., Goldweber, M., Jiménez-Peris, R., Khuri, S., Patiño-Martínez, M., McNally, M., Rodger, S., and Wilson, J. An overview of visualization: its use and design. SIGCSE Bulletin 28 , 3 (September 1996), 192–200. • Berry, J. Improving discrete mathematics and algorithms curricula with LINK. SIGCSE Bulletin 29 , 3 (September 1997) 14–20. • Brown, M. H. and. Najork, M. A. Collaborative active textbooks: a Web-based algorithm animation system for an electronic classroom. Proceedings of IEEE Symposium on Visual Languages, 1996, 266–275. • Burke, E. K and Varley D. B. A genetic algorithms tutorial tool for numerical function optimization. SIGCSE Bulletin 29 , 3 (September 1997), 27–30. • Cornell G., Horstmann, C.S.. Core Java. 2ed. Sunsoft Press, 1997. • Domingue, J. and Mulholland, P. The Internet software visualization library. To appear in: Proc. PPIG 9, Psychology of Programming Interest Group, 9th Annual Workshop, 1997. • Goldberg, M. Using a Web-based course authoring tool to develop sophisticated Web-based courses. In B. H. Khan (Ed.), Web Based Instruction, University of Texas at Brownsville. • Goldberg, M. WebCT and first year: student reaction to and use of a web-based resource in first year computer science. . SIGCSE Bulletin 29, 3 (September 1997) 127–129. • Ibrahim, B.: World-wide algorithm animation. Proceedings. 1st World-Wide Web Conference, Geneva, Switzerland, May 25–27, 1994, 305–316. • Janser, A. W. An interactive learning system visualizing computer graphics algorithms, SIGCSE Bulletin 29 , 3 (September 1997) 21–23. • Janser, A., and Luther, W. Der Bresnahan-Algorithmus und andere graphische Grundproceduren. In K. Dette, D. Haupt, and C. Polze (Eds.) Multimedia und Computeranwendungen in der Lehre, Springer, Berlin/Heidelberg, 1992, 255–261. • Meisalo, V. Sutinen, E., and Tarhio, J. CLAP: teaching data structures in a creative way. SIGCSE Bulletin 29 , 3 (September 1997) 117–119.
• Mutchler, D. and Laxer, C. Using multimedia and GUI programming in CS 1. . SIGCSE Bulletin 28, 3 (September 1996), 63–65. • Myers, B. Taxonomies of visual programming and program visualization. Journal of Visual Languages and Computing 1, 1990, 97–123. • Naps, T., Algorithm visualization on the world wide web — The difference Java makes! SIGCSE Bulletin 29 , 3 (September 1997) 59–61. • Rasala, R., Proulx, V., and Fell, H. From animation to analysis in introductory computer science. SIGCSE Bulletin 26 ,1 (March 1994), 61–65. • Rautama, E., Sutinene, E., Tarhio, J. Excel as an algorithm animation environment. SIGCSE Bulletin 29 , 3 (September 1997) 24–26. • Roberts. E., A C-based graphics library for CS1. SIGCSE Bulletin 27 ,1 (March 1995), 163–167. • Roberts, E., Tools for creating portable demonstration programs. . SIGCSE Bulletin 28 , 3 (September 1996), 78. • Ross, R. et al. Dancing with Dynalab: endearing the science of computing to students. SIGCSE Bulletin 28 ,1 (March 1996), 135–139. • Silva, A. Simulating electronic circuits with an electronic spreadsheet. Computer & Education 22 , 4, (1994), 345– 353. • Stasko, J., Carlson, D., Guzdial, M., Kehoe, C., and Shah, V. WWW interactive learning environments for computer science education. SIGCSE Bulletin 28 ,1 (March 1996). • Stein, L. A. Beyond objects, to appear in educator’s symposium. Conference on Object Oriented Programming Systems, Languages, and Applications, Atlanta, Georgia, October 1997. • Stein, L. A. Rethinking CS101, Accepted for Publication in Computer Science Education. • Theotokis, D., Gyftodimos, G., Georgiadis, P., and Philokyprou, G., VIBDaST: A virtual interactive book as a data structures teaching aid, SIGCSE Bulletin 29 , 3 (September 1997) 111–113. • Wilson, J., Aiken, R., and Katz, I. Review of animation systems for algorithm understanding, SIGCSE Bulletin 28 , 3, (June 1996), 75–77. • Wolz, U., Domen, D., and McAuliffe, M. Multimedia integrated into CS2: An interactive children’s story as a unifying class project SIGCSE Bulletin 29 , 3 (September 1997) 103–110. • Wolz, U., Weisgarben, S., Domen, D., and McAuliffe, M. Teaching introductory programming in the multi-media world, SIGCSE Bulletin 28 ,3 (September 1996), 57–59.
25
Working Group Reports and Supplemental Proceedings
ITiCSE'97
Appendix B Summary of URLs related to visualization http://www.kt.tu-cottbus.de/info/word2html.html — a comprehensive list of links to translators to and from HTML source http://www.intermetrics.com — AdaMagic, which generates applets from Ada95 programs http://www.tcnj.edu/~compsci/ — the SIGCSE Computing Laboratory Repository, a Web-based resource center for educators http://www.sbu.ac.uk/opencore/acm — Information Gateway, an on-line database to encourage collaboration between people with projects and people looking for projects; by Douglas Siviter at South Bank University http://sol.pace.edu/webvis — a comprehensive listing of Web-based algorithm visualization sites, a product of this working group http://www.geocities.com/SoHo/2167/book.html — a collection of explanations of various sorting algorithms; authored by Thomas Niemann of Santa Cruz, California http://wasabi.cs.vt.edu/~josec/sciviz/ — a presentation of operations on binary tree structures that includes a variety of static visualizations created by Macromedia Director 4.0; created by José C. Castillo, Mourad Fahim, and L˙cio C. Tinoco of Virginia Tech http://www.ccs.neu.edu/teaching— a variety of Mac-specific visualizations for CS1 and for algorithms and data structures courses; created by Harriet Fell, Viera Proulx, and Richard Rasala http://SunSITE.univie.ac.at/Spreadsite/ — a variety of scientific animations that require Excel spreadsheet software http://www.cs.rpi.edu/projects/STL/htdocs/node50.html — interactive visualizations that illustrate several sorting algorithms; by Ken Zalewski http://orange.mcs.dundee.ac.uk:8080/CS202/tuts/mosaic/ sorting/QuickDemo/QuickSortDemo.html — illustration of the quicksort algorithm by Glenn Rowe of University of Dundee http://gaigs.cmsc.lawrence.edu/animation/ — Java-based illustrations of five classic sorting algorithms; by Yin-so Chen of the University of Washington http://charis.mcs.alma.edu — algorithm animations in Java; created by students of Myles McNally at Alma College http://www.cs.princeton.edu/~ah/alg_anim/index.html — animations of sorting and computational geometry algorithms; by Alejo Hausner of Princeton University http://www.dgp.toronto.edu/people/van/courses/csc418/ — collection of Java applets to illustrate concepts in computer graphics; by Michiel van de Panne of the University of Toronto http://csis.pace.edu/~bergin/Java/applets.htm — a Java applet that provides animations of bubble, selection, and quick sorts with a variety of options for input generators; by Joe Bergin of Pace University http://www.cs.montana.edu/~dynalab — information on Rockford Ross’s Dynalab system, which provides a very complete program animation system for Pascal programs and also animations of programs written in subsets of Ada and C++; only has a prototype of the Web version
http://lml.ls.fi.upm.es/epd/epd.html — in Spanish; an example of how students can make a visualization an integral part of their program http://lml.ls.fi.upm.es/VisualGroup/ — a set of sites by Marta Patiño-Martínez and Ricardo Jiménez-Peris at Universidad Politécnica de Madrid ; includes: • Animations.html — a set of visualizations on recursion and operations on linked lists • VisMod.html — a visual programming environment for Modula-2 programs that automatically visualizes recursion, dynamic memory, input/output, arrays, etc. • VisualHipe.html — project for functional programming languages, the rewriting process uses a mixed textual/graphical notation; work done together with Cristóbal Pareja-Flores, and Ángel Velázquez-Iturbide http://www.cs.helsinki.fi/research/aaps/Jeliot — Jeliot, a Java programming environment with animation hooks automatically built into the system; by Jorma Tarhio http://medusa.acs.uci.edu/indiv/franklin/doc/ibrahim/abstr act.html — project that allows the surfer to control the execution of Pascal programs from within an HTML document, by Bertrand Ibrahim of the University of Geneva http://cuisung.unige.ch/eao/www/WWW94/paper.html — furthrer information on project by Ibrahim in preceding URL http://www.research.digital.com/SRC/webbrowsing/#oblets — sample algorithms visualized over the Web using the Visual Obliq programming language; by Marc Brown of Digital Systems Research http://www.cc.gatech.edu/gvu/softviz/SoftViz.html — projects by John Stasko of Georgia Tech; includes: • XTango system, used to facilitate the animation of algorithms developed in Xwindows • “beta” version of Samba in Java http://www.mcs.drexel.edu:80/~shartley — subset of XTango, which has been ported to Java by Steve Hartley of Drexel http://www.cs.duke.edu/~rodger — Susan Rodger’s home page; provides access to JAWAA and to Java visualizations of parsing algorithms http://gaigs.cmsc.lawrence.edu — WebGAIGS, which portrays the actions of a variety of algorithms through a sequence of discrete snapshots of data structures that the algorithm manipulates; by Tom Naps of Lawrence University http://www.niksula.cs.hut.fi/~tik76122/index-eng.html — work by Ari Korhonen and Lauri Malmi at the Helsinki University of Technology; includes: • example of electronic book idea; interactivity supports evaluation tests with autocorrection • WWW-TRAKLA, a Web-based, computer-aided learning environment for helping to teach algorithms and data structures http://www.di.uoa.gr/~dtheo — a Web-based visualization system will made available soon by Dimitrios Theotokis of the University of Athens
26