T echnology A ssistance P rogram
TAP into Learning Volume 2 Number 2 Spring 2000
IN
THIS
Using What Learners Know ISSUE
Using Spreadsheets Using What Learners Know. . . . . .1 Activity: Grade 7 and 8 Math, Social Studies and Language Arts . . .2 Managing Growth: Collaborative Decision-Making in Urban Planning . . .4 Spreadsheets . . . . . . .6 Getting Started with Spreadsheets . . . . . . .7 But aren’t spreadsheets just for math? . . . . . .7
Every learner has experiences that influence his or her understand-
ing of the world. These unique experiences form the building blocks of learning and the avenues that provide opportunities for personal connections with new content. Though our own unique experiences influence our understanding of the world, to what extent are individual differences reflected in classroom instruction or a school’s curriculum? Often in classrooms the student’s voice is silent— except in giving rote answers to formulaic questions. Perhaps many kids “tune out” of school because teaching and learning do not fit into their range of experience and because their voices are unheard. The challenge for the teacher is to engage these students from the outset so that they feel their ideas and experiences are honored and so they believe that they have a stake in their own learning. A good teacher starts by being a diagnostician. She finds out what students know about a particular domain or what experiences students may have had that will impact their understanding of a certain topic, and builds upon such knowledge. By accessing students’ “funds of knowledge” 1 — the knowledge acquired by students’ culture, socialization patterns, and non-school experiences, the teacher engages the students and allows them to connect their own experiences and beliefs to the ideas and knowledge being studied. Let’s look at how this prior knowledge is elicited in an actual classroom activity on page two. 1 Moll, L., Amanti, C., Neff, D., and Gonzalez, N. (Spring, 1992). Funds of Knowledge for Teaching: Using a Qualitative Approach to Connect Homes and Classrooms. In Theory Into Practice, XXXI, 2.
John Locke’s Essay Concerning Human Understanding (1688) The English philosopher and statesman John Locke (16321704) is the father of one of the more commonly known educational metaphors: that of the mind as a tabula rasa. Though translated as “blank slate (tablet),” the metaphor took on a life of its own, thus implying a very different theory from what Locke had in mind: Children entered school as “blank slates” with no prior knowledge or understanding of the world. Onto these blank slates, teachers grafted information. continued on page 2
A Framework for Constructivism
To learn more about SEDL’s Technology Assistance Program, visit our Web site at http://www.sedl.org/tap.
• Learners bring unique prior knowledge and beliefs to a learning situation. • Knowledge is constructed uniquely and individually, in multiple ways, through a variety of authentic tools, resources, experiences and contexts. • Learning is both an active and a reflective process.
• Learning is developmental. We make sense of our world by assimilating, accommodating, or rejecting new information. • Social interaction introduces multiple perspectives on learning. • Learning is internally controlled and mediated by the learner.
These six principles were distilled by the staff of SEDL’s Technology Assistance Program from a variety of sources on constructivism, brain research, and education research as well as staff members’ experiences as teachers, learners, and observers in classrooms.
2
TAP into Learning
Grade 7 and 8 Math, Social Studies and Language Arts
★
Activity John Locke’s Essay continued from page 1
This transmission model of education governed pedagogy for the next hundreds of years. In Book 2 of his Essay Concerning Human Understanding, Locke discusses knowledge and history of ideas. Ideas originate in individual’s sensory experience of external objects and are formed into concepts by the mind’s power of cognition. While the mind is initially a tabula rasa, it gradually forms ideas from data gathered by senses, experience, and intuition. From this “raw data” as it were, knowledge develops from simple to increasingly complex ideas. A careful reading of Locke reveals a thinker who would be more aligned with studentcentered approaches. He criticized schools “where education fits us rather for the university than the world.” He believed that education should be varied according to the individual and that children learn best by doing. Finally, Locke advocated that teachers note and encourage a child’s aptitudes.
The teacher begins by asking the
students what they know about the Great Lakes region (“Chicago, Cleveland, Lake Michigan? Are any of these names familiar?”) from readings, TV programs, stories, or perhaps trips they’ve taken. “The Bulls play in Chicago,” answers one boy. “That’s right. How many of you are Bulls’ fans?” A number of hands are raised. Before assigning the chapter, the teacher tells the students that they will be taking a road trip to one of the cities in the region and they should be thinking about where they would like to visit as they read the text. “Several of you are Bulls fans. Perhaps you’d like to go to Chicago and catch a home game. If so, what time of the year would you need to go? What will the weather be like?” The teacher asks the students to think about and share vignettes from trips they have taken in the past. “What kind of preparation is involved?” (The students brainstorm as the teacher notes these ideas on the chalk board: food, gas, money.) “How much of each?” “How can we obtain information on a certain city?” (American Automobile Association (AAA), the Internet, people who have visited the city, almanacs, etc.) Students choose the city they want to visit and record their reasons for doing so. For some students, it’s a grandparent who lives in Detroit or Gary. For others their destination city is influenced by a favorite sports team, TV show or entertainer. The students then e-mail the various Chambers of Commerce for information on their chosen city; interview people who have been to or are from that city; use spreadsheets to calculate their budget for gas, food, and lodging; plan the route of the trip using the Internet and AAA maps; and word process daily journal entries about the geography, culture, economy, and people of that city. All information is assembled in a portfolio and shared with others in the class. The portfolio includes such information as the travel budget, the length of time to drive from the student’s home to the city, photos, descriptions of noteworthy people and places and history, and the ways the city is similar to and different from the student’s hometown. In this example, the teacher still presents a curriculum-based lesson but students have choices in determining the focus of the activity. The teacher initially hooks the students by finding out what they know about a locale in particular and travel in general, and by assessing their general interests. While adhering to the curriculum, the teacher encourages students to make choices based on their interests and experiences and builds upon that knowledge and interest in creating a learning experience for students. Activity modified from a unit developed by Michelle Garza, Trish Léal, Jane Kennesson, Sharon Roy and John Schwertner of Kealing Junior High School, Austin, TX.
★
✩
✩
TAP into Learning
This activity is too time consuming. Why should I spend all this time eliciting their prior knowledge? It is far more efficient to present them with the information.
Student-centered activities, particularly
How can I elicit their prior knowledge when they know nothing about this topic?
It’s true. They may not. Your 6th grade students may not know about the structure of DNA molecules, but do they know about forensics in court cases? Do they watch court TV shows where DNA testing is mentioned? Why do we inherit certain characteristics from our parents? What does deoxyribonucleic acid sound like to you? (Go ahead, brainstorm.) Does any part of this word sound or look familiar? If we were to draw it what do you think it would look like? The diagnostician probes until she ascertains the students’ level of understanding. Or your students may surprise you by what and how much they know and how they’ve learned it. Teachers most often find this is true around the area of technology and
are often surprised how technologically savvy their students are. This appears to be one area in which students are encouraged to share prior knowledge and experiences. Perhaps there’s some connection between this and students’ general enthusiasm about technology? Why spend so much time on prior knowledge? Because it provides the teacher and students with a foundation from which to begin. Teaching is about listening and learning is about talking. By building upon students’ personal experiences, we allow students to actively construct increasingly complex pieces of knowledge. Allowing students to connect their personal experiences with new knowledge makes that knowledge more relevant and meaningful.
How can I incorporate this prior knowledge into my lesson content?
Be a diagnostician. Find out what your
relationship with students and may be very surprised by what they know. A thematic, interdisciplinary curriculum that presents a larger picture is more recognizable and more meaningful than are isolated facts. A complex, overarching theme (such as growth, revolution, native people, or community) offers a scaffold to support student contributions. If students are encouraged to construct relationships
those involving technology, certainly require more time than the traditional lecture/ worksheet types of activities. All teachers face major time constraints (time to plan, to grade, to cover the curriculum and to prepare students for tests), hence the temptation to forego the time-intensiveness of such activities for the efficiency of the lecture/worksheet models. But is the transmission model of lecture and short answer format really more efficient? Webster’s Dictionary defines “efficiency” as the maximum output with the minimum amount of expense or waste. Do students really retain the information presented in the lecture/short answer model? Are they more engaged, attentive and interested? Educational research and common sense tell us that we learn best when we are engaged with the material and when we see the material as meaningful. Think back to a wonderful learning experience you had as a student. Did the experience center on a
students know. Tap into their experiences and beliefs. Challenge their ideas. Allow for those uncomfortable seconds of silence so that a student can think through an unarticulated response. Encourage students to teach one another. Ask them to write and/ or talk about experiences or beliefs that impact the content area under study. You’ll begin to create a more personal
great lecture or a workbook exercise? Possibly, but probably not. Or did it most likely involve a project—an activity in which you were engaged, excited, and got a chance to show off some of your talents, knowledge and experiences? Do you still remember much of what you learned? By tapping into their knowledge about a particular topic we allow students to make connections between ideas, facts and concepts. These connections may provide the hook to get students interested in a subject or topic (“Hey, I didn’t know that I knew that!”) and allow them to shine in front of the teacher and their peers. By providing students with a rich, complex unit of study, we may increase the likelihood of student engagement about a topic. When engagement is increased, the tendency for students to tune out decreases and the added enthusiasm may be evident in student performance. Less efficient in terms of time, but more effective in terms of results.
continued on page 8
3
4
TAP into Learning
Managing Growth Collaborative Decision“We need to preserve our drinking
water. We can’t let people live in the recharge zone!” “But then they’ll build houses on the farm land and I think we need to keep open spaces for the kids.” High school seniors in this Central Texas school were wrestling with an issue that confronts urban planners, city officials, service providers and residents on a daily basis: How to maintain and promote the positive effects of urban growth (more jobs, infrastructure, and amenities) while mitigating the negative implications of growth (compromised air and water quality, increased traffic congestion, and urbansprawl 2, and the loss of the “small town” ambience of the community)? This very real dilemma is faced by countless communities all over the United States, particularly in the burgeoning southern and western parts of the nation. This interdisciplinary math, environmental science and geography unit attempted to address the problem of urban growth management. The teacher began asking students to talk about towns and cities they had visited or lived in and liked. “What did you like about Boston?” Answers ranged from increased amenities like sports teams to a city’s livability and architectural uniqueness: “They have sidewalks…All the houses are different. They’re not all the same like here.” The teacher then asked students to think about their community over time and how it differed from when they were children. What changes had they seen? What were the positive and negative changes? Since these students live in Central Texas, one of the fastest growing regions in the U.S. and home to a number of newly formed high tech companies, they could quite easily note the changes they had seen: more malls, restaurants and movie theaters; more traffic; less familiarity with neighbors; and greater reliance on cars.
The teacher presented the students with their task: “You have been appointed to a citizen’s action committee to develop a desirable growth scenario for your community in the year 2010. To do this you will calculate population demand and land supply in order to determine how and where urban growth will occur. Your findings will be presented as a final suitability map and accompanying report to a team of community members including a planner, developer and architect.” Students broke into teams and began discussing what kind of future community they envisioned and desired, and how growth could help or hinder the attainment of this vision. Within their various teams, they divided again into two groups. The first, a population projection group, used historical US Census data and spreadsheet software to project the community’s population for the year 2010. Using the various functions of a spreadsheet, students generated their population projection data in the form of trend lines (showing whether growth was linear or exponential), a table and line chart.
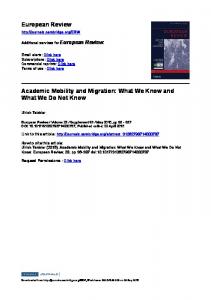
Teachers at Carencro Middle School in Carencro, LA also participated in the Managing Growth activity. Here, they present their community growth scenario to colleagues.
TAP into Learning
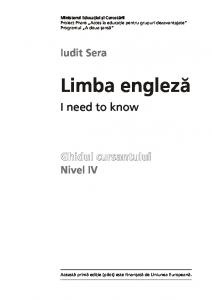
An example of a base map, in this case indicating land use. The dark shaded area to the right is agricultural land. The lighter shaded area to the left is the Edwards Aquifer Recharge Zone.
Making in Urban Planning The second group, a land supply group,
used a series of base maps (showing such features as land use, municipal boundaries, and the aquifer recharge zone 3), large transparencies and markers to color in those areas that should be exempt from development. Dark areas signified areas of existing development. Clear areas delineated land available for development. Students then overlaid this series of constraint maps to come up with a map that would show where development could occur in 2010. Once finished with their respective tasks, the population projection and land supply group met again to set about allocating predicted population growth to the available land supply and examining the results of their decisions and assumptions. Students placed a vellum grid over all constraint maps. Each team then attempted to “fit” their additional population into the land available for development. Students again used spreadsheets to calculate the number of new houses that would have to be built, persons per household, and houses per square mile. This process required making some difficult choices and tradeoffs and was informed by the students' knowledge of and values about their community. Students struggled with targeting new development toward the aquifer recharge zone to the west of town or on farmland to the east. Should some of the lands categorized as unavailable be made available for development? Students’ positions on such issues were shaped by a number of beliefs and values. Though many were able to find evidence to support their beliefs, others had
to compromise in the face of increasing population demands. Student presentations to community members were animated and insightful, reflecting the students’ knowledge, values and interest in their community. Planning members took notes as students suggested increased lot sizes for new homes on the recharge zone, the conversion of farmland into an agricultural living history park and the creation of an incentive system to encourage greater use of mass transportation. This activity is illustrative of the way prior knowledge can be used as the foundation of a unit of study and how drawing upon student knowledge can galvanize student engagement with the topic at hand. The teacher began by focusing on a topic about which students had a great deal of knowledge and which held real meaning for students—their community. In setting up the unit of study she elicited students’ opinions about the positive and negative effects of growth on their community and their observations about the admirable characteristics of other communities they had lived in or visited. She then created an academically rich interdisciplinary activity in which students were encouraged to infuse their own values and aspirations for their community. These goals formed the basis of their desired growth scenario for the year 2010.
2 Sprawl is defined as “low-density, automobile-dependent development beyond the edge of service and employment areas of the city.” 3 Much of Central Texas sits atop the Edwards Aquifer, one of the most productive artesian aquifers in the United States. Aquifers are geologic formations that hold significant amounts of groundwater from which water can be pumped for residential and commercial uses. The Edwards Aquifer is the sole source of drinking water for San Antonio, America’s eighth largest city, and residents in the Austin-San Antonio corridor. The Recharge Zone is the surface area of the aquifer where faulting and fracturing of limestone and karst allow rain to seep in and replenish the aquifer.
Using gridded vellum to calculate population density (4 cells = 1 mile2).
For more information on this activity, see www.sedl.org/ ~mburns/resources/
5
6
TAP into Learning
Spreadsheets S
preadsheets are often likened to electronic ledger books, but are in fact more powerful. Computerized spreadsheets can calculate large quantities of data easily, accurately, and efficiently, and are consequently a wonderful tool for
balancing checkbooks, calculating grades, creating charts, automating calculations, sorting data, and performing statistical functions. When new information is inserted into an existing spreadsheet, revised calculations are performed automatically.
Spreadsheet Structure Spreadsheets are organized into rows and columns. Rows are horizontal lines of values (data) labeled by numbers (1,2,3 etc.). Columns are vertical lines of data labeled by letters (A, B, C etc.). Cells are where the intersections of rows and columns meet and are labeled by both their letter and number (A1, B2, C3 etc.). A formula is a mathematical statement used to calculate the values stored in cells. Figure 1 provides a visual representation of this.
Perhaps a more helpful metaphor for how spreadsheets are organized is that of a theater or concert hall. The theater shares an organization similar to that of a spreadsheet: seats are arranged both horizontally (like the rows of a spreadsheet) and numbered as such: 1,2, 3 etc., and vertically (like the columns of a spreadsheet) and organized with letters: A, B, C etc. Your seat, for example, A26, similar to the spreadsheet cell, is the junction of the row and column.
Formula
Figure 1: Overview of Spreadsheet Structure
Rows
Columns
Cell
TAP into Learning
Getting Started with Spreadsheets There are a number of books and websites
that can help you get started using spreadsheets. Most tutorials are very heavily weighted toward the most commonly found “brands,” such as Microsoft Excel. If you’re using QuattroPro, for example, the pickings are slim. However, most of the spreadsheet skills you learn are transferable to all other types of spreadsheet software. Many of the sites listed are tutorials with very clear stepby-step instructions and pictures that make spreadsheet creation and analysis fun and easy to follow. A better way, perhaps, to learn to use spreadsheets is to come up with a project for yourself (creating a gradebook, setting up a vacation fund) and diving in.
But aren’t spreadsheets just for math? It is true that spreadsheets most easily lend themselves to quantitative analysis, and for that reason are often used in more analytical types of subjects such as math and science. However, spreadsheets can add rigor to other subject areas that are not often thought of as quantitative. Language Arts: The Outsiders
The Outsiders is a short novel about a young teen named Johnny who is orphaned and who hangs out with a streetwise gang. Though basically a good kid, Johnny kills another teen and must go into hiding. The novel follows his time in hiding and examines the world of his gang. In this 8th grade Language Arts class, students were asked to imagine that the gang members had been arrested and were awaiting trial. The class divided itself among prosecutors and defendants and had to create a personality profile of a character in The Outsiders to be presented at the upcoming court case. For example, in analyzing Johnny, the main character, the students used spreadsheet software to construct a table that would quantify Johnny’s personality traits. Column headings contained the character’s main attributes or qualities (e.g. Columns A-C contained such descriptors as “kindness,” “loyalty,” “anger”). continued on page 8
1. General Information on Spreadsheets Top 50 Spreadsheet Books URL: http://www.tucson.com/allpub/50spr-xw.html Source: All Publishers’ Outlet 2. Microsoft Excel (PCs, Windows 95/98) URL: http://is.rice.edu/~consult/cross/excel/index.html Source: Rice University Hands-on Exercises Using Windows 98 URL: http://www.microsoft.com/education/tutorial/ classroom/o98/hoview.asp Source: Microsoft in Education Microsoft Personal Online Help URL: http://search.support.microsoft.com/Kb/z.asp Source: Microsoft Corporation 3. Microsoft Excel 98 (Macintosh) URL: http://www.sedl.org/staff/selfpace/excel98/excel98guide.html Source: Southwest Educational Development Laboratory 4. Lotus 1-2-3
1-2-3 Basics URL: http://w3.aces.uiuc.edu/AIM/CCSOcourses/ new-lotusbasics95_final.html Source: Computing and Communications Services Office, Urbana, Illinois Lotus Technical Support URL: http://www.lotus.com (search for “Lotus 1-2-3”) Source: Lotus Development Corporation 5. AppleWorks Introduction to ClarisWorks URL: http://ripsaw.cac.psu.edu/~sdp2/htmls/claris/ bclarisworksss.html Source: Stephen Peterson Center for Academic Computing— PennState University 6. QuattroPro Corel Product Support URL: http://www.corel.com/products/wordperfect/cqp8/ support.htm Source: Corel Products
7
8
TAP into Learning
To contact the Technology Assistance Program, please call us at 1-800-476-6861 or write to us at Technology Assistance Program, SEDL, 211 East Seventh Street, Austin, TX 78701. You may also send us e-mail by writing to Vicki Dimock, Program Manager (
[email protected]). TAP into Learning is a collaborative effort by the staff of the Technology Assistance Program. This issue was written by Mary Burns and Sharon Adams. Mary Burns, Editor. To learn more about SEDL’s Technology Assistance Program, visit our Web site at http://www.sedl.org/tap. Design, Jane Thurmond, Austin, TX
© Southwest Educational Development Laboratory. This publication was produced in whole or in part with funds from the Office of Educational Research and Improvement, U.S. Department of Education, under contract #RJ9600681. The content herein does not necessarily reflect the views of the Department of Education, any other agency of the U.S. Government, or any other source. SEDL is an Equal Employment Opportunity/Affirmative Action Employer and is committed to affording equal employment opportunities to all individuals in all employment matters. Available in alternative formats.
How can I incorporate this prior knowledge into my lesson content?, continued from page 3
and create metaphors for their understanding, they are more likely to make personal connections to the content. Challenging them to use higher order thinking skills— asking them to analyze, create, or synthesize ideas—helps to broaden their view of the content. Linking that broad view to direct student experience, however, can be difficult. How can a teacher lure student imaginations to
But Aren’t Spreadsheets Just For Math?, continued from page 7
Each row (1,2,3 etc.) contained the page number that showed the incidence of that quality. Each incidence (of anger, loyalty etc.) was recorded, totaled and students created a chart graphically representing the character’s personality profile. The chart was copied into a word-processed report advocating the character’s guilt or innocence. The spreadsheet table itself was attached as an appendix to the report. Home Economics: Nutrition Spreadsheet
In order to create a nutrition profile, these 9th grade Home Economics students analyzed their weekly diet. Using serving sizes found on food packages, as well as data gathered from the Internet, the students created a spreadsheet showing the type of food consumed, the number of calories per serving, total calories, proteins, fats, sodium, and carbohydrates. Students then created a second spreadsheet that calculated their average weekly amount of physical activity. From these two spreadsheets students were able to compare food intake versus the amount of energy burned and subsequently devise a personal nutrition and exercise plan for themselves. History: Spreadsheet Nationalism Simulation
Spreadsheets in history? Yes. Professor James Brown wanted his freshman history students to go beyond memorization and recitation of dates and events in 19th century Europe and understand the motivations and decisions that prompted major political events. He thus constructed
the natural world if their interest is captured by video games? Begin with your students’ interests and build upon them. The social studies teacher in the previous example let the students choose a city for their trip. There is no assurance that all the students will want to plan a trip, but offering them an option gives them a start toward making the activity their own. If a current event has captured the class mind for the moment, the teacher may consider altering the day’s lesson to follow that avenue of exploration.
a spreadsheet simulation game in which students chose a particular European nation (e.g., the Hapsburg Empire, Prussia, France, etc.), assumed the role of its leader and directed that nation's policy through the course of the 19th century. Each column of the spreadsheet contained a critical event in the nation’s history while rows contained choices of potential decisions. By utilizing the spreadsheet’s “what-if” function, students could choose one of the options presented or enter their own decision variable and examine the result of such decisions. Thus, the introduction of the spreadsheet tool personalized and vivified what might have been otherwise rather meaningless historical events. Though first piloted in a university setting, this activity has been conducted in high school history classes. For more information on this activity, contact Dr. James S. Brown at
[email protected].
Art: What Are the Ten Greatest Manmade Creations in the World?
Students in this 10th grade art class set about answering this question. They narrowed the categories for entry (art and architecture), devised criteria for judging “the greatest,” then compiled their list of examples in each category (e.g. Michaelangelo's David, the Sears Tower). Using spreadsheets, students then entered the year the structure was created, its dimensions (height, width, weight, circumference etc.), photos of each structure and the time it took to construct. Using pre-determined criteria, students then sorted their data in order to determine their “Top Ten” greatest manmade structures.