Postharvest Biology and Technology 77 (2013) 80–86
Contents lists available at SciVerse ScienceDirect
Postharvest Biology and Technology journal homepage: www.elsevier.com/locate/postharvbio
Utilizing the IAD index to determine internal quality attributes of apples at harvest and after storage Juliana Nyasordzi a , Haya Friedman a , Zeev Schmilovitch b , Timea Ignat b , Asya Weksler a , Illona Rot a , Susan Lurie a,∗ a b
Department of Postharvest Science, Volcani Center, Agricultural Research Organization, Bet Dagan 50250, Israel Department of Agricultural Engineering, Volcani Center, Agricultural Research Organization, Bet Dagan 50250, Israel
a r t i c l e
i n f o
Article history: Received 30 August 2012 Accepted 4 November 2012 Keywords: Nondestructive VIS/NIR measurement Ripening Firmness Starch TSS TA Chlorophyll
a b s t r a c t A hand-held instrument (DA Meter, Sinteleia, Bolonga, Italy) which measures chlorophyll nondestructively and gives an IAD index (index of the absorption difference between 670 and 720 nm), was used to measure quality attributes of three cultivars of apples. A preharvest study conducted in a ‘Starking’ apple orchard found determination coefficients of r2 values of 0.79 to 0.64 between the IAD index and starch levels, firmness, TSS and TA of fruit. Three orchards of ‘Starking’, ‘Granny Smith’ and ‘Pink Lady’ apples were sampled during commercial harvest and the apples held in air storage for up to six months. The IAD index measured either at harvest or at removal from storage was correlated with TSS, TA and firmness of the apples. The r2 values were best for TSS (0.76) and poorest for firmness (0.51). Moreover, the measurement at harvest and at removal from storage gave similar prediction coefficients for quality attributes. This measurement can be used to sort at harvest for different quality classes after storage, or at removal from storage for different marketing classes. © 2012 Elsevier B.V. All rights reserved.
1. Introduction The storage potential of fruit depends on several parameters, and one important factor is harvest date. The effectiveness of postharvest storage depends to a large extent on the stage of maturity of the fruit at harvest (Rutkowski et al., 2008). Long term storage and retention of apple quality requires that the fruit are harvested at a well defined optimal harvest time (Peirs et al., 2001a; Rutkowski et al., 2008). Thus appropriate prediction of the ripening stage at harvest is important for postharvest treatment of apples. Inappropriate timing of harvest limits the storage potential and affects the organoleptic quality of the apple ultimately (Peirs et al., 2001a,b). Harvest date is generally established by monitoring changes in maturity parameters such as firmness, starch index, and total soluble solids content (TSS) (Rutkowski et al., 2008; Molina-Delgado et al., 2009). Apple fruit maturation can also be assessed by monitoring changes of the background skin color and the chlorophyll content in apple skin (Blanke and Notton, 1992; Rutkowski et al., 2008). All these parameters have been shown to change during ripening, a process that involves physical, metabolic, and biochemical alterations usually coordinated by ethylene, on or off the tree. Ripening
∗ Corresponding author. Fax: +972 3 9683622. E-mail address:
[email protected] (S. Lurie). 0925-5214/$ – see front matter © 2012 Elsevier B.V. All rights reserved. http://dx.doi.org/10.1016/j.postharvbio.2012.11.002
results in loss of background green color, softening of fruit tissue, and attainment of characteristic aroma and flavor. Apples have a climacteric ripening behavior, characterized by a rapid increase in ethylene production and respiration to a maximum after which the rates declines (Dixon and Hewett, 2000). Some studies have shown that determination of chlorophyll content and other quality parameters by means of optical spectra can be a tool for indicating the optimum harvest date of apples (Zude and Herold, 2002; Rutkowski et al., 2008). Recently, a hand-held instrument (DA meter, Sinteleia, Bolonga, Italy) has been developed that by using absorbance within the chlorophyll absorption range, allows indirect determination of the chlorophyll content in the fruit skin nondestructively. The instrument measures absorbance at two wavelengths, 670 nm and 720 nm. The two wavelengths were chosen because 670 nm is the absorbance peak for chlorophyll in stonefruit (for which the instrument was developed), and 720 nm is a minimum absorbance which does not change as chlorophyll is degraded in the peel (Ziosi et al., 2008). The instrument gives an index of absorbance difference (IAD ) which is calculated as the subtraction of absorbance at 670 nm minus the absorbance at 720 nm (Ziosi et al., 2008). The measurement of a fruit’s chlorophyll index gives an indication of the ripeness state. Thus the IAD index can give the state of ripeness of a measured fruit and can be useful in the different stages of the fruit production chain as well as the consumption cycle of the fruit. During storage it can be used to assess the maturation state of the
J. Nyasordzi et al. / Postharvest Biology and Technology 77 (2013) 80–86
stored fruit, and to give information about the shelf-life that can be expected, and at the retail stage it can help select the most ripened fruit to sell. The IAD index measurement can also be used on a sorting line which can give an optimal distribution of fruit for storage. Thus the aim of this study was to apply this index to apples and to determine if it can measure apple ripeness. This was performed by correlating the index with other quality parameters measured destructively at harvest and during storage. The study was carried out on three apple cultivars, ‘Granny Smith’, ‘Pink Lady’ and ‘Red Delicious’ from commercial harvests of three orchards for each cultivar. 2. Materials and methods 2.1. Fruit material and their handling A preharvest study was made on one orchard of ‘Starking’ apples. Fifty apples were picked at ten days intervals beginning one month before the beginning of harvest and continuing for ten days after the beginning of harvest. Each apple was measured for ripeness as detailed below. At harvest, apples from three cultivars, ‘Starking’, ‘Granny Smith’, and ‘Pink Lady’, were collected from three orchards, 200 fruit from each orchard (600 fruit per cultivar). The harvest dates were September 19 for ‘Starking’, October 10 for ‘Granny Smith’, and November 11 for ‘Pink Lady’. All the fruit were collected in 5 kg crates and placed in 10 ◦ C, 95% relative humidity (RH) storage upon arrival for a day before measurements commenced. The following day the fruit from each orchard were numbered, weighed and IAD index measured on each individual fruit. Measurements were taken at two equatorial points 90◦ to the location of the number on each apple, and given as an average of the two measurements. The fruit were then measured destructively as detailed below. Fifty fruit from each orchard were used for harvest measurements and five days shelf-life measurement at 20 ◦ C, and the rest were placed in storage at 0 ◦ C, 95% RH for 2, 4 and 6 months. For each removal 50 fruit from each orchard were taken and IAD index measured. Twenty five of the fruit were examined on the day of removal and the other twenty five held for five days at 20 ◦ C and then examined. 2.2. Quality parameter measurements At harvest the following destructive measurements were taken: firmness, starch, total soluble solids (TSS), titratable acidity (TA) and peel chlorophyll content. The same measurements were taken for each removal and shelf-life, except for starch and chlorophyll content which were only determined at harvest. Firmness of each fruit was measured at harvest, shelf-life and storage using a bench top penetrometer with an 11 mm diameter cylindrical probe (Penefel, Lyons, France). Prior to measurements the fruit was pared on two opposite cheeks of the equatorial region of the apple and measurements were taken on each side. Firmness was averaged for each fruit and the results expressed in newtons (N). Starch content at harvest was determined visually using the standard iodine test by staining an equatorial sliced half of the apple with Lugol’s solution composed of (2.5 g) iodine (I2 ) and (10 g) potassium iodide (KI) in 1 L of distilled water. The staining pattern was scored against a reference table of photographs with a range of 1–8 starch content. The number 1 indicates maximum starch content (maximal dark stain) and index 8 represents maximum starch hydrolysis (clear stain). TSS and TA were measured from freshly prepared juice from each individual fruit. An automatic digital refractometer (Atago,
81
Tokyo, Japan) was used to measure the TSS readings. The results were expressed as %. TA was determined by titrating 1 mL of apple juice with 50 mL of distilled water and 0.1 M NaOH to pH 8.2, using an automatic titrator (Metrohm, Geneva, Switzerland). The results were expressed as % of malic acid/volume juice. Chlorophyll content at harvest was determined in each apple. The apple skin was thinly peeled and 10 discs with a diameter of 1 cm each were prepared from each apple peel using a cork borer. The chlorophyll pigment was extracted with 80% ethanol. The discs were boiled twice with a total of 1.5 mL of 80% ethanol for 45 min at 100 ◦ C. The extracts were pooled into an eppendorf test tube and centrifuged for 10 min at maximum speed 13,000 rpm. 0.4 mL disc extract and 1.2 mL of 80% acetone were transferred into a cuvette and the chlorophyll concentration in the solution was determined with a spectrophotometer at two wavelengths (645 nm and 630 nm). Chlorophyll content was calculated as described by (Rosenvasser et al., 2006). 2.3. Statistical analysis The relationships between IAD index and quality attribute variables were analyzed with Microsoft Excel software and JMP 9 (SAS Institute Inc.) for analysis of variance, and means were compared with Tukey-Kramer HSD test at P value ≤0.05. The correlation between IAD index and other quality parameters were determined with linear regression. The linear regression model performance was evaluated for statistical parameters like the correlation coefficient (r2 ), the root mean square error (RMSE) and the P value. A good model for prediction of quality parameters should have a high r2 close to one, low RMSE, and a low P value. The results of parameters measured at harvest and different storage durations are graphically represented with either Sigma Plot 10 or Excel software. 3. Results 3.1. Preharvest measurements ‘Starking’ apples analyzed at intervals of ten days beginning a month before estimated harvest progressed in their development as expected (Fig. 1). There was a gradual decrease in firmness and TA and increase in weight as the apples approached harvest. Between the beginning of harvest and a late harvest there was a drop in firmness and TA. TSS, starch and IAD indices values were stable until ten days before harvest at which point they began to change rapidly. Linear regression between IAD index and firmness or starch gave r2 values of 0.79 and 0.73, respectively (Fig. 2). The internal taste qualities of TSS and TA correlated with the IAD index measurement as well, giving r2 values of 0.77 and 0.62, respectively. 3.2. Quality parameters of apple fruit at harvest The quality attributes at harvest from the three cultivars and three orchards are summarized in Table 1. At harvest firmness, TSS, TA, IAD index, starch index and chlorophyll content were measured for all cultivars from the three different orchards. ‘Pink Lady’ displayed the highest mean firmness of 75.2 N among the three cultivars, followed by ‘Granny Smith’ with a mean firmness of 71.3 N and then ‘Starking’ with 59.8 N firmness. There were significant differences in firmness from orchards of ‘Granny Smith’ and ‘Starking’ but not from ‘Pink Lady’. With regard to TSS, ‘Pink Lady’ recorded the highest value followed by ‘Starking’ and then ‘Granny Smith’. The TSS ranged from 16.3% in one orchard of ‘Pink Lady’ to 10.9% in an orchard of ‘Granny Smith’. There were significant differences among orchards of ‘Granny Smith’ and ‘Starking’. The level of TA also differed among the cultivars. The range was
82
J. Nyasordzi et al. / Postharvest Biology and Technology 77 (2013) 80–86
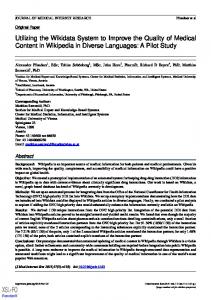
Fig. 1. Changes in ‘Starking’ apple quality attributes during the month leading up to commercial harvest as well as early and late harvest. Attributes examined are size (weight), firmness, TSS, TA, starch index and IAD index. Columns with different letters are significantly different at P = 0.05.
from 0.22% in an orchard of ‘Starking’ to 0.73% in an orchard of ‘Granny Smith’. In all three cultivars there were significant differences among the orchards. Though ‘Pink Lady’ showed the highest TSS level, it equally showed a higher TA value than ‘Starking’. ‘Pink Lady’ has a good sugar-acid blend responsible for its sweet-tart taste. ‘Starking’ had a low TA and the lowest firmness, a possible indication of advanced ripeness. This was substantiated by the starch index, which was highest in ‘Starking’ and lowest in ‘Granny Smith’. One orchard of ‘Starking’ had a lower starch index (5.7) than the other two orchards which were around 7. ‘Granny Smith’ had the highest IAD index of 1.90, followed by ‘Starking’ and then ‘Pink Lady’. There were differences among the orchards. Chlorophyll followed a similar pattern with the highest amount of chlorophyll in ‘Granny Smith’ and the lowest in ‘Pink Lady’.
3.3. Changes in quality parameters at removal and shelf-life Since apples are eaten after long storage it was important to determine the quality parameters also after storage. Fig. 3 shows changes in firmness, SSC, TA and IAD index during storage of the three cultivars. Varying trends of changes were observed among the cultivars in the various parameters measured during storage (Fig. 3). Firmness, IAD index and TA decreased during storage whilst TSS increased. The cultivars began storage with different firmness and varied in their rates of softening during storage. ‘Granny Smith’ firmness was 71.3 N at harvest and when it was kept at 20 ◦ C for five days its firmness decreased to 69.5 N. During two months storage the firmness decreased very little, while after 4 and 6 months the firmness decreased by about 4.5 N for each storage time. During shelf-life
Table 1 Ripeness quality parameters of three apple cultivars at harvest. Values are the means ± standard error for 25 apples in each orchard. Comparison is within each column for each parameter. Small letters indicate differences between orchards of each cultivar, while large letters compare the averages of the three cultivars. Granny Smith Orchard
Firmness (N)
TSS (%)
TA (%)
IAD Index
Starch (1–8)
Chlorophyll g/g FW
Orchard 1 Orchard 2 Orchard 3 Average
78.3 ± 0.63a 66.4 ± 0.66b 69.5 ± 0.63b 71.3 ± 0.61B
12.1 ± 0.09a 10.9 ± 0.24b 11.4 ± 0.17b 11.5 ± 0.17 C
0.61 ± 0.01b 0.59 ± 0.01b 0.73 ± 0.02a 0.64 ± 0.01A
2.01 ± 0.02a 1.80 ± 0.06b 1.88 ± 0.02b 1.90 ± 0.03A
4.2 ± 0.27a 3.4 ± 0.30a 3.8 ± 0.25 3.8 ± 0.27A
1.71 ± 0.18a 1.00 ± 0.05b 1.14 ± 0.09ab 1.28 ± 0.11A
Pink Lady Orchard 1 Orchard 2 Orchard 3 Average
75.7 ± 1.01a 75.8 ± 0.80a 74.4 ± 0.87a 75.2 ± 0.78A
16.0 ± 0.30a 16.3 ± 0.13a 15.8 ± 0.23a 16.0 ± 0.22A
0.50 ± 0.12b 0.62 ± 0.02a 0.50 ± 0.02b 0.54 ± 0.05B
0.48 ± 0.03b 0.76 ± 0.03a 0.74 ± 0.03a 0.66 ± 0.03 C
6.0 ± 0.17b 6.7 ± 0.10a 6.5 ± 0.16ab 6.4 ± 0.14B
0.13 ± 0.02a 0.18 ± 0.03a 0.18 ± 0.02a 0.16 ± 0.02B
Starking Orchard 1 Orchard 2 Orchard 3 Average
65.3 ± 1.66a 58.1 ± 1.65b 64.7 ± 0.59a 59.8 ± 1.29 C
14.4 ± 0.18b 15.4 ± 0.25a 13.9 ± 0.22b 14.6 ± 0.22B
0.24 ± 0.01b 0.22 ± 0.01b 0.33 ± 0.01a 0.26 ± 0.01 C
0.89 ± 0.07b 0.61 ± 0.07c 1.29 ± 0.05a 0.90 ± 0.06B
7.0 ± 0.18a 7.1 ± 0.16a 5.7 ± 0.23b 6.6 ± 0.19B
1.19 ± 0.19a 0.86 ± 0.05b 1.45 ± 0.20a 1.17 ± 0.15A
J. Nyasordzi et al. / Postharvest Biology and Technology 77 (2013) 80–86
83
lost in all cultivars between two and four months of storage than between harvest and two months of storage. TSS varied in the cultivars during storage and at shelf-life conditions (Fig. 3). At harvest ‘Granny Smith’ had the lowest TSS of all cultivars, and this increased by 0.8% during shelf-life. During two months of storage, because of starch conversion to sugars, the TSS increased by 0.9% and remained the same during shelf-life. During storage and shelf-life for four and six months, the TSS decreased slightly, but not significantly. ‘Pink Lady’ had a high TSS of 16.1% at harvest and this increased only 0.2–16.3% after shelf-life. The amount of TSS increased 1% after two months of storage, was similar to harvest after four months, and after six months was 16.5% and 16.9% at removal and after shelflife, respectively. At harvest the TSS of ‘Starking’ apples was 14.6% and this increased 0.9% during shelf life, similar to the increase of ‘Granny Smith’. During two and four months of storage there was a non-significant increase TSS and no change in shelf-life. Comparing all three cultivars in decreasing order of sweetness shows the following sequence, ‘Pink Lady’, ‘Starking’ and ‘Granny Smith’, respectively. ‘Granny Smith’ was the cultivar with the highest TA content, followed by ‘Pink Lady’ and ‘Starking’. The TA decreased linearly in all three cultivars during storage, although in ‘Pink Lady’ there was a sharper decrease between two and four months storage, similar to the sharper decrease in firmness at that time period. There was little difference in any of the cultivars in TA at removal from storage or after shelf-life. IAD index as well as percent changes in the IAD index was determined for the different storage durations (Fig. 3). The IAD index was highest in all the cultivars at harvest, with decreasing trends after prolonged storage durations. The IAD index decreased linearly in ‘Granny Smith’ and ‘Starking’ apples for the first 4 months, while in ‘Pink Lady’ there was less decrease between two and four months storage than between harvest and two months. Between four and six months storage there was little change in IAD index in ‘Granny Smith’ apples and a greater change in ‘Pink Lady’. The percent changes in IAD index were different in the three cultivars, with ‘Granny Smith’ changing 8% over six months, while ‘Pink Lady’ changed 33% over the same period. During four months ‘Starking’ IAD index decreased by 37%. 3.4. Correlation between harvest IAD index and quality measurements Fig. 2. Linear regression of firmness, starch index, SSC and titratable acidity (TA) with IAD index of ‘Starking’ apples during maturation in the orchard.
at 20 ◦ C the firmness decreased another 2 N at each measurement time. ‘Pink Lady’ started with firmness of 75.2 N at harvest and did not soften during shelf-life. After two months of storage the mean firmness was 73 N with a significant decrease to 69 N at shelf life. During four months in storage, there was a drop in firmness of 11 N, and another 4.5 N was lost during shelf-life. The softening during storage was largest in the time between two and four months. Between four and six months there was no change in firmness, nor much softening in shelf life. ‘Pink Lady’ can be referred to as a firm cultivar, ending six months of air storage with firmness of 61.6. ‘Starking’ was the least firm among the three cultivars, starting with a firmness of 59.8 N at harvest which significantly declined to 51 N at shelf-life. At two months its firmness was 56.3 N at storage, with a significant reduction to 51 N at shelf-life. By four months, its firmness had declined to 51.9 and 51.1 N at storage and shelf-life respectively, and the fruit could not continue being stored. Comparing all three cultivars in terms of firmness, there was more firmness
IAD index taken at harvest was used to predict quality parameters at harvest and shelf-life using linear regression as depicted in Table 2. The linear regression model predicted TSS with a coefficient of determination (r2 ) of 0.76 and a root mean square error (RMSE) of 1.099. At shelf-life the prediction model was less accurate and with a higher RSME. The TA prediction model yielded similar r2 for harvest and shelf-life as for TSS. For firmness prediction r2 of 0.51 and 0.71, a RMSE of 1.569 and 1.484 was obtained at harvest and shelf-life respectively. The r2 values are not as good as than those for TSS and TA. Because the three cultivars are examined together the range of each parameter is large, from the largest to smallest value of each of the cultivars. The P value is small for all the regression correlations except for TA at shelf-life, where it indicates a poorer fit to the regression. The TA regression correlation has more variation than the other two parameters as indicated by the RMSE (%) which is close to 20%, while for the other two parameters it is 10% or less. IAD index taken at harvest and during removal from storage were also used to predict quality parameters for the apples upon removal as shown in Table 3. For the prediction of TSS at removal from storage the regression model for harvest IAD index gave an r2 of 0.76 and a RMSE of 1.109, which is very similar to values predicting harvest
84
J. Nyasordzi et al. / Postharvest Biology and Technology 77 (2013) 80–86
75
A.Granny Smith
a
70
12.4
a
a
12.0
b
cd d 85
11.2
b
B.Pink Lady
B.Pink Lady a a
a
70
c b
b
65 60
c cd
d
17
c c b 15
C.Starking
a 16
55
a
b b
b
45
0
2
b
Removal SL
b 4
b
6
0
2
8
TA (%)
.50
c c de de e e
a
a
a
b
b
.40
b b
.30 .30
a
b c
.20
bc
c
.15
Removal SL
c
10
b
30
4
Time after harvest (m)
6
a
b
20
0
1.90
1.80 1.75
B. Pink Lady
30
0.65 0.60 0.55
b
c
0.50 0.45
d
0.40
c
c 0.90
b % DA Difference DA Final
b
10 0
2
c
c
20
.10 0
b
0
C. Starking C. Starking
a
a
1.85
ab
a .25
b
a
a
1.95
2
B. Pink Lady
a
6
A. Granny Smith
4
d d
.40
.60
6
DA (% change)
.50
b b b b
4
Time after harvest (m)
A. Granny Smith
a b
Removal SL
b
14
Time after harvest (m)
.60
ab
b
15
a a
bc
c
16
C.Starking
a 60
50
ab bc
a
DA Final
75
a
TSS (Brix %)
80
ab
11.6
c
60
.70
ab
a
65
Firmness(N)
a
a
b
ab
A.Granny Smith
12.8
a
0.80 0.70
a 0
a 2
4
0.60
6
Time after harvest (m)
Fig. 3. Quality parameters measured at harvest, storage and at shelf-life. Each point is the mean of 25 fruit. DA refers to IAD index. Time periods not connected by the same letters are significantly different at P = 0.05.
J. Nyasordzi et al. / Postharvest Biology and Technology 77 (2013) 80–86
85
Table 2 Correlation between IAD at harvest and TSS, TA and firmness of three apple cultivars at harvest and shelf life. Each measurement had 225 samples. H is harvest, SL is shelf life. Parameter
TSS H TSS SL TA H TA SL Firmness H Firmness SL
Statistical parameter r2
RMSE
Range
Mean
RMSE (%)
P value
0.76 0.69 0.76 0.71 0.51 0.71
1.099 1.179 0.087 0.090 1.569 1.484
10.4 10.4 0.73 0.73 12.9 12.9
14 14.59 0.49 0.47 15.74 15.03
8 8 18 19 10 10
0.0021 0.0475 0.0015 0.1592