Future applications in the area of telecommunications are be- ing driven by the concept ... As a result of this wireless technology patients gain more mobility and ...
UWB Channel Modeling for Wireless Body Area Networks in Medical Applications Attaphongse Taparugssanagorn, Carlos Pomalaza-Ráez, Ari Isola, Raffaello Tesi, Matti Hämäläinen, and Jari Iinatti Centre for Wireless Communications, University of Oulu, Finland
Abstract Wireless body area networks (WBAN) are expected to be a breakthrough technology in healthcare areas such as hospital and home care, telemedicine, and physical rehabilitation. Because the human body has a complex shape consisting of different tissues it is expected that the nature of the propagation of electromagnetic signals in the case of WBAN to be very different than the one found in other environments, e.g. offices, streets, etc. There have been several previous experimental studies aimed to characterize the nature of the UltraWideband (UWB) channel for the case of WBANs. In this paper we describe our contribution to expand the knowledge of the UWB channel by taking measurements in the frequency range of 3-11 GHz in realistic scenarios expected to be found in medical applications. We also present channel models that have been developed using the experimental results. Keywords: WBAN channel model, Wireless EKG, Wireless medical telemetry
Introduction Future applications in the area of telecommunications are being driven by the concept of being connected or able to communicate anywhere and at anytime. This type of scenario is also envisioned in medical healthcare area. Wireless medical telemetry has been experiencing continuous developments and improvements during recent years [1]. In this application a patient’s health is remotely monitored through the use of radio technology. As a result of this wireless technology patients gain more mobility and comfort by not having to be physically connected to several pieces of medical equipment. In addition to improve the quality of patient care, wireless medical telemetry has also the potential to reduce the costs by decreasing the need to have medical personal in close proximity to patients at all times. Remote monitoring of patients enables a very efficient and timely use of doctors, nurses, and specialized medical equipment. Recent advances in wireless technology have led to the development of wireless body area networks (WBAN), where a set of communicating devices are located around the human body [2]. For the case of medical applications these devices are connected to sensors that monitor vital body parameters and movements. Among the vitals that are commonly measured we have electrocardiograms (EKG), blood oxygen saturation, blood pressure, and temperature. By measuring these vitals and wirelessly transmitting them to a control node or station a WBAN allows for the continuous monitoring of the patients’ health status without the burden of
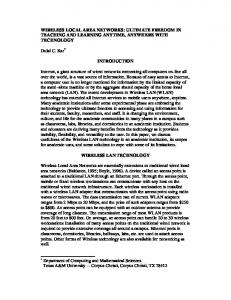
physical wires attached to their bodies or frequent visits by medical personal. Ultra-wideband (UWB) communications is a promising technology for WBAN due to its particular characteristics [3, 4]. The monitoring of human vitals and movements requires a relatively low data rate which in the case of UWB translates into very small transmitting power requirements and longer battery life, both of which are desirable features for devices that are close to body and meant to be used for extended periods of time. To properly design and develop UWB devices that can be used in WBANs applications it is necessary to observe and model the corresponding radio propagation channel in the frequency range of 3-11 GHz. For the case of indoor and outdoor scenarios comprehensive studies of the UWB propagation channel have been performed in recent years [3, 5, 6]. It is natural to expect that the channel characteristics for those cases will be different than the ones in WBAN scenarios due to the effect of the human body with its complex shape and different tissues, each with a different permittivity. Finite-difference time-domain (FDTD) numerical analysis methods have been often used in the investigation of the UWB channel close to the human body [7]. These studies are limited to scenarios that do not take into account the effect of the antennas and other conditions that are present in most realistic scenarios, i.e., walls, furniture, etc. UWB measurements around the human body have been carried out by various researchers [8-10]. These experiments have been limited to scenarios that are highly unlikely to take place in real medical applications, e.g., the use of numerous antennas very close to the skin forming a multihop wireless network [9]. It is highly unlikely that the use of several antennas and their corresponding transceivers, close to the human body, will be approved due to potential negative effects of the radio signals not only on the human organs or tissues but on other medical implants such as pacemakers. The experimental results described in this paper correspond to conditions likely to be found and approved in the medical care field. These conditions include the use of very few (at most two or three) antennas, a slight separation between the skin and the UWB device (antenna or transceiver), the location of a UWB device on an arm (as a wristwatch), and the presence of a UWB control node or gateway a few meters from the body [3], e.g., on a wall or the ceiling as shown in Figure 1. To have a reference set of measurements that does not include the effects of walls and other components, such as furniture, the experiments were first conducted in an anechoic chamber.
Channel Measurement Setup and Scenarios
Figure 1- Channel links in wireless medical communication: (A) the WBAN channel: (A1) the channel between the sensor or (A2) from the sensor nodes to the gateway, (B) the channel from the gateway to some other wireless network.
RX
TX
RF components
RF components
Port 1
Port 2
Vector Network
Computer with LabVIEW 7
Analyzer S21 parameter
Post processing
Figure 2- Frequency domain measurement using VNA
Figure 3- Antenna positions around the body Measurements were taken on a total of five individual: three males and two females. One of the male subjects has a metallic (titanium alloy) aortic implant. It is found that for certain scenarios the characteristics of the UWB channel are distinctively different depending on the gender or the medical condition of the subject. These results highlight the importance, for medical applications, to carry out a comprehensive study of the nature of the propagation signals when they take place close the human body. The measurements obtained in this study are used to estimate the channel parameters needed to build models that can be used in WBAN medical applications.
The channel measurement system used in this paper consists of an HP Agilent 8720ES, a vector network analyzer (VNA), P200 BroadSpec™ antennas [11], 5-m long SUCOFLEX® RF cables with 7.96 dB loss and a control computer with LabVIEW™ 7 software. The VNA is operated in a transfer function measurement mode, where port 1 and port 2 are the transmitting and the receiving port, respectively, as seen in Figure 2. This corresponds to a S 21 -parameter measurement set-up, where the device under test (DUT) is a radio channel. The BroadSpec™ antennas are azimuthally omni-directional with the antenna radiation patterns as shown in [11]. The sweep time of the network analyzer depends on the number of frequency points within the sweep band, being automatically adjusted by the VNA. The frequency band used in the measurements is from 3.0 GHz to 11 GHz covering both the Industrial Scientific and Medical (ISM) frequency bands (5.7255.875 GHz) as well as the whole frequency bands of the UWB mask allotted by the FCC (3.1-10.6 GHz). Therefore, the bandwidth B is 8 GHz. The maximum number of frequency points per sweep M is 1601, which can be used to calculate the maximum detectable delay τ max of the channel as
τ max = (M − 1) B .
(1)
Using (1) τ max is 200 ns which corresponds to 60 m in free space distance. Here we are interested in the first 20 ns, i.e. at most 6 m away from the body. We consider two different cases: 1) when both antennas are attached to the body and 2) when there is a separation, a 1.2 cm dielectric, between the body and the antennas. The measurements setups are designed with more realistic scenarios in mind. This means that the number of antennas near the body should be small. Also, only comfortable positions on the body where to place the antennas are selected. In addition, the level of the Tx power should be small enough so that the EM emissions do not harm the human body. The UWB channel measurement experiments were first conducted in an anechoic chamber, to minimize the effect of the environment when measuring the channel around the body. Then measurements in a classroom were conducted to investigate the UWB channels in an indoor environment. The 1st set of measurements (around the body) was taken at two different levels of the torso, at the chest level (level 1) and at the abdomen level (level 2) as illustrated in Figure 3. At each level, the Rx antenna (the rectangle in the figure) is fixed at the middle front of the torso and the Tx antenna (the circle in the figure) is placed at various positions at distances of 10 cm. We obtained results for 3 men and 2 women. The age span of the subjects is from mid 20s to mid 50s. One of three men has a titanium alloy aortic valve implant. Figure 4 shows the positions for the 2nd set of measurements, with the Tx antenna at the middle of the chest and the Rx antenna on the right hand wrist. The 3rd set of measurements aims to emulate the situation in a hospital room as illustrated in Figure 1. As shown in Figure 5, the subject stands 1 m away from a 2 m high pole where the Rx antenna is placed. The Tx
is placed at the middle of the chest, which is 1.25 m high from the floor.
sults, when the two antennas are placed on the body, for the classroom and anechoic chamber scenarios, is shown in Figure 10. It can be clearly seen the variations in the channel characteristics depending on the presence or not of the human body. When there is a separation between the antenna and the body, the average channel impulse response tends to be the closer to the one in an empty room. −50 position 2 −60
position 3 position 5
−70
position 6 −80
position 7
nd
Figure 4- Antenna positions for the 2 set of measurements Channel impulse response [dB]
−90 −100 −110 0
2
4
6
8
10
12
14
16
18
20
10 12 Delay [ns] (b)
14
16
18
20
(a)
−50 −60 −70 −80 −90 −100
Figure 5- Antenna position for the 3rd set of measurement: (1) facing the antenna, (2) beside the antenna, and (3) with the back towards the antenna
Average Channel Impulse Responses
2
4
6
8
Figure 6- Average channel impulse responses for the 1st set level 1: (a) without separation and (b) with separation −75 male 1 male 2 male 3 (with implant)
−80 Channel impulse response [dB]
Finally, measurements were done in a classroom with the size of 7.2×5×3 m. The Rx antenna is placed on a 2-m high pole. The subject with Tx antenna on the chest stands 2.4 m away facing to the pole. The measurements were also done for sitting and sleeping person scenarios. Measurements, when both the Tx and the Rx antennas are attached on the body were also conducted to compare the results to the ones measured at the anechoic chamber.
−110 0
−85 −90 −95 −100 −105 −110 0
5
10 Delay [ns]
15
20
Figure 7- Average channel impulse responses in the 1st set (level 1, position 2) for three male subjects. −65 male 1 male 2 female 1 female 2
−70
Channel impulse response [dB]
One hundred realizations of the measured channel impulse responses are averaged for each position. We focus only on the first 20 ns of each channel impulse response, since the energy of the channel impulse responses at the human body decays rapidly. Figure 6 compares the average channel impulse responses in the 1st set, level 1, when the antennas are directly attached to the clothes and then when there is a dielectric separation between the body and the antenna. The propagation link is significantly improved with a separation. In Figure 7, one can see that the average channel impulse response of the subject with an aortic implant drops off more quickly. A possible explanation is the scattering caused by the metallic aortic valve. The difference between the average channel impulse responses of male and female subjects is shown in Figure 8. The second peak in the female cases is due to the metal component inside their brassieres. A small effect is also due to their body structure. Figure 9 shows the average channel impulse responses for the 2nd set of measurements (Figure 4). The average channel impulse response when the subject turns the back towards the Rx antenna in the 3rd set of measurements has the smallest gain. A comparison of the re-
−75 −80 −85 −90 −95 −100 −105 −110 0
5
10 Delay [ns]
15
20
Figure 8- The average channel impulse responses in the 1st set (level 1, position 2) comparing male and female subjects.
Table 1 – Different positions for the 1st set (level 1) with corresponding statistical parameters Positions
Mean L [delay bins]
Mean τ RMS [ns]
Positions
Mean L [delay bins]
Mean τ RMS [ns]
Tx at 1
45
0.0746
Tx at 1 with separation
85
0.0691
Tx at 2
22
0.1863
Tx at 2 with separation
43
0.1013
Tx at 3
8
0.4197
Tx at 3 with separation
10
0.1238
Tx at 6
5
0.3241
Tx at 4 with separation
8
0.8964
Tx at 7
24
0.2343
Tx at 5 with separation
6
0.9166
Tx at 8
30
0.0841
Tx at 6 with separation
11
0.1623
male with implant, Tx at 2
8
0.2963
Tx at 7 with separation
51
0.0771
female 1, Tx at 2
32
0.1590
Tx at 8 with separation
83
0.0642
female 2, Tx at 2
31
0.1275
Delay Dispersion Parameter
−40 position 1 position 2 position 3
Channel impulse response [dB]
−50
To evaluate the delay dispersion within the channel the value of interest is the root mean square (RMS) delay spread τ RMS [12]. To calculate it, all measured channel impulse res-
−60 −70
ponses are first truncated above the noise threshold set to four times of the noise standard deviation. The number of paths L above the noise threshold and the mean RMS delay spreads corresponding to the 1st set are summarized in Table 1. It can be seen that τ RMS is smaller for the case with separation.
−80 −90 −100 −110 0
5
10 Delay [ns]
15
20
Figure 9- The average channel impulse responses in the 2ndset −20 nobody in room body in chamber body in room body in room with separation
Channel impulse response [dB]
−30 −40 −50 −60 −70 −80 −90 −100 −110 0
5
10
15
20 25 Delay [ns]
30
35
40
Figure 10- The average channel impulse responses comparing the scenarios in the chamber and in the classroom, when the Tx is at level 1 position 2 Measurements when the Rx antenna is on a pole and with different body postures, i.e., standing, sitting, and lying down in the classroom were also taken. The propagation channel of the lying down posture shows more delay (~3 ns) than the others.
Small Scale Fading In contrast to narrowband systems, the number of multipath components (MPCs) that fall into each resolvable delay bin is much smaller in UWB systems. Therefore, the central limit theorem is not applicable and the amplitudes do not exhibit a Rayleigh or Rice distributions. Thus the propagation channel near human body in WBANs is very distinct than the ones found in other environments. Figure 12 illustrates that the lognormal distribution excellently fits the measured amplitude of the channel impulse responses. This is validated by the Akaike information criterion (AIC) approach [13], where the weights of the candidate models are computed and compared to each other. These results also show that there is high correlation between the delay bins.
Large Scale Fading The path loss in dB versus distance for the 1st set for both cases, with and without separation is plotted in Figure 13. Contrary to the typically exponential path loss, the path loss of the 1st set can be modeled as directly proportional to d ,
PLdB (d ) = PL0 + γ (d − d 0 ) + X σ ; d ≥ d 0 ,
(2)
where d 0 is the reference distance = 10 cm, PL0 is the path loss at the reference distance,
γ
is the slope in units of dB/m,
and X σ is the shadowing (large-scale). The path loss in the case with separation is smaller and has higher slope
γ
. [1] State-of-the-Art Telemedicine/Telehealth: An International Perspective. Mary Ann Liebert, Inc., 2 Madison Avenue, Larchmont, NY 10538.
Empirical CDF
Probability signal amplitude > abscissa
1 0.9
measured log−normal fitting
[2] Coronel P, Schott W, Schwieger K, Zimmermann E, Zasowski T, Maass H, Oppermann I, Ran M, Chevillat P. Wireless body area and sensor networks. Wireless World Research Forum (WWRF) Briefings 2004.
0.8 0.7 0.6
[3] Cramer RJ, Scholtz RA, Win MZ. An Evaluation of the Ultra-wideband propagation channel. IEEE Trans. Antennas Propagation 2002; 50: 561-570.
0.5 0.4
delay bin 5
delay bin 1
delay bin 3
0.3 0.2 0.1 0 −90
−80
−70 −60 Signal amplitude [dB]
−50
−40
Figure 12- The amplitude distribution of the delay bins 1, 3, and 5 in the 1st set (without separation) when the Tx is at level 1, position 1, and the log-normal distribution fitting 150
130 120
Path Loss [dB]
[4] Gezici S, Sahinoglu Z. Theoretical limits for estimation of vital signal parameters using impulse radio UWB. IEEE Communications Society subject matter experts for publication in the ICC 2007 proceedings, 2007. [5] Ghassemzadeh SS, Tarokh V. The ultra-wideband indoor path loss model. Tech. Rep. P802.15 02/277r1SG3a, AT&T Labs, Florham Park, NJ, USA (IEEE P802.15 SG3a contribution, June 2002). [6] Kannan B. Characterization of UWB Channels: Largescale parameters for indoor and outdoor office environment. IEEE P802.15 Working Group for Wireless Personal Area Networks (WPANs) (IEEE 802.15-04-038300-04a, July 2004).
140
110
[7] Fort A, Desset C, Ryckaert J, De Doncker P, Van Biesen L, Donnay S. Ultra wide-band body area channel model. IEEE International Conference ICU 2005; 4: 2840-2844, 16-20 May 2005.
100 90 80
without separation with separation γ = 166.7 γ = 225.0
70 60 50 0.1
References
0.15 0.2 0.25 0.3 0.35 Distance between Tx and Rx antennas [m]
0.4
Figure 13- The path loss versus distance for the 1st set with and without separation
Conclusions We conducted a series of UWB WBAN measurements in the frequency range of 3-11 GHz in scenarios that are expected to be found in medical scenarios. The results highlight the importance, for medical applications, to carry out a comprehensive study of the nature of the signal propagation when they take place close the human body. It was found that for certain scenarios the UWB channel characteristics are distinctively different depending on the gender or the medical condition of the subjects. The measurements obtained in this study are used to estimate channel parameters needed to build communication systems for WBAN medical applications. Acknowledgments The authors wish to thank Hanna Saarela, Elina Hoglund, and Hanna Holopainen for their help with our measurement campaign.
[8] Alomainy A, Hao Y, Yuan Y, Liu Y. Modelling and characterisation of radio propagation from wireless implants at different frequencies. European Conference on Wireless Technology 2006. [9] Zasowski T, Althaus F, Stäger M, Wittneben A, Tröster G. UWB for noninvasive wireless body area networks: channel measurements and results. IEEE Conference on Ultra Wideband Systems and Technologies (UWBST) 2003. [10] Fort A, Desset C, Ryckaert J, De Doncker P, Van Biesen L, Wambacq P. Characterization of the ultra wideband body area propagation channel. International Conference ICU 2006; 22-27. [11] TimeDomain Corporation, n.d., P210 Integratable Module Data Sheet, 320-0095 Rev B, TimeDomain Corporation, Huntsville, AL. [12] Molisch A. Statistical properties of the RMS delay-spread of mobile radio channels with independent Rayleighfading paths. IEEE Trans. Veh. Technol.; 45: Feb. 1996. [13] Schuster UG, Bölcskei H, Durisi G. Ultra-wideband channel modeling on the basis of information-theoretic criteria. Int. Symp. Information Theory (ISIT) 2005; 97101, Sep. 2005.