***The indexes in bold are recommended since they are frequently reported in literatures. The acceptable cut-off values reported by researchers may vary ...
A Handbook on SEM 2nd Edition Zainudin Awang - Universiti Sultan Zainal Abidin
CHAPTER 3
VALIDATING THE MEASUREMENT MODEL: CFA The measurement model of a latent construct: SEM is a confirmatory method providing a comprehensive means for validating the measurement model of latent constructs. The validating procedure is called Confirmatory Factor Analysis (CFA). The CFA method has the ability to assess the Unidimensionality, Validity and Reliability of a latent construct. The researcher needs to perform CFA for all latent constructs involved in the study before modeling their inter-relationship in a structural model (SEM). However, the Unidimensionality assessment should be made first prior to assessing Validity and Reliability. With CFA, any item that does not fit the measurement model due to low factor loading should be removed from the model. The fitness of a measurement model is indicated through certain Fitness Indexes. However the items deletion should not exceed 20% of total items in a model. Otherwise the particular construct itself is deemed to be invalid since it failed the “confirmatory” itself. The researchers could run the CFA for every measurement model separately or run the pooled measurement models at once. However, the CFA for pooled measurement models is more efficient and highly suggested. Thus, this procedure (Pooled-CFA) for assessing the measurement model of latent constructs will be demonstrated. The assessment for each element is done as follows: 1.
Unidimensionality Unidimensionality is achieved when all measuring items have acceptable factor loadings for the respective latent construct. In order to ensure unidimensionality of a measurement model, any item with a low factor loading should be deleted. How low is considered to be “too low” and has to be deleted from the measurement model? a. For a newly developed items, the factor loading for every item should exceed 0.5 b.
For an established items, the factor loading for every item should be 0.6 or higher
The deletion should be made one item at a time with the lowest factor loading item to be deleted first. After an item is deleted, the researcher needs to run the new measurement model. The process continues until the unidimensionality requirement is achieved. Unidimensionality also requires all factor loadings to be positive. 54
A Handbook on SEM 2nd Edition Zainudin Awang - Universiti Sultan Zainal Abidin
2.
Validity Validity is the ability of instrument to measure what it supposed to measure for a latent construct. Three types of validity are required for each measurement model is:
3.
a.
Convergent Validity. This validity is achieved when all items in a measurement model are statistically significant. The convergent validity could also be verified by computing the Average Variance Extracted (AVE) for every construct. The value of AVE should be 0.5 or higher for this validity to achieve. Thus, retaining the low factor loading items in a model could cause the construct to fail Convergent Validity.
b.
Construct Validity. This validity is achieved when the Fitness Indexes for a construct achieved the required level. The fitness indexes indicate how fit is the items in measuring their respective latent constructs. The Fitness Indexes, their respective category, and the level of acceptance are presented in Table 1.
c.
Discriminant Validity. This validity indicates the measurement model of a construct is free from redundant items. AMOS could identify the items redundancy in the model through a discrepancy measure called Modification Indices (MI). High value of MI indicates the respective items are redundant. The researcher could delete one of the identified items and run the measurement model. The researcher could also constraint the redundant pair as “free parameter estimate”. Another requirement for discriminant validity is the correlation between exogenous constructs should not exceed 0.85. The correlation value exceeding 0.85 indicates the two exogenous constructs are redundant or having serious multicollinearity problem.
Reliability Reliability is the extent of how reliable is the said measurement model in measuring the intended latent construct. The assessment for reliability for a measurement model could be made using the following criteria. a.
b.
Internal Reliability – The Internal Reliability indicates how strong the measuring items are holding together in measuring the respective construct. This reliability is achieved when the value of Cronbach’s Alpha exceeds 0.7 (calculated in SPSS). Composite Reliability – The Composite Reliability indicates the reliability and internal consistency of a latent construct. A value of CR > 0.6 is required in order to achieve composite reliability for a construct. (CR is calculated using the given formula). 55
A Handbook on SEM 2nd Edition Zainudin Awang - Universiti Sultan Zainal Abidin
c.
Average Variance Extracted – The Average Variance Extracted indicates the average percentage of variation explained by the measuring items for a latent construct. An AVE > 0.5 is required for every construct (AVE is calculated using the given formula) AVE= ∑ Қ2 / n CR = (∑Қ)2 / [(∑Қ)2 + (∑1- Қ2)]
3.1
Қ = factor loading of every item and n = number of items in a model
EVALUATING THE FITNESS OF A MEASUREMENT MODEL
In SEM, there is several Fitness Indexes that reflect how fit is the model to the data at hand. However there is no agreement among researchers which fitness indexes to use. Hair et al. (1995, 2010) and Holmes-Smith (2006) recommend the use of at least one fitness index from each category of model fit. There are three model fit categories namely Absolute Fit, Incremental Fit, and Parsimonious Fit. The choice of index to choose from each category to report depends on which literature is being referred. The information concerning the model fit category, their level of acceptance, and comments are presented in Table 1. Table 1: The three categories of model fit and their level of acceptance Name of category 1. Absolute fit
Name of index Chi-Square RMSEA
2. Incremental fit
3. Parsimonious fit
Level of acceptance P-value > 0.05 RMSEA < 0.08
GFI
GFI > 0.90
AGFI
AGFI > 0.90
CFI
CFI > 0.90
TLI
TLI > 0.90
NFI
NFI > 0.90
Chisq/df
Chi-Suare/ df < 3.0
***The indexes in bold are recommended since they are frequently reported in literatures
The acceptable cut-off values reported by researchers may vary depending on literatures support they are referring. However, the following table presents the literature support for the widely employed fitness indexes.
56
A Handbook on SEM 2nd Edition Zainudin Awang - Universiti Sultan Zainal Abidin Table 2: The literature support for the respective fitness index Name of category 1. Absolute fit
Name of index Chi-Square RMSEA
Index full name Discrepancy Chi Square
Literature Wheaton et al. (1977)
Root Mean Square of
Browne and Cudeck (1993)
Error Approximation GFI 2. Incremental fit
3. Parsimonious fit
Goodness of Fit Index
Joreskog and Sorbom (1984)
Adjusted Goodness of Fit
Tanaka and Huba (1985)
CFI
Comparative Fit Index
Bentler (1990)
TLI
Tucker-Lewis Index
Bentler and Bonett (1980)
NFI
Normed Fit Index
Bollen (1989b)
Chi Square/Degrees of
Marsh and Hocevar (1985)
AGFI
Chisq/df
Freedom *** One could ignore the absolute fit index of minimum discrepancy chi-square if the sample size obtained for the study is greater than 200 (Hair et al., 1996; Joreskog and Sorbom, 1996).
An example a measurement model of a latent construct is presented in Figure 1
57
A Handbook on SEM 2nd Edition Zainudin Awang - Universiti Sultan Zainal Abidin
3.1.1 MODELING THE MEASURMENT MODEL FOR A SINGLE CONSTRUCT
Response Item Reference Point
Figure 1: The measurement model for measuring Employee Workload consists of nine items
Note: Workload is a latent construct (represented by ellipse). This latent construct is measured using nine questionnaire items namely Q51 1 to Q60 (represented by rectangles since they are observed score). In Figure 1, Q51 to Q60 are the response items for the construct while e1 to e9 are their respective measurement errors. The data (Q51 to Q60) are input into the model through the “click-and-drag” procedure. Through CFA, the researcher instructs AMOS to calculate the standardized estimate and squared multiple correlations by clicking the respective box in the analysis menu. The standardized estimates indicate the factor loading for each item in a measurement model. The output showing the factor loading and squared multiple correlation for every item in a measurement model are presented in Figure 2.
58
A Handbook on SEM 2nd Edition Zainudin Awang - Universiti Sultan Zainal Abidin
Item R2
Response Item
Factor Loading Latent construct
Figure 2: The Factor Loading for every item in the measurement model for Employee’s Workload
Figure 2 presents the factor loading for each item in a measurement model to measure the latent constructs namely workload. The factor loading for a particular item is shown near the arrow pointing to the respective item, while the value shown above each response item is the squared multiple correlation or R2 for that particular item. Any item having a factor loading less than 0.6 and an R2 less than 0.4 should be deleted from the measurement model. However, the researcher may not do so if the fitness indexes for that measurement model already achieved the required level as shown in Table 1 (Index Category and level of acceptance). An item having low factor loading simply means that particular item is deemed useless to measure that particular construct. Keeping useless item in a model will affect the fitness index of the model. An item could have low factor loading due to several reasons. Among the reasons are ambiguous statements, double meaning statement, sensitive statement, biased statement etc
59
A Handbook on SEM 2nd Edition Zainudin Awang - Universiti Sultan Zainal Abidin
3.1.2 MODELING THE MEASURMENT MODEL FOR A POOLED CONSTRUCT Due to certain problems discovered when the researcher analyzes the Confirmatory Factor Analysis (CFA) procedure for every measurement model separately, the author suggest researchers to employ the Pooled-CFA for all constructs. In the Pooled-CFA, all constructs are combined as shown in Figure 3, and the CFA procedure is executed at once. Using Pooled CFA, there is no problem of Model Identification even though certain constructs has less than four items since the combined constructs would increase the degrees of freedom for the model.
Figure 3: The Measurement Model combining all constructs involved in the study
The Pooled Measurement Model in Figure 3 is executed and the output is given in Figure 4
60
A Handbook on SEM 2nd Edition Zainudin Awang - Universiti Sultan Zainal Abidin
Figure 4: The output of CFA illustrates the factor loading for every items, the factor loading for every component (for second order model), and the correlation between the constructs
Figure 4 illustrates the output for Pooled CFA. The model consists of four First-Order constructs namely: i. ii. iii. iv.
Decision Making (measured using 3 items A1-A3) Confidence Cooperative (measured using 3 items B1-B3) Goal Congruence (measured using 3 items C1-C3) Affective Commitment (measured using 9 items D1-D9)
One Second-Order construct namely Entrepreneur Orientation, measured using three subconstructs namely: i. Innovativeness (measured using 3 items) ii. Risk-Taking (measured using 4 items) iii. Networking (measured using 5 items) 61
A Handbook on SEM 2nd Edition Zainudin Awang - Universiti Sultan Zainal Abidin
3.2 THE STEPS IN RUNNING THE CONFIRMATORY FACTOR ANALYSIS (CFA) 1. 2.
Run the Confirmatory Factor Analysis (CFA) for the pooled measurement model Examine the Fitness Indexes obtained for the measurement model Compare with the required level in Table 1. If the indexes obtained do not achieved the required level, then examine the factor loading for every item. Identify the item having low factor loading since these items are considered problematic in the model.
3. 4. 5. 6. 7. 8.
Delete an item having factor loading less than 0.6 (problematic item) Delete one item at a time (select the lowest factor loading to delete first) Run this new measurement model (the model after an item is deleted) Examine the Fitness Indexes – repeat step 3-5 until the fitness indexes achieved. If the Fitness Index is still not achieved after low factor loading items have been removed, look at the Modification Indices (MI) High value of MI (above 15) indicates there are redundant items in the model (The MI indicate a pair of items which is redundant in the model) To solve the redundant items, the researcher could choose one of the following:
Choice 1: a. Delete one of the item (choose the lower factor loading) b. Run the measurement model and repeat the above steps Choice 2: a. Set the pair of redundant item as “free parameter estimate” b. Run the measurement model and repeat the above steps 9. 10.
Obtain the Cronbach’s Alpha, CR, and AVE for every construct in the study Report the normality assessment for remaining items of a construct in the study
Note: The acceptable value of factor loading, the level of fitness indexes, and also the method of modification to the measurement model varies among the literatures.
62
A Handbook on SEM 2nd Edition Zainudin Awang - Universiti Sultan Zainal Abidin
3.3
THE CONFIRMATORY FACTOR ANALYSIS (CFA)
Confirmatory Factor Analysis (CFA) is a special form of factor analysis. It is employed to test whether the measures of a construct are consistent with the researcher’s understanding of the nature of that construct. The CFA procedure replaced the older methods to determine construct validity. Every measurement model of a latent construct needs to undergo CFA before modeling in SEM. Example: Let assume that the model has two exogenous constructs namely X1 and X2, and one endogenous construct namely Y. The representation of the constructs in a schematic diagram is shown in Figure 3. In this study, the researcher is interested to determine the causal effect of two exogenous constructs (X1 and X2) on one endogenous construct, namely Y.
Figure 5: A schematic diagram of a model in the study
Key:
X1 and X2 are latent exogenous constructs (represented by an ellipse) Y is the latent endogenous construct (represented by an ellipse) In this example, the exogenous construct X1 has five items, and the exogenous construct X2
has four items. The measurement model for an endogenous construct, Y has 4 items. The pooledmeasurement model is shown in Figure 4. In Figure 4, the constructs are assembled exactly like its theoretical framework as shown in Figure 5.
63
A Handbook on SEM 2nd Edition Zainudin Awang - Universiti Sultan Zainal Abidin
3.31
Validating the Pooled Measurement Model
The researcher can assess and validate the measurement model of more than one latent constructs at a time. Actually, the measurement model for all constructs involved in the study should be assessed together at once if this is possible. This method is called pooled CFA. However, in many studies, this is not possible when the model has too many latent constructs. In the Pooled CFA, the itemdeletion process is made for every construct by selecting the item having the lowest factor loading in each construct to be deleted.
3.32
The Measurement Model for Pooled Constructs
Figure 4: The Pooled Measurement Model for Confirmatory Factor Analysis (CFA) 64
A Handbook on SEM 2nd Edition Zainudin Awang - Universiti Sultan Zainal Abidin
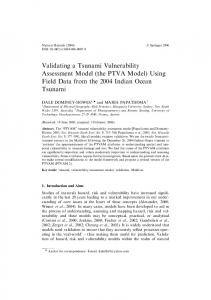
The CFA results showing fitness indexes and factor loading for every item together with its R2 are presented in Figure 5. Using this method the correlations between constructs are computed simultaneously. If one has too many constructs and thus cannot pool them together into one measurement model, he can always pool the constructs into two separate measurement models.
Factor Loading
Fitness Indexes RMSEA, GFI, AGFI, and Chisq/df do not achieve the required level. This is due to some items have low factor loading(less than 0.6). X12 = 0.57, and X24 = 0.53
R2
Correlation between Constructs
Figure 5: The Factor Loading for all items of the respective construct As shown in Figure 5, certain fitness indexes do not achieve the required level. When we examine the factor loading, we found the factor loading for item X12 (from construct X1), and item X24 (from construct X2) are below 0.6. These two “useless items” have caused the measurement model for the constructs to have poor fit. Therefore, one has to drop these two items and run the new measurement
65
A Handbook on SEM 2nd Edition Zainudin Awang - Universiti Sultan Zainal Abidin
model. After the two items (X12 and X24) have been deleted and the new measurement model is run and the result is shown in Figure 6.
Certain index is still not achieved the required level even though X12 and X24 have been deleted
Figure 6: The new factor loading and fitness indexes after the two items were deleted
The fitness index for AGFI (Figure 6) is still below the required level even though the factor loading for all items are above 0.6. Thus, one might suspect that certain items are redundant of each other in the measurement model. The items redundancy can be examined through inspecting the Modification Indexes (MI). Table 3 indicates the MI for a pair of correlated errors which reflect redundant items exist in the model. The MI value of 26.79 is considered high since it is greater than 15.0. The correlated 66
A Handbook on SEM 2nd Edition Zainudin Awang - Universiti Sultan Zainal Abidin
measurement error here is between e12 and e13. If we look at the items, the redundant items are Y3 and Y4. The redundancies between these two items have caused the measurement model to have a poor fit. Table 3: The Modification Indices Presents the Covariance between each Pair of Items. High MI indicates redundancies between that two items
M.I.
Par Change
Comment MI > 15 indicates item Y3 and Y4 are redundant
e12
e13
26.789
0.127
e10
e13
4.643
-0.044
e5
e7
4.568
-0.032
e1
e7
10.890
0.085
The researcher needs to modify the measurement model since the fitness index AGFI does not meet the required level 0.9 due to redundant items. In dealing with redundant items in the model, the researcher has two choices:
Choice 1: to delete one of the two redundant items and run the new measurement model. Choice 2: to set these two correlated measurement errors of redundant items as a “free parameter” and run the new measurement model. Let say, the researcher decides to employ choice 2 for this particular case. The result is presented in the following diagram (Figure 7).
67
A Handbook on SEM 2nd Edition Zainudin Awang - Universiti Sultan Zainal Abidin
The fitness indexes have improved after modification was done for e12 and e13.
Figure 7: The new Measurement Model after e12 and e13 is set as “Free Estimate”
The fitness indexes for the model are assessed in the following table (Table 4). Table 4: The Fitness Indexes for new Measurement Model Name of category 1. Absolute fit
2. Incremental fit 3. Parsimonious fit
Name of index
Index value
Comments
RMSEA
0.065
The required level is achieved
GFI
0.949
The required level is achieved
CFI
0.985
The required level is achieved
Chisq/df
2.332
The required level is achieved
Note: Look how the fitness indexes have improved after the two redundant items are constrained in the model.
68
A Handbook on SEM 2nd Edition Zainudin Awang - Universiti Sultan Zainal Abidin
3.33
ASSESSING THE VALIDITY AND RELIABILITY FOR A MEASUREMENT MODEL
Once the CFA procedure for every measurement model is completed, the researcher needs to compute certain measures which indicate the validity and reliability of the construct and summarize them in a table. As has been said earlier, the assessment for unidimensionality, validity, and reliability for measurement models are required prior to modeling the structural model. The author would like to suggest the following format for reporting the CFA results:
Unidimensionality: This requirement was achieved through the item-deletion procedure for low factor loading items. The new model is run and the item deletion process is repeated until the fitness indexes achieved the required level. Also all factor-loadings have positive values. All processes have been demonstrated. All items have positive factor loading
Validity: This requirement was achieved through the following processes: 1. 1. Convergent Validity:
The Convergent Validity for the measurement model is achieved when all values of AVE exceed 0.50. Table 5 shows all AVE > 0.5
2. Construct Validity:
The Construct Validity for the measurement model is achieved when all Fitness Indexes meet the required level as discussed earlier. Table 4 shows all Fitness Indexes are achieved.
3. Discriminant Validity:
The Discriminant Validity is achieved when all redundant items are either deleted or constrained as “free parameter”. The researcher needs to develop Discriminant Validity index summary as shown in Table 6.
69
A Handbook on SEM 2nd Edition Zainudin Awang - Universiti Sultan Zainal Abidin
Reliability: The two requirement for reliability are 1. Average Variance Extracted:
The AVE values exceeding 0.50 indicate the reliability of the measurement model in measuring the construct.
2. Composite Reliability:
The Composite Reliability is achieved when all CR values exceed 0.60. Refer to Table 5
Table 5: The CFA Report for every construct in the model Construct
Item
Factor Loading
X1
X11
0.60
X12
deleted
X13
0.91
X14
0.88
X15
0.93
X21
0.93
X22
0.96
X23
0.65
X24
deleted
Y1
0.96
Y2
0.98
Y3
0.94
Y4
0.78
X2
Y
CR
AVE
(Above 0.6)
(Above 0.5)
0.904
0.707
0.891
0.736
0.955
0.844
The researcher also needs to compute the Discriminant Validity Index Summary and develop the table as shown in Table 6 to prove the constructs in the model are discriminant of each other.
70
A Handbook on SEM 2nd Edition Zainudin Awang - Universiti Sultan Zainal Abidin
Table 6: The Discriminant Validity Index Summary for the construct Construct
X1
X2
X1
0.83
X2
0.59
0.85
Y
0.56
0.45
Y
0.92
The diagonal values (in bold) is the square root of AVE of the construct while other values are the correlation between the respective constructs. The discriminant validity for all constructs is achieved when a diagonal value (in bold) is higher than the values in its row and column. Referring to Table 6, one can conclude that the discriminant validity for all three constructs is achieved.
3.4 THE ASSESSMENT OF NORMALITY OF THE DATA After the fitness indexes have been achieved, the researcher needs to examine the normality assessment for the data at hand before proceeding to modeling the structural model. Using the final measurement model, select the output box named “test for normality and outliers” in order to assess the distribution for every variable in a dataset. The following table (Table 7) presents the resulted output from the abovementioned procedure. The table presents the normality assessment for every items involved in the measurement model. Table 7: The assessment of normality distribution for items in the respective construct
Variable Y4 Y3 Y2 Y1 X23 X22
min 1.000 1.000 2.000 2.000 1.000 2.000
max 7.000 7.000 7.000 7.000 7.000 7.000
skewness -0.561 -0.786 -0.566 -0.505 -0.690 -0.362
c.r. -2.077 -2.713 -2.116 -1.672 -2.015 -2.632
kurtosis -0.230 0.297 -0.274 -0.429 0.124 -0.165
c.r. -0.837 1.078 -0.995 -1.559 0.450 -0.600 71
A Handbook on SEM 2nd Edition Zainudin Awang - Universiti Sultan Zainal Abidin
Variable X21 X15 X14 X13 X11 Multivariate
min 2.000 2.000 2.000 2.000 1.000
max 7.000 7.000 7.000 7.000 7.000
skewness -0.400 -0.507 -0.535 -0.475 -0.109
c.r. -2.909 -2.683 -2.891 -1.453 -0.792
kurtosis -0.220 -0.386 -0.022 -0.437 -0.158 22.887
c.r. -0.799 -1.403 -0.078 -1.590 -0.574 12.048
The normality assessment is made by assessing the measure of skewness for every item. The absolute value of skewness 1.0 or lower indicates the data is normally distributed. However, SEM using the Maximum Likelihood Estimator (MLE) like Amos is fairly robust to skewness greater than 1.0 in absolute value if the sample size is large and the Critical Region (CR) for the skewness does not exceed 8.0. Meaning, the researcher could proceed into further analysis (SEM) since the estimator used is MLE. Normally the sample size greater than 200 is considered large enough in MLE even though the data distribution is slightly non-normal. Thus, for sample size greater than 200, the researcher could proceed further analysis with the absolute skewness up tp 1.5. Another method for normality assessment is by looking at the multivariate kurtosis statistic. However, SEM using Maximum Likelihood Estimator (MLE) is also robust to kurtosis violations of multivariate normality as long the sample size is large and the Critical Region (CR) for the kurtosis does not exceed 3.0.
If the distribution is found to depart from normality, the researcher could assess the Mahalanobis distance to identify for the potential outliers in dataset. Amos computes the distance for every observation in dataset from the centroid. The centroid is the center of all data distribution. It tabulates the distance of potential outliers from the centroid together with the probability for an observation suspected to be an outlier in the first column and the probability that an observation of similar extremity would occur given a multivariate normal population (the second column). The outlier occurs when the distance of certain observation is too far compared to the majority other observations in a dataset. The deletion of few extreme outliers in the model might improve the multivariate normality. Once the outlier is identified, the researcher could go back to dataset and get 72
A Handbook on SEM 2nd Edition Zainudin Awang - Universiti Sultan Zainal Abidin
them deleted (based on the observation number). The new measurement model is re-specified using the cleaned dataset. The process could be repeated. However, there is no necessity to examine Mahanolobis Distance if the non-normality issue does not arise. As a summary, in the case when the normality assumption is not fulfilled, the researchers still have many options to take. One of them is to remove the non-normal items from the measurement model (based on the measure of skewness) and continue with the analysis. Another option is to remove the farthest observation from the center (outlier) of distribution. However, the most popular method lately is to continue with the analysis with MLE (without deleting any item and also without removing any observation) and re-confirm the result of analysis through Bootstrapping. Bootstrapping is the re-sampling process on the existing dataset using the method of sampling with replacement. The statistical procedure would compute the mean and standard deviation for every sample of size n to create the new sampling distribution. The researcher could instruct Amos to collect 1000 random sample from the dataset and re-do the analysis. Since the sample size is large (1000), the new sampling distribution would be closer to normal distribution. Amos would analyze the Bootstrapping data and produce the confidence intervals as well as the significance for every parameter involved in the analysis. The researcher could compare the actual results with the bootstrapped results to confirm the analysis. If the results differ, the bootstrapped result will be acceptable.
73