Validity and Reliability of the PUSH Wearable Device to Measure Velocity and Power During Loaded Countermovement Jumps Nicholas Ripley & John J. McMahon Directorate of Sport, Exercise and Physiotherapy, University of Salford, Salford, UK
Introduction: The PUSH wearable wireless device has recently been designed specifically for resistance training to provide kinematic and kinetic feedback. Similar technologies already exist but can be limited to certain exercises by the wire connection. Both wired and wireless technologies provide immediate feedback of movement velocity and power during performance, but a wireless device may be seen as more useful in a training environment. Currently, only two studies have determined the validity and reliability of the PUSH band against both 3D motion analysis during the dumbbell (DB) curl and DB shoulder press (2) and a linear position transducer (LPT) during a smith machine back squat (1). The PUSH band demonstrated high levels of validity when compared with 3D motion analysis during the DB curl and DB press for both peak and average velocity (2). During the squat, high reliability was found for both average and peak velocity. High associations were also found between the PUSH band and LPT for both peak (r = 0.91) and average (r = 0.86) velocity, but the values derived for peak and average velocity were significantly lower (p < 0.05) and higher (p < 0.01), respectively, for the PUSH device (1).
Reliability was assessed using intraclass correlation coefficients and coefficient of variation percentages. A dependent t-test was used to compare mean differences in peak velocity and peak power derived from the PUSH band and force platform. The PUSH band’s concurrent validity was tested against the force platform using the Pearson’s correlation (r) coefficient and coefficient of determination (R2). The alpha level was set at P < 0.05.
Aims: The aim of this study was to assess the concurrent validity and reliability of the PUSH band for determining peak velocity and peak power during loaded countermovement jumps (CMJs).
Methods: Eighteen recreationally active sports science students (15 males, 3 females, age = 23.7 ± 6.9 years, body mass 78.7 ± 10kg, height 177.8 ± 6.7cm) performed three maximal effort CMJs with a 20 kg barbell. Each repetition was performed on a Kistler force platform (‘criterion method’) sampling at 1000 Hz whilst subjects wore a PUSH band (‘alternative method’) sampling at 200 Hz on their dominant forearm. PUSH band data was transmitted via Bluetooth to an Android tablet running the PUSH app (Version 1.126, Toronto, Canada). System velocity and power were determined from raw force-time data using forward dynamics. Velocity values registered by the PUSH band were derived by integrating vertical acceleration data (via the in-built accelerometer) with respect to time. Power values from the PUSH band were determined using inverse dynamics with system mass manually inputted into the PUSH app. Peak velocity and peak power values from both systems were taken forward for statistical analysis. Table 1: Descriptive statistics, reliability statistics and correction equations for peak velocity and peak power values attained from the PUSH band and force platform Peak Velocity Method
Mean ± SD -1
(m·s ) Push band
CV%
Peak Power 2
ICC
r (R ) 0.914 (0.836)
2.53 ± 0.24
2.7
0.918
Force Platform 2.23 ± 0.26
3.1
0.927
Mean ± SD (W)
CV%
2
ICC
r (R ) 0.949 (0.900)
3895 ± 1132
6.4
0.932
3635 ± 887
7.2
0.862
Correction Equations Peak power
criterion peak power = (0.743 × (PUSH band peak power value)) – 741.19
Peak Velocity
criterion peak velocity = (0.9943 × (PUSH band peak velocity value)) – 0.2906
SD = standard deviation, CV% = coefficient of variation percentages and ICC = intraclass correlation coefficient
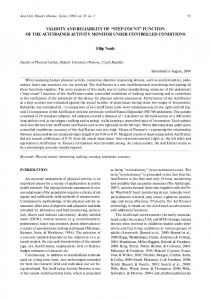
Figure 1: relationship between peak velocity values derived from the PUSH wearable device and the force platform (where CPV = criterion peak velocity and APV = alternative peak velocity).
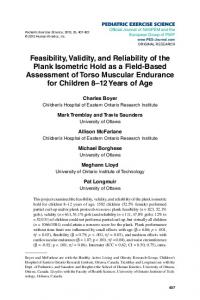
Figure 2: relationship between peak power values derived from the PUSH wearable device and the force platform (where CPP = criterion peak power and APP = alternative peak power)
Results: High levels of within-session reliability of the peak velocity and peak power measurements were found for both the PUSH band and force platform, however, the PUSH band significantly (p < 0.001) overestimated all values compared to the force platform (Table 1). Despite this, positive relationships were found between values attained using both systems with coefficient of determination (R2) values of 0.84 and 0.90 for peak velocity (Figure 1) and peak power (Figure 2) respectively, therefore correction equations were produced (Table 1).
Conclusion: The PUSH band is reliable but overestimates peak velocity and peak power during loaded CMJs in comparison to values obtained from a force platform (‘criterion method’).
Practical Applications: Practitioners may use the PUSH band to monitor peak velocity and peak power during loaded CMJs due to its high reliability, however, the correction equations presented here should be applied to resultant values if data is to be used for normative purposes or compared to force platform derived values.
References: 1.Balsalobre-Fernández C, Kuzdub M, Poveda-Ortiz P, & Campo-Vecino JD. Validity And Reliability Of The PUSH Wearable Device To Measure Movement Velocity During The Back Squat Exercise. J Strength Cond Res, Epub. 2.Sato K, Beckham G, Carroll K, Bazyler C, Sha Z, & Haff G. Validity of wireless device measuring velocity of resistance exercises. J Trainol, 4:15-18, 2015.
@NickJRipley
@
[email protected]
@DrJohnJMcMahon