This article presents results of the first large-scale test of Schmidt and Hunter's. Bayesian validity generalization procedure. This procedure was applied to 56.
Journal of Applied Psychology 1980, Vol. 65, No. 4, 373-406
Validity Generalization Results for Tests Used to Predict Job Proficiency and Training Success in Clerical Occupations Kenneth Pearlman U.S. Office of Personnel Management Washington, D.C.
Frank L. Schmidt U.S. Office of Personnel Management, Washington, D.C., and George Washington University
John E. Hunter Michigan State University This article presents results of the first large-scale test of Schmidt and Hunter's Bayesian validity generalization procedure. This procedure was applied to 56 distributions of validity coefficients drawn from 698 published and unpublished studies representing five clerical job families, 10 test types, and two classes of criteria—job proficiency and training success. Results showed that most of the between-study variation in empirical validity results was accounted for by four statistical artifacts, thus casting serious doubt on the traditional belief that employment test validities are situationally specific. It was also found that in most cases generalization of validity to similar clerical jobs or new settings was justified, even where the hypothesis of situational specificity could not be rejected with certainty. Further, validity generalization could be supported based on corrections for sampling error alone. The correlation between mean test type validities for proficiency and training criteria was found to be high, indicating that contrary to previous belief, similar ability measures are predictive of both criterion types. Implications of these findings are discussed in terms of both practical applications and theory development in industrial-organizational psychology. Our research program on validity generalization has been designed to empirically test one of the orthodox doctrines of personnel psychology: the belief in the situational specificity of employment test validities (Schmidt & Hunter, 1977; Schmidt, Hunter, Pearlman, & Shane, 1979). This belief is rooted in the empirical fact that considerable variability is observed from study to study in raw validity coefficients even when the jobs
and tests studied appear to be similar or essentially identical (Ghiselli, 1966, p. 28). The explanation that has developed for this variability is that the factor structure of job performance is different from job to job and that the human observer or job analyst is too poor an information receiver and processor to detect these subtle but important differences. In the past, most industrial psychologists accepted this explanation and have consequently concluded that empirical validation is required in each situation, and that Portions of this article were presented at the annual validity generalization is essentially imposconference of the International Personnel Management sible (Albrjght, Glennon, & Smith, 1963, p. Association Assessment Council, Atlanta, Georgia, 10 _ > . ... lnf/, ~ 0 /-, • mrc iiA June 1978 18; Ghiselli, 1966, p. 28; Guion, 1965, p. 126). The opinions expressed herein are those of the authors Some industrial psychologists have clearly and do not necessarily reflect official policy of the U.S. perceived the limitations that the situational office of Personnel Management. specificity doctrine imposed on the field. PeST &±TV±^to.T.£JS2 Guion (1976), for example has stated that Center, U.S. Office of Personnel Management, 1900 E inability to solve the problem of validity Street N.W., Washington, D.C. 20415. generalization is perhaps the most serious In the public domain.
373
374
K. PEARLMAN, F. SCHMIDT, AND J. HUNTER
failure of personnel psychology. He points tests by race—provides another highly out that the inability to generalize validities suggestive piece of evidence on this point. makes it impossible to develop the general Single-group validity in samples occurs principles and theories that are necessary when a given test shows a significant validity to take the field beyond a mere technology coefficient for one race but not the other. to the status of a science. Since 1966, hundreds of instances of singleHowever, there is other evidence which group validity have been reported in the suggests that much of the variance in the out- literature. Four different studies have now comes of validity studies for similar jobs and demonstrated that single-group validity does tests may be due to statistical artifacts. not occur any more frequently in samples Schmidt, Hunter, and Urry (1976) have than would be expected solely on the basis shown that under typical and realistic vali- of chance, given no single-group validity at dation conditions, a valid test will show a all in the population (Boehm, 1977; Katzell statistically significant validity in only about & Dyer, 1977; O'Connor, Wexley, & Alehalf of the studies because of inadequate xander, 1975; Schmidt, Berner, & Hunter, statistical power. This fact alone probably 1973). Similar evidence now also exists with explains a great deal of the observed vari- respect to research in the area of differential ability in outcomes from study to study. validity of employment tests by race (HunResearch in a closely related area— ter, Schmidt, & Hunter, 1979; Schmidt, that of single-group validity of employment Pearlman, & Hunter, in press). Further dis-
0
50
True-Score Correlation
o
.39
50
A. Criterion Reliability Differences
.45
0
B. Test Reliability Differences
A+B+C +N=100
.50
0
.33 C. Range Restriction Differences
A+B+C +N=150
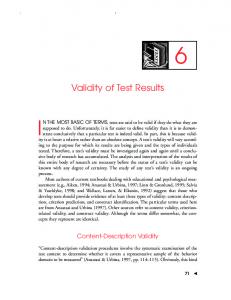
Figure 1. Observed variation in validity coefficients created by differences between studies in proficiency criterion reliability, test reliability, and range restriction and by sampling error when the truescore correlation is invariant at .50.
.50
VALIDITY GENERALIZATION RESULTS FOR CLERICAL OCCUPATIONS
cussion of the latter phenomenon may be found in Bobko and Bartlett (1978), Boehm (1978), Hunter and Schmidt (1978), Katzell and Dyer (1978), and Linn (1978). The unavoidable conclusion is that psychologists were busy studying and researching phenomena that did not exist, phenomena created solely by statistical artifacts. The same may be true in the case of the doctrine (or more appropriately, the hypothesis) of situational specificity of employment test validities. The observed variability may be due entirely, or almost entirely, to statistical artifacts. Why this might be true is illustrated in Figure 1. This figure shows what the observed variability in validity coefficients across studies would be if in fact the truescore correlation between a test and a criterion of job proficiency were equal to .50 in each setting and all variability in results from study to study was due solely to various statistical artifacts. The first distribution in the top row of Figure 1 shows the variability to be expected if only the artifact of differences between studies in criterion reliability were operating. The distribution of proficiency criterion reliabilities assumed is shown in Table 1. The second distribution in the top row of Figure 1 shows variability to be expected if only the artifact of differences between Table 1 Assumed Distribution of (Unrestricted) Proficiency Criterion Reliabilities Across Studies Reliability
Relative frequency
.90 .85 ,80 .75 .70 .65 .60 .55 .50 .45 .40 .35 .30
3 4 6 8 10 12 14 12 10 8 6 4 3
Note. Expected value (proficiency criterion reliability) = .60.
375
Table 2 Assumed Distribution of (Unrestricted) Test/Training Criterion Reliabilities Across Studies Reliability
Relative frequency
.90 .85 .80 .75 .70 .60 .50
15 30 25 20 4 4 2
Note. Expected value (test/training criterion reliability) = .80.
studies in test reliability were operating. The distribution of test reliabilities assumed is shown in Table 2. (This distribution is additionally used as the assumed distribution of training criterion reliabilities in analyses presented and discussed later.) The third distribution in the top row of Figure 1 shows variability to be expected if only the artifact of differences between studies in degree of range restriction were operating. Range restriction values used in the computations are shown in Table 3. The single distribution in the second row of Figure 1 shows the variability produced by the three artifacts in the top row operating simultaneously. The distributions in the third row show how artifactual variance increases still further when ordinary sampling error is added. The three distributions in this row illustrate expected variability when studies are all based on sample sizes of 50, 100, and 150, respectively. The distributions based on Ns of 50 and 100 are probably the most realistic. Sample sizes in published validity studies average about 68 (Lent, Aurbach, & Levin, 1971). In unpublished studies, the average is probably lower (Guion, 1965, p. 126). When N = 50, the standard deviation expected from artifacts alone is .164; when N = 100, this value is . 126. We shall see later that these values are very close to empirically observed values. When considered together with the uncorrected validity distribution mean of .21, these are exactly the type of validity results typically observed in the literature (cf. Ghiselli, 1966, p. 29), results which have led
376
K. PEARLMAN, F. SCHMIDT, AND J. HUNTER
Table 3 Assumed Distribution of Range Restriction
Effects Across Studies Prior selection ratio SD of test 1.00 .70 .60 .50 .40 .30 .20 .10
Relative frequency
10.00 7.01 6.49 6.03 5.59 5.15 4.68 4.11
5 11 16 18 18 16 11 5
Note. Expected value (SD) = 5.945.
most psychologists to conclude that validities are situationally specific. It is also interesting to note that based on these distributions, validities of less than .21 would be observed about half of the time. Such outcomes would often lead to erroneous conclusions that the predictors in question would be of little practical utility in selection. Figure 1 illustrates the effects of only four artifactual sources of variance: differences between studies in criterion reliability, differences between studies in test reliability, differences between studies in range restriction, and sampling error (i.e., variance due to N < «=). There are at least three additional artifactual sources of variance: differences between studies in amount and kind of criterion contamination and deficiency (Brogden & Taylor, 1950), computational and typographical errors (Wolins, 1962), and slight differences in factor structure between tests of a given type (e.g., arithmetic reasoning tests). As we will see later, it is difficult if not impossible to correct for the latter three sources. The full variancecomponents model resulting when all of the above sources of artifactual variance are considered is outlined in the appendix. Conceptually, a test of the situational specificity hypothesis is quite simple. If, for example, a researcher had 100 validity coeficients relating tests of perceptual speed to proficiency in clerical work, he or she would need only to compute the variance of this distribution and subtract variance due to each of the above artifactual sources from this total variance. If the remaining variance
were essentially zero, the hypothesis of situational specificity would be rejected. If this were the case, validity generalization obviously would no longer be a problem, since the observed variation in validity results would have been shown to be entirely a result of the operation of statistical artifacts. It is important to note, however, that validity generalization can be justified in many cases even if the remaining variance is not zero. That is, validity generalization can be justified in many cases in which the hypothesis of situational specificity cannot be definitively rejected. After correcting the mean of the empirical validity distribution for attenuation due to criterion unreliability and for range restriction (based on average values of both), and after properly correcting the standard deviation, it may become apparent that a very large percentage, say 90%, of all values in the distribution lie above the minimum useful level of validity. In such a case, one could conclude with 90% confidence that true validity would be at or above this minimum level in a new situation involving this test type and job without carrying out a validation study of any kind. All that would be necessary is sufficient job analysis information to insure that the job in question is indeed a member of the occupation or job family on which the validity distribution was based. Furthermore, recent research has shown that such a job analysis need not be extremely detailed or complex; it is only necessary to be able to assign a job to its general occupational grouping (e.g., clerical work; Schmidt, Hunter, & Pearlman, in press). Even in cases in which the mean of the corrected distribution is too low and/or the variance is too great to allow conclusions of this kind, the corrected distribution will still be useful—as the prior distribution in an empirical Bayesian study of the test's validity. The advantages of employing a Bayesian approach to test validation are described in Schmidt and Hunter (1977). Without reiterating these here, we will simply note that the present validity generalization procedure circumvents the only major source of controversy surrounding Bayesian statistics, namely, the use of subjective prior distributions. In our procedure the
VALIDITY GENERALIZATION RESULTS FOR CLERICAL OCCUPATIONS
prior distributions (also referred to as priors in this article) are entirely data based, incorporating the results of all available previous studies on a particular test and job. (See Novick & Jackson, 1974, and Novick, Note 1, for treatment of other potential applications of Bayesian methods to testing.) By incorporating the corrected distribution of validity coefficients as a Bayesian prior distribution, this procedure directly relates methods of data analysis used in making inferences about validity in criterion-related validity studies to the concept of validity generalization. The generalizability of validity is seen to be a matter of degree and is quantified in the properties of the prior distribution. Examination of these properties produces a direct answer to the question of whether validity generalization is justified or not without a situation-specific empirical validation study. If such generalization is justified, the (often high) cost of an empirical validation study is avoided. If it is not justified, the theory presented here provides an improved model and method for data analysis and decision making in the required empirical validation study. Our previously published studies have provided promising evidence for the generalizability of test validities. Schmidt and Hunter (1977) applied an initial version of their procedure to four empirical validity distributions presented by Ghiselli (1966, p. 29). Results showed that an average of nearly half of the observed variability in these distributions was accounted for by three statistical artifacts. A conclusion of validity generalization was justified for two of the four distributions. (Schmidt, Hunter, Pearlman, & Shane, 1979, describe and correct an error made in the application of the initial Schmidt-Hunter procedure that, however, did not result in a change in any of the conclusions drawn in the original study.) Schmidt, Hunter, Pearlman, and Shane (1979) applied an improved version of the procedure to 11 validity distributions representing two clerical job families and three validity distributions for the job of first-line supervisor. Four statistical artifacts were found to account for an average of more than 60% of the variance in these distributions, and the data supported a conclusion of valid-
377
ity generalization for all but possibly two of these distributions. The purpose of the present study is to add to the cumulative evidence regarding the situational specificity hypothesis and validity generalization. Further, this study extends our previous research in several important ways. First, clerical job families are defined in terms of a more current job classification system than that used by Schmidt, Hunter, Pearlman, and Shane (1979). Second, 21 new distributions of validities based on job proficiency criteria are analyzed, in addition to the 11 previously examined by Schmidt, Hunter, Pearlman, and Shane. Third, the present study also includes analyses of 24 validity distributions based on criteria of training success. Fourth, an analysis is presented that addresses the robustness of the assumptions and results produced by the validity generalization procedure used. Finally, analyses of the relationship between validity coefficients for job proficiency and for training criteria, which could not be performed in previous studies because of insufficient data, are presented. In addition, the present study includes an expanded appendix that provides more detailed information on our computational procedures and their underlying assumptions than has been given in previous studies. Method Compilation of Validity Distributions The process of compiling a data base of sufficient scope and size to permit a large-scale test of the procedure was undertaken in two stages: First, we developed a classification and coding system that would enable us to capture all potentially relevant data from validity studies; then we made an extensive search of published and unpublished validity studies and recorded the information in these studies according to our coding system. We selected clerical occupations as one of our initial areas of investigation because of the large number of validity studies known to have been conducted on such occupations. Tests were classified using a system partially adapted from Ghiselli (1966, pp. 15-21) and Dunnette (Note 2). Ten general categories of test types were established, most of which represent a construct or ability factor found in the psychometric literature (e.g., verbal ability, quantitative ability, perceptual speed). Categories for general mental ability tests (consisting of verbal, quantitative, and abstract reasoning or spatial ability
378
K. PEARLMAN, F. SCHMIDT, AND J. HUNTER
components), so-called "clerical aptitude" tests (consisting of verbal, quantitative, and perceptual speed components), motor ability tests (consisting of various measures of finger, arm, and hand dexterity and motor coordination), and performance tests (e.g., typing or dictation) were included because of their relatively common use in clerical selection, even though they can be decomposed (e.g., using factor analysis) into more homogeneous constituent dimensions. Within each general test type category, codes were developed for the specific item types most commonly used as measures of that factor or test type (e.g., the verbal ability test type category included such item type categories as reading comprehension, vocabulary, grammar, spelling, and sentence completion). (Operational definitions of the 10 test type categories and the item types included in each are provided by Pearlman, 1979.) Clerical jobs were classified using a slightly modified version of the Dictionary of Occupational Titles (DOT) classification system (Pearlman, 1979; U.S. Department of Labor, 1977). In this system, clerical jobs were grouped into five "true" job family categories (DOT Occupational Divisions 20,21,22, and 23, plus Occupational Groups 240-248 of Occupational Division 24), one miscellaneous category (DOT Occupational Group 249), and two additional categories developed to handle clerical occupations that were not sufficiently specified in the original study to permit definitive classification (e.g., those designated simply as "clerical jobs") and samples representing two or more different clerical occupations. Other items of information that were either coded or recorded in raw numeric form included the correlation coefficient; the type of correlation coefficient; sample size; sample composition in terms of employment status, sex, and race; the mean and standard deviation of test scores; the criterion measure used; criterion reliability; and the type of validation strategy employed. A separate index card file was established to record narrative background information on each validity study from which data were taken. Such information included the original source of the study, the date of the study, the names of the specific tests used, the reported job title and its complete DOT code, and the firm or type of organization in which the study was conducted. We collected data only from studies that met certain requirements, including the reporting of (a) validity results in the form of a bivariate correlation coefficient (unconnected for either attenuation or range restriction, since these corrections are made in the model), (b) sufficient information to classify the test and job studied, (c) sample size, and (d) sufficient information to classify the criterion as a measure of either job proficiency (e.g., supervisory ratings, production data, work samples) or training success (e.g., grades in training school, instructors' ratings, achievement tests). Data from studies using such criteria as turnover, absenteeism, and tardiness were not included. We also excluded data from studies using criteria such as ratings or grades in a vocational or other school unless the school was part of an organization's formal training program. In collecting and recording data from validity studies, we established a number of decision rules regarding
what data to record when validity for a particular sample was reported for two or more predictors (item types) in the same test type category, multiple or multidimensional criteria, or different subgroups as well as the total sample. Since such phenomena would be likely to affect the independence of validity coefficients within the prior distributions to be developed from these data, it was necessary to set up systematic and consistent procedures for recording and identifying such data. In studies that reported, for a given sample, validity coefficients for two or more predictors belonging to the same test type category (e.g., several types of verbal tests), each such coefficient was recorded, Similarly, in studies that reported, for a single sample, test validity for more than one proficiency or training criterion measure (e.g., several proficiency measures, such as production data, performance ratings, and a job knowledge test), each such coefficient was recorded. Such phenomena did not arise very frequently. Having such data available allowed for the possibility of subsequent compilation into more specific prior distributions, that is, distributions for specific item types rather than general test types and specific criterion measures rather than broad criterion categories. Further, the inclusion of validity coefficients that are not independent would have the effect of increasing the error variance of validity distributions. Since this source of error variance is not subtracted from the total variance when the effects of statistical artifacts are removed, the inclusion of nonindependent validities contributes to undereorrection of the total variance, and hence to conservativeness, in these procedures. In studies that reported test validities for several dimensions of a particular criterion measure (e.g., supervisor ratings on quality of work, quantity of work, and initiative) and one of these dimensions was an overall or summary dimension (e.g., ratings on overall job performance or the total of ratings on all individual dimensions), only the coefficient for the overall or summary dimension was recorded. For cases similar to this, with no overall or summary dimension, we recorded the average validity for the several dimensions and recorded as the sample size to be used in the data analysis the product of the original sample size and the number of dimensions averaged. In studies that reported validity for different sex or racial subgroups of a sample in addition to reporting validity for the total sample, only the subgroup data were recorded. All recorded data to which one or more of the above rules applied (which amounted to about 12% of the validity coefficients based on proficiency criteria and 4% of those based on training criteria) were specially coded for later identification and separate analysis if necessary. The data collection process included an extensive search for both published and unpublished validity studies of clerical jobs. In addition to a thorough search of the published literature, we reviewed most of the major commercial test manuals for validity information, utilized computer search services, called and wrote test publishers to obtain unpublished validity data, and contacted research groups, private consulting firms, individual psychologists, and government and military personnel psychologists. We ultimately sue-
VALIDITY GENERALIZATION RESULTS FOR CLERICAL OCCUPATIONS ceeded in locating 3,368 validity coefficients for a variety of clerical jobs and tests. These represented 698 independent samples, approximately two thirds of which came from unpublished studies. Of the 3,368 coefficients, 2,786 are based on overall job proficiency or performance criteria, and 582 are based on criteria of training success.
Data Analysis Following compilation, the validity data were keypunched, entered into a computer file, and sorted into frequency distributions according to the job, test type, and criterion categories into which they had been classified. The distribution of validity coefficients across the eight job categories and 10 test types for both proficiency and training criteria is shown in Table 4. For purposes of this study, we limited our analyses to distributions of proficiency criterion validities containing at least 10 coefficients and distributions of training criterion validities containing at least 8 coefficients. Application of these decision rules to the five true job families (A-E) shown in Table 4 yielded 32 distributions of validities based on proficiency criteria and 24 distributions of validities based on training criteria that were sufficiently large to permit analysis as described later. We also analyzed the validity distributions resulting from combining validity coefficients for a given test type across the five true job families, as well as across all eight job categories. From the Bayesian point of view, there is no theoretical basis for imposing a lower limit on the number of coefficients required for analysis using the present validity generalization procedure. This is because a
379
Bayesian prior distribution is weighted according to its information value, which is indexed only by its variance. (The information value of a prior is the reciprocal of its variance.) Though the variance is essentially independent of the number of coefficients, the number of coefficients is a nonlinear index of the amount of confidence one can have in the estimate of information value provided by the variance (Schmidt & Hunter, 1977). In other words, the amount of sampling error in the estimate of the variance of the prior increases as the number of coefficients in the prior decreases. Thus, the setting of any minimum number of coefficients for analysis with the present procedure will always be somewhat arbitrary. However, we felt it desirable to establish such minimums to partially control for the accuracy of the priors. A lower minimum was set for validity distributions based on training criteria than those based on proficiency criteria because the former are characterized by higher mean sample sizes and are thus more reliably determined. When interpreting the results presented later, it should be remembered that priors based on larger numbers of coefficients will, on the average, be more accurate representations of reality than priors based on relatively small numbers of coefficients. To compute the observed mean and observed variance of each of the empirical validity distributions, each coefficient was weighted by its associated sample size to produce more accurate estimates of these two parameters. As required by consistency, the correction for variance due to sampling error was therefore a weighted average of the sampling error across studies (see the appendix for computational formulas). This correction produces underestimates of sampling error for biserial, triserial, and tetrachoric coefficients be-
Table 4 Frequency of Compiled Validity Coefficients by Test Type and Job Category Job category
D
Test type General Mental Ability Verbal Ability Quantitative Ability Reasoning Ability Perceptual Speed Memory Spatial/Mechanical Ability Motor Ability Performance Clerical Aptitude Totals
76/16 215/16 155/26 36/10 368/28 49/3 38/19 95/2 55/7 63/4
47/17 97/38 121/36 29/7 251/61 39/0 47/21 97/4
7/13 28/26 33/22 10/8 50/29 11/0 12/16 21/2
6/0 26/16
0/0 5/8
1,150/131
760/200
177/124
4/9
10/6
7/0
6/10 7/11
9/7
14/0 16/0
17/7
H
Totals
30/3 62/4 83/4 21/0 116/4
13/1 19/1 21/1
6/0 0/0 6/0 1/0
2/0 1/1 3/0 5/0 5/1
194/65 450/102 453/107 116/25 882/158 117/3 108/64 257/12 67/7 142/39
116/6
2,786/582
0/0
5/0
6/0
10/25
23/10
26/0
0/0 4/3
3/0 6/4
12/3
21/1
0/0 0/2
0/0 0/4
7/0 0/0 2/0 0/0 4/0
39/4
43/63
94/39
82/0
364/19
9/0 38/1
Note. Frequencies to the left of slashes represent validity coefficients computed on criteria of job proficiency; those to the right represent coefficients computed on criteria of training success. Job category codes are A = stenography, typing, filing, and related occupations (DOT Occupational Groups 201-209), B = computing and account-recording occupations (DOT Occupational Groups 210-219), C = production and stock clerks and related occupations (DOT Occupational Groups 221-229), D = information and message distribution occupations (DOT Occupational Groups 230-239), E = public contact and clerical service occupations (DOT Occupational Groups 240-248), F = miscellaneous clerical occupations (DOT Occupational Group 249), G = unspecified clerical occupations, and H = mixed samples.
380
K. PEARLMAN, F. SCHMIDT, AND J. HUNTER
cause these coefficients have substantially larger standard errors than the various forms of the Pearson correlation (e.g., phi and the point biserial). Approximately 10% of the coefficients based on proficiency criteria and 2% of those based on training criteria were biserial, triserial, or tetrachoric rs. The information necessary to determine actual values of criterion reliability, test reliability, and range restriction was not presented in the majority of the research studies from which we collected validity data. We thus had t« rely on reasonable assumed distributions of these effects across studies. The distributions of criterion reliabilities, test reliabilities, and range restriction effects assumed in the analyses of validity distributions based on proficiency criteria are those shown in Tables 1,2, and 3, respectively. The assumed distributions of proficiency criterion reliabilities and test reliabilities (Tables 1 and 2) refer to reliabilities in the applicant population, that is, reliabilities corrected for restriction in range (cf. Schmidt et al., 1976). The same assumed distributions of test reliabilities and range restriction effects (Tables 2 and 3) were also used in the analyses of validity distributions based on training criteria. However, an assumed distribution of criterion reliabilities with a higher expected value than that in Table 1 was required for these distributions. This was necessary to reflect the higher expected reliabilities of the types of criterion measures associated with these validity distributions. Typically, these were such measures as written achievement or knowledge tests or final training school grades determined largely on the basis of such tests. Therefore, the assumed distribution of test reliabilities shown in Table 2, with its expected value of .80, was also used as the distribution of criterion reliabilities assumed in the analyses of validity distributions based on training criteria. This distribution also refers to unrestricted training criterion reliabilities. The expected values of the assumed distributions shown in Tables 1,2, and 3 were based on the best estimates of such effects available from the research literature and test manuals. These expected values are probably somewhat conservative (i.e., slightly overestimated), leading to undercorrection of the mean of a validity distribution. For example, as Schmidt and Hunter (1977) have pointed out, .60 is probably a conservative estimate of average proficiency criterion reliability because such reported reliabilities are typically overestimates of the appropriate kind of reliability (interrater reliability across a reasonable time interval). A similar line of reasoning applies to the expected value of assumed training criterion reliabilities. This expected value is additionally conservative to the extent that such criteria as instructors' ratings or rankings (i.e., criteria with reliabilities of considerably lower expected values than written test scores) were used in validity studies of clerical training programs. Regarding the assumed distribution of range restriction effects, Schmidt and Hunter (1977) discuss in their Appendix D why our use of Thorndike's (1949) Case II formula leads to underestimates of the effect of this artifact when correcting the mean of a validity distribution. In addition, although such data are rarely reported in research studies, the selection ratio of about .50 on which
the expected value of this distribution is based is probably higher than is typically found in most organizations that employ sufficient numbers of persons in any one job to carry out a validation study. Once reasonable expected values were determined for the effects of these artifacts, specific distributional values and relative frequencies were developed, assuming approximate normality of these effects across studies. (However, the ceiling effect created by assuming an expected value of .80 for the distribution in Table 2 dictated that this distribution be somewhat negatively skewed.) This appeared to be the most reasonable assumption to make in the absence of the necessary empirical data. It is only by accumulation of such data that the appropriateness of these distributional assumptions can ultimately be verified. However, results presented later in this article show that conclusions regarding validity generalization are not likely to be affected by even gross inaccuracies in these assumptions. The procedures by which we computed estimates of variance due to between-study differences in criterion reliability, test reliability, and range restriction effects for each validity distribution are presented in the appendix. After computation, all four estimates of artifactual variance (the above three sources plus variance due to sampling error) were subtracted from the observed variance, providing an estimate of residual variance, the square root of which is the residual SD. The residual variance (or the residual SD) estimates the effects of true situational differences, that is, variance due to true differences between jobs in the factor structure of performance (ignoring the effects of artifacts not corrected for). The appendix also elaborates the rationale for our assumption of independence of artifactual sources of variance across studies, making possible the use of the additive variance-components model in estimating true situational variance. Following the above corrections to the variance of each validity distribution, the mean of each residual distribution was then corrected for range restriction and attenuation due to criterion unreliability, using the expected values of these artifacts as shown in Tables 1, 2, and 3. (As noted earlier, the expected value used to make the latter correction in validity distributions for training criteria was .80, based on the distribution in Table 2.) This value is then the mean of the Bayesian prior distribution, p. (Our computer program first computes the fully corrected mean validity, i.e., the mean validity corrected for both of the above artifacts plus attenuation due to average test unreliability—.80 in the present study—and then attenuates the fully corrected mean by the square root of .80. This produces, in effect, a mean validity corrected for just the first two artifacts but not for test unreliability. The computations are carried out in this manner, however, to permit tailoring of the Bayesian prior distribution to specific tests of known reliabilities, which may be different from the average test reliability assumed in computing the fully corrected mean validity. In this study we assume for convenience that priors will be applied to tests having a reliability of .80—the same value as the average assumed test reliability. This point is further discussed later in this article and has also
VALIDITY GENERALIZATION RESULTS FOR CLERICAL OCCUPATIONS been explained by Schmidt & Hunter, 1977, pp. 533-534.) The SD of each of the Bayesian priors (SD/,) was computed next. This calculation requires that in effect, all values of the residual distribution be corrected by the same factor by which the uncorrected mean validity is increased to obtain the mean of the Bayesian prior. Since multiplying all values of a distribution by a constant increases the SD of that distribution by the same constant, SDp was computed by multiplying each distribution's residual SD by the ratio p/f, in which p = the estimated true validity of the distribution (i.e., the mean of the Bayesian prior) and r = the uncorrected mean validity of the distribution. The assumptions underlying this method of computing SDp are explained in the appendix. It can be noted, however, that for technical reasons also explained in the appendix, 5D/> is very accurately—but still conservatively—estimated by this method. On obtaining the SD of each Bayesian prior, the value at the 10th percentile of each such distribution was computed by multiplying this SD by 1.2816 and subtracting this value from p. A computer program was written to perform all of the above computations. Unlike the previous validity generalization studies (Schmidt & Hunter, 1977; Schmidt, Hunter, Pearlman, & Shane, 1979), these computations were carried out in r, rather than Fisher's z, form. Fisher's z transformation was used in previous studies to insure that sampling error would be independent of validity magnitudes and would depend only on sample size. Callender, Osburn, and Greener (Note 3), however, have shown in simulation studies that the formula for the sampling error of r used in the present study is quite accurate. There is thus no real advantage to using Fisher's z. Furthermore, although it is not generally known, the sampling distribution of r is approximately normal for all but very extreme values of the population correlation. (This point is further discussed in Schmidt, Hunter, & Pearlman, in press.) Other than the fact that computations have been carried out in r form, the data-analytic procedures used in this study are the same as those used in Schmidt, Hunter, Pearlman, and Shane (1979). Before finalizing our results, we checked both the effects of our decision rules for recording and specially coding nonindependent data (described earlier in this section) and the effects of including biserial, triseriaj, and tetrachoric rs in our data base. Distributions of both proficiency and training criterion validities for each test type combined across all job categories were used for this purpose. These distributions were analyzed with and without the specially coded data and with and without biserial, triserial, and tetrachoric rs. Analysis of the proficiency criterion distributions confirmed that the effects of including such data were, on the average, slightly conservative, as we had anticipated. That is, estimates of SDp were generally larger and 90% credibility values generally smaller when such data were included. However, these effects were very small. There were virtually no effects on the results for the training criterion distributions. As a result of these analyses, all specially coded data, as well as biserial, triserial, and tetrachoric rs, were retained for the analyses carried out in this study.
381
We also checked on the appropriateness of assuming the same mean level of range restriction effects (see Table 3) for both predictive and concurrent validation results. If, for example, mean observed validities were significantly higher in predictive than concurrent studies for the same types of tests, this could represent the effects of differential range restriction in the two types of studies and might necessitate different range restriction assumptions for validities drawn from different types of studies. However, analysis of predictive versus concurrent mean observed validities for each of the 10 test types (using proficiency criterion data cumulated across all job categories) revealed that this was not the case. For 4 test types, the mean concurrent validity slightly exceeded the mean predictive validity; for 5 test types the reverse was true; and for 1 test type the means were essentially identical for the two types of studies. The unweighted average of the mean validities across test types rounded to an identical .21 for both predictive and concurrent studies. The weighted (by total sample size for each test type) averages were .23 and .21 for predictive and concurrent studies, respectively. There was thus no appreciable difference in observed validities for the two types of studies. (A more detailed report of this aspect of our research is in preparation; see Note 4.) No corrections have been made in our research for differences between studies in amount and kind of criterion contamination or deficiency, for computational and typographical errors, or for slight differences between tests in factor structure. Computational and typographical errors are much more frequent than psychologists usually assume. Wolins (1962) found serious computational errors in nearly half of the data sets he was able to obtain and analyze. But it is difficult to estimate the frequency or magnitude of such errors and thus difficult to correct for them. In the case of criterion deficiency or contamination, corrections would be even more difficult. Under special circumstances, it might be possible to estimate variance due to slight differences between tests in factor structure (Schmidt & Hunter, 1977), but such estimates will rarely be possible. However, not correcting for these sources of error insures a conservative procedure; that is, the corrected (residual) variance tends to overestimate rather than underestimate variance due to true situational differences. (For technical reasons described in the appendix, our procedures would lead to underestimates of residual variance if only the four artifacts we correct for were operative in observed validity distributions; however, the net effect of not correcting for all potential sources of error variance is expected to be conservative.) We stated earlier that the situational specificity hypothesis is rejected when the residual variance of a validity distribution is essentially zero. Because of the conservative biases noted earlier and elaborated in the appendix, such a decision rule is scientifically inappropriate in practice. An appropriate decision rule must take into account the fact that our procedure does not provide an optimal test of the situational specificity hypothesis, since it corrects for only four of the seven artifactual sources of variance. In this study we therefore adopt the more realistic decision rule that the
382
K. PEARLMAN, F. SCHMIDT, AND J. HUNTER
Table 5 Results Relevant to the Situational Specificity Hypothesis: Proficiency Criterion Distributions
Test type/Job category"
Total N
No. r&
r
Observed SD
Predicted SD
%of variance accounted for
4,847 4,432 10,564 17,539
76 47 10 144 194
.24 .23 .21 .24 .26
.177 .167 .118 .166 .170
.133 .119 .130 .128 .121
56 51 100 59 51
.117 .117 .000 .106 .119
18,227 6,712 1,331 27,352 39,187
215 97 28 355 450
.19 .20 .18 .19 .18
.160 .174 .132 .161 .160
.117 .128 .150 .122 .115
53 54 100 58 52
.110 .117 .000 .105 .110
13,658 9,001 1,347 1,271 25,850 39,584
155 121 33 17 333 453
.23 .25 .30 .21 .24 .23
.136 .152 .172 .080 .142 .137
.121 .131 .165 .129 .128 .121
80 74 93 100 80 77
.061 .078 .045 .000 .063 .065
3,069 1,240
36 29 10 80 116
.18 .32 .14 .21 .18
.116 .174 .145 .147 .131
.118 .163 .118 .130 .110
100 87 66 78 70
.000 .062 .084 .068 .072
368 251 50 10 23 702 882
.22 .24 .22 .19 .18 .22 .22
.170 .150 .125 .156 .137 .161 .163
.124 .134 .138 .118 .126 .128 .124
53 80 100 57 84 63 58
.117 .067 .000 .103 .055 .097 .105
49 39 11 102 117
.18 .20 .21 .19 .18
.156 .119 .146 .144 .150
.125 .147 .130 .132 .128
65 100 79 85 72
.093 .000 .068 .056 .079
38 47 12 107 108
.09 .20 .23 .14 .14
.113 .152 .156 .145 .145
.097 .122 .154 .112 .112
74 64 96 60 60
.057 .092 .030 .092 .091
1,360 19,782 21,277
95 97 21 12 21 246 257
.14 .14 .13 .07 .12 .13 .14
.164 .130 .112 .160 .116 .144 .152
.116 .112 .120 .119 .127 .116 .115
50 75 100 56 100 64 57
.116 .065 .000 .106 .000 .086 .100
4,416 5,316 6,265
55 61 67
.24 .22 .21
.244 .233 .236
.122 .117 .112
25 25 23
.210 .201 .208
Residual SD
General Mental Ability
A B E A-E A-H
718
Verbal Ability
A B C A-E A-H Quantitative Ability
A B C E A-E A-H Reasoning Ability
A B C A-E A-H
739 5,377 11,586
Perceptual Speed
A B C D E A-E A-H
28,824 17,043 2,951
878 1,665 51,361 70,935
Memory
A B C A-E A-H
3,323 1,970
726 6,278 7,764
Spatial/Mechanical Ability
A B C A-E A-H
4,247 3,782
A B C D E A-E A-H
7,662 8,405 1,521
Motor Ability11
537 9,240 9,306
834
Performance tests
A A-E A-H
VALIDITY GENERALIZATION RESULTS FOR CLERICAL OCCUPATIONS
383
Table 5 (continued)
Test type/Job category" Clerical Aptitude0 A B A-E A-H
Total N
No. rs
f
Observed SD
Predicted SD
%of variance accounted for
4,127 1,674 5,989 11,927
63 26 94 142
.24 .26 .25 .23
.171 .187 .174 .166
.132 .136 .135 .121
60 53 60 53
.149 .162 .161
.129 .125 .118
Ms for individual job family distributions Ms for true job family (A-E) distributions Ms for all job category (A-H) distributions
Residual SD
.108 .128 .110 .114 .069 .098 .106
a Job categories are A = stenography, typing, filing, and related occupations (DOT Occupational Groups 201209), B = computing and account-recording occupations (DOT Occupational Groups 210-219), C = production and stock clerks and related occupations (DOT Occupational Groups 221-229), D = information and message distribution occupations (DOT Occupational Groups 230-239), E = public contact and clerical service occupations (DOT Occupational Groups 240-248), F = miscellaneous clerical occupations (DOT Occupational Group 249), G = unspecified clerical occupations, and H = mixed samples. b Finger, hand, and arm dexterity tests and motor coordination tests. c Tests comprised of verbal, quantitative, and perceptual speed components.
situational specificity hypothesis should be rejected whenever 75% or more of the variance in a validity distribution is accounted for by the four artifacts for which corrections are made. This decision rule is admittedly arbitrary. There can be no analytic procedure for determining such a cutoff in the absence of estimates of error variance due to the three sources for which no corrections are made. However, based on our experiences with such artifacts as computational and typographical errors and criterion contamination and deficiency, we believe this 75% rule to be conservative. It might be noted that when 75% of the variance in a dependent variable is accounted for by one or more independent variables, this corresponds to a correlation of .87; even when accounted-for variance is 64%, the corresponding correlation is .80. In most psychological research, correlations of this magnitude are routinely interpreted as indicating near equivalence between variables. The important point is that regardless of the necessarily arbitrary decision rule one chooses to adopt for rejecting situational specificity, a substantial percentage of artifactual variance (e.g., 64%) in an observed validity distribution—in conjunction with a relatively low residual SD—would leave very little room for situational moderators to operate.
and criterion unreliability effects, range restriction effects, and sampling error. Also shown is the percent of observed variance in each distribution accounted for by these four artifacts, the residual SD, the total sample size and number of validity coefficients on which each distribution is based, and the uncorrected mean of each validity distribution. The results shown in Table 5 are for the 32 validity distributions based on proficiency criteria; the results in Table 6 are for the 24 distributions based on training criteria. These tables also present results for the composite validity distributions for each test type resulting from pooling validities across all true job families (Job Codes A-E) and across all job categories (A-H). Considering first the results for proficiency criteria shown in Table 5, in only 1 of the 32 distributions representing individual job families is the percentage of observed variance accounted for by statistical artifacts less than half. The average amount of Results and Discussion variance accounted for is 75%. This means that in general, the variance left within Situational Specificity which situational specificity (situational Let us first examine the results from the moderators) can operate is extremely limviewpoint of the situational specificity hy- ited. For many of the distributions, no varipothesis. Tables 5 and 6 compare the empiri- ance is left. Based on our earlier decision cally observed standard deviations of the rule, the situational specificity hypothesis validity distributions with the standard de- is rejected for the 16 distributions for which viations predicted solely on the basis of test 75% or more of the variance is accounted by
384
K. PEARLMAN, F. SCHMIDT, AND J. HUNTER
artifacts. For these test type-job family combinations, our decision rule allows validity generalization without further analysis. The validities to be generalized are the means of the Bayesian prior distributions (shown in Table 7 and discussed later). Based on these data it is our hypothesis that even for those distributions that do not meet our arbitrary 75% criterion, the remaining variance is due to the three artifactual sources not corrected for. Of these three sources, the one most likely to have the strongest impact is differences between studies in amount and kind of criterion contamination and deficiency. All criterion measures are to some extent deficient and contaminated (Brogden & Taylor, 1950). The kinds and amounts of such effects almost certainly vary widely between studies for given test type-job family combinations, creating nontrivial amounts of variance in observed validities. In 8 of the 32 distributions, the predicted standard deviations are slightly larger than the observed standard deviations. One explanation for this outcome is obviously sampling error. If all variance were due to the four artifacts for which corrections are made, sampling error in the observed variances would be expected to produce a 50% incidence of predicted variance greater than observed variance. In addition, the distributions of artifacts used are estimated means for test-job combinations in general. The actual distributions would be subject to some variations across validity distributions. The results obtained here are thus exactly what we would expect if the situational specificity hypothesis were false. Within a given set of validity distributions representing a variety of job family-test type combinations, there are likely to be some distributions in which the three unassessed sources of variance are present to varying degrees and others in which these sources are negligible. In distributions of the former type, we would expect the predicted standard deviation to fall below the observed standard deviation to varying degrees. In distributions of the latter type, the predicted standard deviation would be expected to fall slightly below the observed standard deviation about half of the time and to slightly exceed the
observed standard deviation about half of the time as a result of minor differences between the actual artifactual effects and our estimates of them. The last column in Table 5 shows the residual SD, which, as noted earlier, is the square root of the variance remaining after variance due to each of the four artifacts is subtracted from the observed variance. This is the SD that would be expected for uncorrected (i.e., "observed") validity coefficients across a large number of studies if (a) N were infinite in each study (i.e., sampling error were held to zero), (b) criterion reliability were held constant at its mean value, (c) test reliability were held constant at its mean value, and (d) range restriction were held constant at its mean value. These values clearly show that after controlling for the effects of these four artifacts, observed validity coefficients show little variability. The average residual SD is only .069 across the 32 distributions. The last two distributions for each test type in Table 5 show the results obtained when validities are combined across the five true job families and across all job categories. As would be expected, the mean observed and predicted SDs for both the distributions of validities pooled across all true job families (mean observed SD - .162, mean predicted SD - . 125) and the distributions of validities pooled across all job categories (mean observed SD = . 161, mean predicted SD = .118) closely approximate the means of these values for all individual job family distributions (mean observed SD = .149, mean predicted SD = .129). The comparison between the mean observed SD for individual job families (.149) and the mean observed SDs for the two types of combined distributions (.162 and .161) is particularly significant. It indicates that the variation in observed validities across all types of clerical occupations is only trivially greater than the average variation in validities within relatively taskhomogeneous clerical job families. This finding suggests that task differences among such occupations have little moderating effect on observed validities. It is also interesting to compare the observed SDs in Table 5 with the relevant SDs
VALIDITY GENERALIZATION RESULTS FOR CLERICAL OCCUPATIONS
385
Table 6 Results Relevant to the Situational Specificity Hypothesis: Training Criterion Distributions
Test type/Job category8 General Mental Ability A B C D A-E A-H Verbal Ability A B C D A-E A-H Quantitative Ability A B C D Quantitative Ability A-E A-H Reasoning Ability A C A-E/A-H b Perceptual Speed A B C D E A-E A-H Spatial/Mechanical Ability A B C A-E A-H Clerical Aptitude0
B C
Total N
No. /•s
f
Observed SD
Predicted SD
%of variance accounted for
11,143 7,268 8,219 4,384 31,535 32,157
16 17 13 9 61 65
.52 .39 .43 .31 .43 .44
.091 .097 .073 .100 .116 .116
.094 .089 .088 .079 .091 .091
100 84 100 62 61 62
.000 .038 .000 .062 .072 .071
14,349 12,341 11,634 5,247 44,142 44,478
16 38 26 10 97 102
.48 .37 .35 .26 .39 .39
.067 .116 .082 .101 .119 .119
.091 .090 .084 .071 .088 .088
100 60 100 48 54 55
.000 .073 .000 .073 .080 .080
26,005 8,975 9,530 5,334
26 36 22 11
.51 .40 .37 .26
.060 .104 .092 .084
.092 .096 .086 .072
100 84 88 73
.000 .042 .032 .044
50,415 50,751
102 107
.43 .43
.118 .119
.091 .091
60 59
.074 .076
1,062 1,792 4,928
10 8 25
.16 .14 .22
.083 .053 .131
.101 .074 .084
100 100 41
.000 .000 .101
7,313 11,406 9,796 9,081 769 38,365 38,701
28 61 29 25 10 153 158
.26 .21 .23 .20 .01 .22 .22
.172 .161 .108 .115 .142 .146 .146
.080 .082 .073 .068 .111 .077 .077
22 26 45 35 61 28 28
.153 .139 .080 .093 .089 .124 .124
20,186 9,043 9,477 41,942 42,123
19 21 16 63 64
.27 .20 .14 .21 .21
.087 .150 .097 .128 .127
.066 .065 .051 .060 .060
58 19 28 22 22
.056 .135 .082 .113 .112
16 8 34 39
.37 .40 .38 .39
.100 .069 .107 .108 .100 .124 .124
.094 .085 .087 .088 .083 .083 .083
89 100 66 67
.033 .000 .063 .062 .051 .090 .089
3,959 6,026 A-E 15,539 A-H 15,875 Ms for individual job family distributions Ms for true job family (A-E) distributions Ms for all job category (A-H) distributions
Residual SD
" Job categories are A = stenography, typing, filing, and related occupations (DOT Occupational Groups 201-209), B = computing and account-recording occupations (DOT Occupational Groups 210-219), C = production and stock clerks and related occupations (DOT Occupational Groups 221-229), D = information and message distribution occupations (DOT Occupational Groups 230-239), E = public contact and clerical service occupations (DOT Occupational Groups 240-248), F = miscellaneous clerical occupations (DOT Occupational Group 249), G = unspecified clerical occupations, and H = mixed samples. b These two composite distributions are the same. c Tests comprised of verbal, quantitative, and perceptual speed components.
386
K. PEARLMAN, F. SCHMIDT, AND J. HUNTER
from Figure 1. Figure 1 showed that when the true-score test-proficiency criterion correlation is .50 (comparable to a weighted average fully corrected mean validity of .48 for the 32 individual job family distribution in Table 5) and when N = 50 for all studies, the SD resulting from artifacts alone is .164; when TV = 100 the SD is . 126. The mean observed SD for the individual job family distributions in Table 5 is . 149, and the average sample size for these distributions is 71. The observed SD resulting from artifacts alone when N = 70 (not shown in Figure 1) is . 143. Thus the mean observed SD is virtually identical to that expected on the basis of our discussion of Figure 1. Table 6 presents the results for the 24 validity distributions based on training criteria and the two types of composite distributions for each test type represented in the table. Except that observed SDs are considerably smaller, reflecting higher average sample sizes, the general pattern of these data is similar to that for the data in Table 5. In 17 of the 24 distributions representing individual job families, more than half of the observed variance is accounted for by statistical artifacts. The average amount of variance accounted for in these distributions is 70%. According to our 75% decision rule, the situational specificity hypothesis is rejected for 12 of the 24 distributions, permitting validity generalization without further analysis in these 12 cases. The residual 5Z>s, which average .051 across the 24 distributions, show that in general very little variability exists among the observed validities when the four artifacts are controlled for. As with the data in Table 5, the mean observed and predicted SDs for the distributions of validities pooled across all true job families and the distributions of validities pooled across all job categories (for both types of composite distributions, the mean observed SD = .124 and the mean predicted SD = .083) are similar to the means of these values for all individual job family distributions (mean observed SD = .100, mean predicted SD = .083). Comparison of the latter mean observed SD (.100) with the former (.124) supports the finding noted above with respect to proficiency criterion
distributions, namely, that whatever task differences exist among the variety of clerical occupations represented in these validity data, they appear to have little impact in terms of moderating test validity. The mean observed SD of. 100 for the individual job family distributions in Table 6 may also be compared with the observed SD resulting from the type of analysis shown in Figure 1. The weighted average of the fully corrected mean validities for the 24 individual job family distributions in Table 6 is .64, and the mean sample size is 469. For comparison purposes an analysis similar to that presented in Figure 1 was made under the assumptions of a true-score test-training criterion correlation of .60, N = 470 for all studies, and the distribution of assumed training criterion reliabilities shown in Table 2. Test reliability and range restriction assumptions were the same as those made for Figure 1. Under these assumptions, the SD resulting from artifacts alone is .092, which, as with the analysis of the Table 5 data, is nearly identical to the mean observed SD of . 100. This outcome again demonstrates the similarity between the observed results and those expected purely as a result of statistical artifacts. Looking at the results from Tables 5 and 6 as a whole, in 48 of the 56 distributions representing individual test type-job family combinations, greater than 50% of the variance in observed validity coefficients was accounted for by statistical artifacts. In 28 of these cases this percentage was sufficiently large (75% or greater) to justify a conclusion of validity generalizability of the particular test types within the appropriate clerical job families without any further empirical validation. The average amount of variance accounted for by just four of seven statistical artifacts was 75% and 70% for validities based on proficiency and training criteria, respectively. This leaves, on the average, little if any true situationally specific variance within which moderators of any type can operate. Taken together, these findings provide compelling evidence against the viability of the situational specificity hypothesis as a substantive phenomenon. These results have obvious implications for the proper interpretation of the provision
VALIDITY GENERALIZATION RESULTS FOR CLERICAL OCCUPATIONS
for validity generalization in the recent Uniform Guidelines on Employee Selection Procedures (U.S. Equal Employment Opportunity Commission, 1978). These guidelines provide for validity generalization on the basis of a demonstration that new jobs to which one wishes to generalize previous validation results consist of "substantially the same major work behaviors" (Section 7B[2], p. 38299) as those jobs in the original studies. The above findings make it apparent that the appropriate interpretation of this provision is one based on the general activity or content structure characterizing a broad occupational area such as "clerical occupations." Our results relative to the situational specificity hypothesis show that narrower interpretations in terms of tasks, duties, or behaviors would be both empirically indefensible and unnecessarily restrictive in the clerical area. The situation is probably similar in other occupational areas. Fortunately, it appears that courts are already beginning to endorse a broader interpretation of what constitutes sufficient job similarity for validity generalization.1 We note in passing that even a demonstration of job similarity based on the general activity or content structure of broad occupational areas may still be unjustifiably stringent. Given the appropriate data, jobs may be grouped for validity generalization on the basis of similarity in ability requirements, without any reference to tasks, duties, behaviors, or responsibilities (cf. Pearlman, 1980). These conclusions also have obvious implications for the types of job analyses appropriate for demonstrating sufficient job similarity for validity generalization purposes, an issue we address in more detail elsewhere (Pearlman, 1980; Schmidt, Hunter, & Pearlman, in press).
387
patterns of relationships among basic variables. To establish such patterns of relationships, it is first necessary to demonstrate that the hypothesis of situational specificity is false or essentially false. If the situational specificity hypothesis is rejected, then relationships between various constructs (e.g., verbal or quantitative ability) and specified kinds of performances and job behaviors are, by implication, invariant in the population. The best estimate of this population relationship for any construct criterion combination is the mean of the Bayesian prior distribution. This mean should be corrected for unreliability in both test and criterion (as well as for range restriction), since the relationships of interest in theoretical research are those among underlying constructs, independent of measurement problems (Block, 1963,. 1964). We predict that such research will reveal that the underlying structure of reality in personnel psychology—that is, the pattern of population parameters and their relationships—is considerably simpler than has previously been imagined (Schmidt & Hunter, 1978).
Validity Generalization Our earlier conclusion—that the residual variance in validity distributions is due to the three artifacts for which we make no corrections— may be questioned by some readers. This section presents evidence showing that even if one rejects this conclusion, validity generalization is justified for most of the test type-job family combinations examined in this study. Tables 7 and 8 present this evidence for the same distributions shown in Tables 5 and 6. These tables show the mean (p) and SD (SD&) of the corrected Bayesian prior and the validity value at or above which 90% of all estimates The Situational Specificity Hypothesis and of true validities lie (called the "credibility the Development of Theory value" by Bayesians). (The reader will reApplication of this procedure may lead to call that the mean of the Bayesian prior, p, fairly dramatic progress in the establishment or estimated true validity, is the mean of the of general principles and theories about trait-performance relationships in the world 1 Friend v. Leidinger, 18 FEP 1055 (Fourth Circuit, of work. The first step in the development of November 29, 1978); Pegues et al. v. Mississippi general principles and theories in this or any State Employment Service et al. (Northern District other area is the establishment of stable of Mississippi, March 7, 1980).
388
K. PEARLMAN, F. SCHMIDT, AND J. HUNTER
residual validity distribution corrected for criterion unreliability and range restriction but not for test unreliability.) For example, in the case of the perceptual speed test type shown in Table 7, 90% of all true validities lie above . 14 for stenography, typing, and filing clerical occupations and above .33 for computing and account-recording clerical occupations. Results of this sort obviously mean that validity can be generalized across settings. It is important to again note the effects of not correcting for all sources of artifactual variance. The effect on the results presented in Tables 7 and 8 is to inflate values for SDp. Since these estimates are the basis for the 90% credibility values, credibility values for priors whose SD/> is greater than zero are underestimates
of the values of the true validity estimates at the 10th percentile. The credibility values reported in these tables must therefore be considered conservative, even if one does not reject the situational specificity hypothesis. The results in Tables 7 and 8 indicate that validity generalization is justified for most of the test type-job family combinations examined. For the 32 priors based on individual job families in Table 7, only 5 of the means fall below .30 and only 1 is less than .20. Twenty-seven of these priors have 90% credibility values of. 10 or greater, and in 18 cases this value is .20 or greater. Similarly, in Table 8 only 4 of the 24 means for priors based on individual job families fall below .30 and only 1 is less than .20. Twenty of these priors have 90% credibility values of
Table 7 Validity Generalization Results for Proficiency Criterion Distributions Prior distribution N
No. rs
P
SD,
90% c.v.
4,847 4,432 718 10,564 17,539
76 47 10 144 194
.50 .49 .43 .50 .52
.24 .24 .00 .22 .24
.19 .18 .43 .21 .21
18,227 6,712 1,331 27,352 39,187
215 97 28 355 450
.39 .41 .37 .40 .39
.23 .25 .00 .22 .23
.10 .10 .37 .12 .09
13,658 9,001 1,347 1,271 25,850 39,584
155 121 33 17 333 453
.49 .52 .60 .45 .50 .47
.13 .16 .09 .00 .13 .14
.32 .32 .49 .45 .34 .30
3,069 1,240 739 5,377 11,586
36 29 10 80 116
.38 .63 .31 .44 .39
.00 .12 .18 .14 .15
.38 .47 .08 .25 .19
28,824 17,043 2,951 878 1,665 51,361 70,935
368 251 50 10 23 702 882
.45 .50 .45 .40 .39 .47 .47
.24 .14 .00 .22 .12 .20 .22
.14 .33 .45 .12 .24 .21 .19
Total Test type/Job category" General Mental Ability A B E A-E A-H Verbal Ability A B C A-E A-H Quantitative Ability A B C E A-E A-H Reasoning Ability A B C A-E A-H Perceptual Speed A B C D E A-E A-H
VALIDITY GENERALIZATION RESULTS FOR CLERICAL OCCUPATIONS
389
Table 7 (continued) Prior distribution Test type/Job category" Memory A B C A-E A-H Spatial/Mechanical Ability A B C A-E A-H Motor Ability" A B C D E A-E A-H Performance tests A A-E A-H Clerical Aptitude0 A
B A-E A-H
Total N
No. rs
P
SOp
90% c.v.
3,323 1,970 726 6,278 7,764
49 39 11 102 117
.38 .42 .44 .39 .38
.20 .00 .14 .12 .17
.13 .42 .25 .24 .17
4,247 3,782 537 9,240 9,306
38 47 12 107 108
.20 .42 .48 .30 .30
.12 .19 .06 .20 .19
.04 .17 .41 .05 .05
7,662 8,405 1,521 834 1,360 19,782 21,277
95 97 21 12 21 246 257
.29 .30 .27 .15 .26 .29 .30
.25 .14 .00 .23 .00 .18 .21
-.02 .12 .27 -.14 .26 .05 .03
4,416 5,316 6,265
55 61 67
.50 .47 .44
.43 .42 .43
-.05 -.07 -.11
4,127
63
.50
.22
1,674 5,989 11,927
26 94 142
.53 .51 .48
.26 .23 .24
.22 .20 .22 .18
Note, c.v. = credibility value. a Job categories are: A = stenography, typing, filing, and related occupations (DOT Occupational Groups 201-209), B = computing and account-recording occupations (DOT Occupational Groups 210-219), C = production and stock clerks and related occupations (DOT Occupational Groups 221-229), D = information and message distribution occupations (DOT Occupational Groups 230-239), E = public contact and clerical service occupations (DOT Occupational Groups 240-248), F = miscellaneous clerical occupations (DOT Occupational Group 249), G = unspecified clerical occupations, and H = mixed samples. b Finger, hand, and arm dexterity tests and motor coordination tests. c Tests comprised of verbal, quantitative, and perceptual speed components.
.10 or greater, and in 18 cases this value is greater than .20. For most of the priors in both tables, one can be certain at the 90% level of credibility not only that validity would be nonzero in a new situation but also that validity would be substantial. The best estimate of true validity in a new setting involving the same job and test type is, of course, not the 90% credibility value but the mean of the Bayesian prior. The means in Tables 7 and 8 were all computed assuming that the specific tests to which these priors will be applied have a reliability of .80. If, in a given situation, the specific test to be
used has higher reliability, both the mean and the 90% credibility value would be correspondingly higher. Use of these priors in validity generalization applications requires correction of the mean of the prior for average test unreliability as well as for average criterion unreliability and range restriction, The means of the priors in Tables 7 and 8 refleet the latter two corrections. Thus, in application one would first correct the means in these tables for assumed average test reliability (.80). After determining the reliability of the specific test under consideration, one would then attenuate the fully
390
K. PEARLMAN, F. SCHMIDT, AND J. HUNTER
Table 8 Validity Generalization Results for Training Criterion Distributions Prior distribution Test type/Job category" General Mental Ability A B C D A-E A-H Verbal Ability A B C D A-E A-H Quantitative Ability A B C D A-E A-H Reasoning Ability A C A-E/A-H" Perceptual Speed A B C D E
A-E A-H Spatial/Mechanical Ability A B C A-E A-H Clerical Aptitude0 B C A-E A-H
Total N
No. rs
P
SDj>
90% c.v.
11,143 7,268 8,219 4,384 31,535 32,157
16 17 13 9 61 65
.80 .66 .70 .54 .70 .71
.00 .06 .00 .11 .12 .12
.80 .57 .70 .41 .55 .56
14,349 12,341 11,634 5,247 44,142 44,478
16 38 26 10 97 102
.75 .62 .60 .46 .64 .64
.00 .12 .00 .13 .13 .13
.75 .47 .60 .29 .47 .47
26,005 8,975 9,530 5,334 50,415 50,751
26 36 22 11 102 107
.79 .66 .62 .46 .70 .70
.00 .07 .05 .08 .12 .12
.79 .57 .55 .36 .55 .54
1,062 1,792 4,928
10 8 25
.29 .26 .39
.00 .00 .18
.29 .26 .16
7,313 11,406 9,796 9,081 769 38,365 38,701
28 61 29 25 10 153 158
.46 .38 .41 .36 .02 .39 .39
.27 .25 .14 .17 .17 .22 .22
.11 .06 .23 .15 -.20 .11 .11
20,186 9,043 9,477 41,942 42,123
19 21 16 63 64
.47 .36 .26 .37 .37
.10 .25 ,15 .20 .20
.35 .05 .07 .11 .11
3,959 6,026 15,539 15,875
16 8 34 39
.62 .66 .64 .64
.06 .00 .10 .10
.55 .66 .51 .51
Note. c.v. = credibility value. a Job categories are A = stenography, typing, filing, and related occupations (DOT Occupational Groups 201209), B = computing and account-recording occupations (DOT Occupational Groups 210-219), C = production and stock clerks and related occupations (DOT Occupational Groups 221-229), D = information and message distribution occupations (DOT Occupational Groups 230-239), E = public contact and clerical service occupations (DOT Occupational Groups 240-248), F = miscellaneous clerical occupations (DOT Occupational Group 249), G = unspecified clerical occupations, and H = mixed samples. b These two composite distributions are the same. c Tests comprised of verbal, quantitative, and perceptual speed components.
VALIDITY GENERALIZATION RESULTS FOR CLERICAL OCCUPATIONS
corrected prior mean by the square root of this reliability. This procedure allows any Bayesian prior to be tailored to a specific test, producing more accurate estimates of both expected true validity and of the 90% credibility value (see also Schmidt & Hunter, 1977, pp. 533-534). Inspection of the means of the priors in Tables 7 and 8 within each test type category reveals, with only afew exceptions, the similarity of these values across several job families. In the majority of cases for any given test type, the means of the priors for individual job families vary by only a few correlation points from the means of the composite distributions for that test type. These results support our earlier finding that differences in job activities between these different kinds of clerical work appear to have only minor effects, if any beyond chance, on validity coefficients. The first set of priors shown in Tables 7 and 8 is based on general mental ability tests, which assess some combination of verbal ability, quantitative ability, and abstract reasoning or spatial ability. The predictors in these cases were either factorially mixed general mental ability tests (such as the Wonderlic Personnel Test) or total scores on batteries containing separate subscales for each of the measured abilities. The last set of priors in each of these tables is based on clerical aptitude tests, which assess verbal ability, quantitative ability, and perceptual speed. Predictors comprising these priors were all batteries containing separate subscales for each measured ability and for which the validity coefficient was based on total score. As one would expect, the estimated mean true validities for these more factorially complex types of predictors tend to be slightly higher than the mean validities for their univariate components. In this connection, we should point out that this study focuses primarily on univariate validities. Except for those cases in which the priors are based on validities for battery total scores, factorially complex tests, or performance tests, results in this study refer to single test types or constructs. Thus one cannot directly infer the incremental contribution to total validity that a given test would make over and above other
391
tests. However, if reliable estimates of test intercorrelations in the applicant pool are available, incremental validities can be calculated using the usual partial correlation or regression techniques. Multivariate validities based on unit weighting of predictors can, of course, be even more easily calculated and, further, are likely to be just as large (Schmidt, 1971, 1972). Validity estimates used in these calculations should be the means of the Bayesian priors. (See Schmidt, Hunter, & Caplan, Note 5, for an example of such an application.) It is important to note that there is no fixed "magic" value that the 90% credibility value must reach in order for validity generalization to be justified. There are two reasons for this. First, there is nothing sacred about a credibility level of 90%; other credibility levels (e.g., 85%, 80%, or 75%) could be employed and in fact might be more reasonable when viewed from the context of a total decision-theoretic framework. Second, the magnitude of validity coefficients cannot be evaluated in the abstract. The practical utility of a selection procedure depends on several parameters in addition to the size of the validity coefficient, most importantly the standard deviation of job performance in dollar terms, the selection ratio, and the number of persons selected. Although the standard deviation of job performance for clerical workers is not likely to vary widely across organizations, the latter two parameters are likely to exhibit substantial variation as a result of such factors as labor market conditions and the size and nature of a particular organization. Thus a test having seemingly low validity can still be of significant practical value for organizations when the selection ratio is low and/or the number of hires is large. Our previous validity generalization study (Schmidt, Hunter, Pearlman, & Shane, 1979) presented several hypothetical utility analyses based on results similar to those obtained in the present study. These analyses revealed that substantial gains in dollar productivity are likely to result even when test validity is "low," that is, on the order of .12 (cf. also Schmidt, Hunter, McKenzie, & Muldrow, 1979). Although only one of the means of the 56 priors for
392
K. PEARLMAN, F. SCHMIDT, AND J. HUNTER
individual job families in Tables 7 and 8 is lower than this value, 12 of these priors have 90% credibility values lower than . 12. Thus, even if one established as a condition for generalizing validity the arbitrary and highly conservative decision rule that the validity value at the 10th percentile (i.e., the 90% credibility value) must have significant practical value, a conclusion of validity generalizability would still be justified for many of the cases (which are relatively few in number to begin with) in which the 90% credibility value appears low. In light of these considerations, it is likely that validity generalization will be justified for most of the test type-job family combinations presented in Tables 7 and 8. Robustness of Validity Generalization Conclusions Some readers may question the appropriateness of our assumed distributions of criterion and test reliabilities and range restriction effects across studies. It might be reasoned, for example, that we are attributing too much variance to these artifacts, as a result of which validity generalization appears to be a more pervasive phenomenon than it actually is. Because of the various conservative biases built into our procedure, we do not believe this to be the case. Nevertheless, we felt it desirable to test the robustness of our validity generalization conclusions by reanalyzing the validity distributions for individual job families presented in Tables 7 and 8 under the most extremely conservative assumption imaginable: that sampling error is the sole source of artifactual variance operating in observed validity distributions, and that there are no differences between studies in criterion and test reliability and range restriction. To reanalyze our data under this assumption, the variance of each observed distribution was not corrected in any way for variance due to between-study criterion or test reliability differences or range restriction differences. Only variance due to sampling error was subtracted from the observed variance, following which the residual SD, the SD of the prior, and the 90% credibility value were computed in the usual way. In
addition, we computed the percentage of variance predicted on the basis of all four artifacts (i.e., those corrected for in our original analysis) that was attributable to sampling error. Table 9 presents the results of this reanalysis for the same individual job family distributions shown in Tables 7 and 8. As shown in Table 9, for the proficiency criterion distributions, sampling error alone accounted for an average of 77% of the variance predicted on the basis of the four artifacts for which we made corrections in our original analysis. Thus in these distributions the three artifacts other than sampling error account for only a small portion of total artifactual variance. The average percentage of sampling error was 39% for the training criterion distributions. The generally lower percentages of sampling error in these distributions relative to the proficiency distributions stem from the considerably higher sample sizes on which the training data were based and their generally higher mean true validities. These two factors produce proportionately greater amounts of variance due to the three artifacts other than sampling error. Table 9 also shows that the impact of correcting only for sampling error variance on the average SDf> and 90% credibility value is only slightly less than when all four artifactual variance sources are corrected for. The averages of SDf> for the proficiency and training distributions are only .05 and .06 larger, respectively, than the averages of the comparable values in Tables 7 and 8. The average 90% credibility values decrease by .05 and .07 in the proficiency and training data, respectively, relative to the comparable averages for the data in Tables 7 and 8. The most important issue addressed by the results in Table 9 is the extent to which validity generalization conclusions change, even under the extremely unrealistic assumption on which these results are based. Let us conservatively assume, based on the utility considerations discussed earlier, that validity generalization would be justified for most organizations when the 90% credibility value is .12 or greater. Under this criterion, conclusions of validity generalization would change (from those
393
VALIDITY GENERALIZATION RESULTS FOR CLERICAL OCCUPATIONS
Table 9 Validity Generalization Results Under Assumption That Sampling Error Is the Only Source of Artifactual Variance Proficiency criterion distributions Test type/Job family8 General Mental Ability A B E Verbal Ability A B C Quantitative Ability A B C E Reasoning Ability A
B C Perceptual Speed A B C D E Memory A B C Spatial/Mechanical Ability A B C Motor Ability6 A B C D E Performance tests A Clerical Aptitude0 A B
M
Training criterion distributions
*+,
SDf,
90% c.v.
70 64 76
.28 .28 .07
.14 .12 .34
75 78 87
.26 .28 .00
.06 .06 .37
66 66 72 74
.19 .22 .20 .00
.24 .24 .35 .45
77 69 85
.11 .22 .20
.24 .35 .05
71 70 77 75 79
.28 .21 .07 .25 .17
.09 .24 .36 .08 .17
80 82 76
.23 .00 .19
.09 .42 .19
91 75 79
.14 .23 .16
.02 .12 .28
86 84 89 96 91
.26 .17 .00 .23 .00
-.04 .08 .27 -.15 .26
64
.46
-.09
69 68
.27 .31
.16 .14
77
.19
.18
**.
SD>
90% c.v.
General Mental Ability A B C D
10 22 14 28
.13 .14 .11 .16
.62 .47 .56 .34
Verbal Ability A B C D
9 30 25 35
.10 .18 .12 .16
.63 .40 .45 .24
Quantitative Ability A B C D
8 33 23 36
.08 .15 .14 .13
.68 .47 .45 .29
87 80
.00 .00
.29 .26
48 66 49 54 100
.29 .27 .17 .19 .17
.09 .04 .19 .12 -.20
19 50 58
.14 .26 .16
.29 .03 .05
36 13 39
.14 .10 .15
.45 .53 .32
Test type/Job family"
Reasoning Ability
A C Perceptual Speed
A B C D E Spatial/Mechanical Ability A B C Clerical Aptitudec B C
M
Note. c.v. = credibility value. a Job families are A = stenography, typing, filing, and related occupations (DOT Occupational Groups 201209), B = computing and account-recording occupations (DOT Occupational Groups 210-219), C = production and stock clerks and related occupations (DOT occupational groups 221-229), D = information and message distribution occupations (DOT Occupational Groups 230-239), and E = public contact and clerical service occupations (DOT Occupational Groups 240-248). b Finger, hand, and arm dexterity tests and motor coordination tests. c Tests comprised of verbal, quantitative, and perceptual speed components.
394
K. PEARLMAN, F. SCHMIDT, AND J. HUNTER
based on the results in Tables 7 and 8) for observed and predicted SDs, percentage of only four of the proficiency criterion distri- variance accounted for, and means and SDs butions and for none of the training criterion of the Bayesian priors are similar for both distributions—a total of only 1% of all of the sets of results. This indicates that our condistributions analyzed. This outcome would clusions on situational specificity and validbe approximately the same, for any reason- ity generalization are robust with respect to able criterion for generalizing validity, for changes in the description and classification example, if the required credibility value of clerical occupations. was set at .10, .15, or .20. These results Our results may also be viewed from the clearly demonstrate that it is of little prac- standpoint of previous research on the relatical consequence what distributions of arti- tive predictability of proficiency and trainfacts are assumed, within broad ranges. ing criteria in clerical occupations, the relationship between validities for these two classes of criteria, and the general predictive Comparisons With Previous Research value of different types of tests in clerical The results of this study may be compared selection. Ghiselli (1966) presented a series to the relevant set of results from our earlier of analyses of the average (uncorrected) study (Schmidt, Hunter, Pearlman, & validities of a variety of test types for differShane, 1979). That study included analyses ent jobs. As in the present study, these analof 11 validity distributions based on profi- yses were based on observed validity coefficiency criteria and representing two clerical cients that had been extracted from all job families and six test types. However, the available prior research (both published and earlier study was completed prior to publi- unpublished studies) and segregated accordcation of the fourth edition DOT, and the ing to whether they were computed on criclerical job families examined in those anal- teria of job proficiency or training success. yses were therefore based on the third edi- In one of his analyses, Ghiselli (1966, p. 115) tion DOT (U.S. Department of Labor, compiled the available validities across all 1965). Although the clerical job families types of tests for clerical occupations only (DOT occupational divisions) are similarly and reported an average validity of .23 for labeled in the two editions, for the fourth predictors of proficiency criteria and .35 for edition DOT many occupations were re- predictors of training criteria. classified into different occupational diviTo compare these results with our data, sions than those in which they had appeared we computed the average of the uncorrected in the third edition. This reflected techno- means of the composite validity distribulogical changes in many jobs that had tions (pooled across all job categories) for occurred in the period between the two edi- both proficiency and training criteria. These tions, resulting in considerable redefinition, uncorrected mean validities (r) for each test consolidation, and restructuring of DOT type are shown in Table 10 along with the occupational groups and divisions for the total N and number of coefficients on which fourth edition. each distribution is based. (Note that Table In terms of our validity data base, the dif- 10 includes training criterion composite disferences between the two editions of the tributions for three test types—memory, DOT are reflected primarily in a shift of a motor ability, and performance tests—that substantial number of validity coefficients were not presented in Tables 6 and 8 from the computing and account-recording because of insufficient data for these test clerical job family to the stenography, types on any individual job family.) As typing, and filing family, the two job families shown in Table 10, the average validity for which results were presented in our ear- (weighted by sample size) across all test lier study (Schmidt, Hunter, Pearlman, & types for all clerical occupations is .20 for Shane, 1979). In spite of these changes, proficiency criteria and .34 for training crihowever, results for the 11 test type- teria. These values are highly similar to job family combinations common to both those reported by Ghiselli (1966), despite studies are comparable. The values of the the fact that our data base incorporates a
VALIDITY GENERALIZATION RESULTS FOR CLERICAL OCCUPATIONS
395
Table 10 Uncorrected Means of Composite Validity Distributions Training criteria
Proficiency criteria Total
Total Test type
N
No. rs
f
N
No. rs
f
General Mental Ability Verbal Ability Quantitative Ability Reasoning Ability Perceptual Speed Memory Spatial/Mechanical Ability Motor Ability Performance Clerical Aptitude
17,539 39,187 39,584 11,586 70,935 7,764 9,306 21,277 6,265 11,927
194 450 453 116 882 117 108 257 67 142
.26 .18 .23 .18 .22 .18 .14 .14 .21 .23
32,157 44,478 50,751 4,928 38,701 3,088 42,123 1,901 869 15,875
65 102 107 25 158 3 64 12 7 39
.44 .39 .43 .22 .22 .35 .21 .19 .47 .39
Sample-size weighted M
great deal of research from the past dozen years or so and is therefore substantially different from the data on which Ghiselli' s findings were based. Dunnette (Note 2) similarly pooled prior validity results for occupations relevant to the petroleum refining industry. For just the clerical occupations in his data base, Dunnette reported a median validity across all test types of .29 for predictors of proficiency criteria and .31 for predictors of training criteria. These results are not directly comparable to either Ghiselli's (1966) or our findings in this study, since they are based on a much more limited sample of clerical occupations. Nevertheless, they do support the trend toward higher average validities for training criteria. Such an effect is most likely a result of various ability factors playing a more important role in individuals' performance in clerical training programs than in on-the-job performance. This may be because individual differences in motivation have a greater opportunity to emerge on the job than in the typically more circumscribed training program environment. It would therefore be expected that performance in training programs, compared with performance on the job, proportionately would be determined more by various ability factors, particularly the cognitive or intellectual abilities (since most such programs are cognitively oriented), than by motivational factors. This in turn would result in measures of such abili-
.20
.34
ties yielding higher validities as predictors of training performance than as predictors of proficiency on the job. The results in Tables 7 and 8 bear this out. For comparable test types, the means of the Bayesian priors based on training criteria (Table 8) exceed those based on proficiency criteria (Table 7) by the greatest amount for the test types of general mental ability, verbal ability, and quantitative ability, whereas this discrepancy is smallest for the perceptual speed and motor ability test types. (The mean of the Bayesian prior for the motor ability test type across all job categories for training criteria, not shown in Table 8, is .35.) This same general pattern was also observed by Ghiselli (1966) with respect to both clerical occupations (pp. 36-37) and occupations in general (pp. 116-117). However, the fact that this pattern obtains even for mean validities that have been appropriately corrected for the differential levels of reliability typical of the two criterion types indicates that these differences are real rather than artifacts of differential criterion reliability. Ghiselli (1966, pp. 118-119) also analyzed the correlation between validity coefficients for proficiency and training criteria. For these analyses he used that subset of his data in which, for any given specific test-job combination, a pair of average validity coefficients (one based on proficiency criteria and the other on training criteria) was available and each was based on a total sample
396
K. PEARLMAN, F. SCHMIDT, AND J. HUNTER
size of at least 100. He reported a correlation between such pairs of. 14 for all occupations and a correlation of .39 for clerical occupations only. Ghiselli concluded from these results that the abilities that are important for training success in a given occupation are generally not very similar to those that determine actual job success, although the relationship between validities for the two criterion types is somewhat greater for clerical occupations than for most other occupations. This conclusion may be quite misleading, however, because of the nature of the data Ghiselli (1966) used in his analysis. The best indicator of the true relationship between validities for the two criterion types would be the correlation between pairs of mean validities across broad test type categories, each member of the pair being based on the largest number of coefficients available and hence providing the most stable validity estimate. Though Ghiselli did use pairs of average validities, these averages represented a relatively low level of cumulation, since they were for specific jobs and specific item types rather than broad job families and test types. (See the Method section of this article for a definition of item types.) Although the number of coefficients represented by each average validity is not reported, statements Ghiselli makes elsewhere in his book (p. 94-95) suggest that at this level of cumulation the number of coefficients represented by most such averages is probably quite small. These data were thus not very far removed from individual observed validity coefficients, the variance of which for any given test type-job family combination is created largely by the operation of various statistical artifacts, as we have earlier demonstrated. The correlations between proficiency and training criterion validities reported by Ghiselli, since they were computed on average validities that had not been cumulated into test types, are thus implicitly based on the assumption that most of the observed variance in validity coefficients between item types is true variance. In fact, most of this variance is apt to be artifactual, and for this reason alone, correlations between mean training and proficiency validities would be expected to be low.
A different picture of the relationship between proficiency and training criterion validities emerges from a reanalysis of some other data presented by Ghiselli (1966). These data are average validities representing higher levels of cumulation or based on larger numbers coefficients than those discussed above. For example, when the same data subset from which Ghiselli (1966, p. 116) computed the proficiency-training criterion correlation of .14 for all occupations was cumulated into five broad test type categories, the correlation between these five pairs of average validities for the two criterion types increased to .82. In another set of data, Ghiselli (p. 121) presented the "grand average validity coefficients" (i.e., using his entire data base rather than the subset described above) of 18 item types across all occupations for the two types of criteria. The correlation between these 18 pairs of average validities was ,62. Ghiselli (p. 37) also presented average proficiency and training criterion validities for all clerical occupations. In this set of data, average validities were presented at both the item type and broad test type levels of cumulation. The correlation between the pairs of average validities across the 19 item types presented turned out to be .58, and the correlation across the five pairs of average validities for broad test types was .77. To compare these results with the data from this study, we computed the correlation between the two sets of uncorrected mean validities shown in Table 10, that is, the uncorrected mean validities of each test type across all clerical occupations for proficiency and training criteria. This is closely analogous to the correlation computed on Ghiselli's (1966) data for all clerical occupations across broad test types, which was .77. The correlation between the 10 pairs of mean validities in Table 10 is .69, not far from the comparable value from Ghiselli's data. This despite the fact that Ghiselli's test classification system was somewhat different than ours in that he grouped tests of general mental ability, verbal ability, quantitative ability, reasoning ability, and memory into a general "intellectual abilities" test type category, whereas we treated each of these as separate test types. Also, Ghiselli had a test type category for personality tests
VALIDITY GENERALIZATION RESULTS FOR CLERICAL OCCUPATIONS
on which we did not gather data, and we included performance tests and clerical aptitude tests in our data base, whereas Ghiselli did not use such categories. We therefore recomputed the above correlations on just those test types common to both test classification systems used by Ghiselli (1966) and in this study. These included the test types of general mental ability, quantitative ability, memory (all considered as subcategories under "intellectual abilities" by Ghiselli), perceptual speed, spatial/mechanical ability, and motor ability. For Ghiselli's (1966, p. 37) data on all clerical occupations, the correlation between the average validities for proficiency and training criteria across the above six test types is .75. The comparable correlation across the same six test types for the data in our Table 10 is .77. The similarity of these values constitutes strong corroborative evidence of the relationship between test validities for proficiency and training criteria. (Even though these correlations were computed on mean validities uncorrected for differential expected reliabilities of the two criterion types, the use of corrected mean validities would have little effect on the resulting correlations, since the values in both validity vectors would be increased by a constant factor. For example, the correlation between the 10 pairs of uncorrected mean validities in Table 9 was .69. If instead we compute the correlation between the corresponding 10 pairs of Bayesian prior means, which incorporate the correction for differential expected reliabilities, this value is .67.) The correlations between proficiency and training criterion validities presented in the preceding paragraphs are each based on relatively few validity pairs. However, many psychologists would regard the test types on which these correlations are based as the population of all the test types they would consider using in selection. In that case, these correlations would be considered as parameters, that is, true correlations (although slightly attenuated by unreliability, as described below) between the two types of validity coefficients. Some might wish to define a larger population of test types than is represented by these correlations. In that case, these correlations would
397
be taken as sample estimates whose standard errors are calculated by the formula (1 r2)/(N - 1)1/2 and whose lower bound 95% confidence intervals would be calculated by multiplying the standard errors by 1.645 and subtracting these values from the estimated correlations. Under this definition, the lower bound on the correlation of .69 between the 10 pairs of mean test type validities in Table 10 would be .40; for the correlation of .77 (based on six of these test types), this value would be .47. The above reanalyses of Ghiselli's (1966) data, along with the corroborating results from our own data, clearly indicate that contrary to previous belief, the relationship between test validities for proficiency and training criteria is substantial. This relationship holds for clerical occupations considered separately as well as for data pooled across different occupations. When stable validity estimates (i.e., average validities that are based on large samples and therefore minimize error variance) are used in the computations, the correlation between validities for the two classes of criteria is on the order of .60 across item types and about .75 across broad test types. The latter figure is the more appropriate indicator of the strength of this relationship for two reasons. First, the correlations computed across test types are based on larger total sample sizes per mean validity coefficient than those computed across item types. As a result, the validity vectors for both criterion types are more reliably determined. The correlation between the vectors is therefore less attenuated by unreliability and hence closer to the true correlation. Second, even if sample size per mean validity were held constant (thus holding error variance constant), then to the extent that item types within test types do not differ in mean true validity, computing the correlation across item types rather than test types reduces the true variance, and thus the reliability, of the vectors of mean validities. The effect of this lowered reliability is obviously to attenuate the computed correlation. In fact, even the value .75 must be considered an underestimate of the true relationship between test validities for the two criterion types. Since the vectors of mean test type validities for each criterion type are
398
K. PEARLMAN, F. SCHMIDT, AND J. HUNTER
based on less than infinite sample size, they are not perfectly reliable. Given the fact that true variance among mean validities for each vector is not large to begin with (as can be seen from inspection of these values in Table 10), even small amounts of sampling error variance can have a significant attenuating effect on this correlation. We may conclude from these results that the types of tests most predictive of training success for a particular occupation (clerical or otherwise) will tend strongly also to be most predictive of proficiency on the job itself, and vice versa. Finally, this finding strongly suggests that the true-score correlation between proficiency and training criteria is quite high, probably close to unity. However, we were unable to test this hypothesis because of the absence of the appropriate data in the literature. Regarding the general predictive value for clerical selection of the various types of tests examined in this study, our findings support those of earlier researchers in this area. Some 30 years ago, Bennett and Cruikshank (1949) reviewed all the research available at that time on test validity for clerical occupations. They concluded (Bennett & Cruikshank, p. 61) that for a large number of clerical occupations, the best predictors for use in selection programs were a test of general intelligence (or a test producing separate subscores for verbal and quantitative ability) in combination with a test of "routine speed and accuracy" (i.e., perceptual speed). Ghiselli's (1966, p. 37) validity summary for all clerical occupations similarly shows that tests of intellectual abilities (which include the general mental ability, verbal, quantitative, reasoning, and memory test types of our classification system) and perceptual accuracy (our perceptual speed test type) provide the best prediction for clerical occupations as a whole, whereas motor ability tests are relatively poor predictors for such occupations. This conclusion was reiterated in Ghiselli's (1973) update of the data in his 1966 book. Tests of spatial/mechanical ability additionally showed above average validities in Ghiselli's (1966, p. 37) summary, a finding that he regarded as surprising and that was not clearly replicated in our data. He also
found a substantially higher average validity for perceptual speed tests as predictors of training success (.40) than is observed in our data, in which the comparable value (from Table 10) is .22. Apart from these two somewhat anomalous outcomes, the general pattern of our results closely parallels the earlier findings of both Ghiselli (1966,1973) and Bennett and Cruikshank (1949). Inspection of the means of the Bayesian priors for the composite distributions shown in Tables 7 and 8, which are the best indicators of the predictive value of the various test types, shows that measures of verbal ability, quantitative ability, reasoning ability, memory, and perceptual speed (as well as general mental ability and clerical aptitude, which are composites of some of these) are generally better predictors of clerical performance than measures of motor ability and spatial/mechanical ability. In addition, performance tests show high validity for the more limited number of clerical occupations to which they are applicable. Practical Applicability of Results How could the results of this study be used by personnel managers or psychologists faced with practical problems in clerical selection? Consider, for example, the case in which a test battery is needed as part of a selection program for a particular occupation. As we have indicated, the validity distributions for each test type cumulated across all clerical job categories would be the most appropriate data sets on which to base such decisions. Recourse to the results for individual DOT job categories is unnecessary in practice and unduly conservative, since the differences in tasks among the various clerical job families have no significant impact on validities. Thus, to apply any of the validity generalization results presented in Table 7 (or Table 8 if selection for clerical training is involved), one would only need to collect sufficient job analysis information on the occupation in question to appropriately classify it as clerical under the DOT definition of this broad occupational category. Following such classification, the potential usefulness of various test types could then be assessed in light of our validity
VALIDITY GENERALIZATION RESULTS FOR CLERICAL OCCUPATIONS
generalization results for the distributions of those test types cumulated across job categories. Decisions concerning what types of tests to use in selection could then be made, most appropriately on the basis of such utility considerations as were discussed earlier. If one wished to be extremely conservative and employ the validity generalization results for the individual job families in Table 7 (or Table 8 for training program selection), similar procedures would be followed. In this case, one would need sufficient job analysis information on the occupation in question to permit its classification into the appropriate DOT job category. One would then apply the results presented in Tables 7 or 8 for that specific job category to decisions regarding test selection. It should be noted, however, that this more conservative approach would be unlikely to result in different conclusions in terms of test selection than those based on the results for combined job categories. Moreover, the results for combined job categories are more reliable (since they are based on larger numbers of coefficients) and hence more appropriate to bring to bear on such decisions. As we have noted in previous articles (Schmidt & Hunter, 1977; Schmidt, Hunter, Pearlman, & Shane, 1979), if this procedure is to be used with maximum effectiveness in the future, it is important that reports of validity studies be more complete than they have typically been in the past. Many such reports contain no information on degree of range restriction, criterion reliability, or test reliability. For example, Jones (1950) found in reviewing 427 validity studies that only 22% contained any information on criterion reliability. Our experiences in reviewing the large number of more recent studies from which we collected data do not alter this conclusion. Another problem we frequently encountered was incomplete identification or description of the test used or the occupation studied. For example, Table 4 shows that over 11% of the total number of validity coefficients in our data base represent insufficiently specified clerical occupations. We strongly urge improvement in these reporting practices so that the validity generalization procedure can be applied more effectively in the future.
399
Our experiences in this research have also pointed up the need for cooperative validation studies involving a number of organizations. For many test-job combinations, there does not at present exist sufficient validity data to construct a Bayesian prior. In most of these cases, it will be beyond the resources of a single organization to generate the necessary additional validity coefficients. Only cooperative validity studies involving numerous organizations will be capable of producing the required data. To our knowledge, there are currently three such cooperative studies in process using this procedure, a number we hope will increase in the future. In this connection, it is important to note that small-sample validity studies with inadequate statistical power can nevertheless contribute to cumulative knowledge when included in the computation of a Bayesian prior. Though such studies, standing alone, are generally inadequate as a basis for conclusions about test validity, they can make a useful contribution to the power of the Bayesian prior. Hunter and Schmidt (1978) provide further discussion of statistical power in "studies of studies." The conceptual foundations and likely benefits of combining results from previous studies have also been explored in some depth by Glass (1976). Glass has coined the term metaanalysis to describe this approach to data analysis, which is in many respects similar to our validity generalization procedures. Several meta-analytic studies in different areas of psychological research have successfully demonstrated the power of this approach to clarify previously confusing or conflicting research results (Hall, 1978; Kulik, Kulik, & Cohen, 1979; Smith, 1980; Smith & Glass, 1977). To sum up, the results of this study, in conjunction with the findings of Schmidt and Hunter (1977) and Schmidt, Hunter, Pearlman, and Shane (1979), cast serious doubt on the traditional belief that employment test validities are situationally specific. In our judgment, these combined findings justify the conclusion that situational specificity is largely an illusion created by statistical artifacts. This conclusion is in line with evidence from several lines of research indi-
400
K. PEARLMAN, F. SCHMIDT, AND J. HUNTER
eating that patterns of relationships among population parameters in personnel psychology are considerably simpler than generally assumed (Schmidt & Hunter, 1978). The visions of complexity entertained by many psychologists in the field may stem largely from a tendency to interpret variance created by statistical artifacts as real. (Epstein, 1979, recently exposed a similar phenomenon in the area of personality research.) On the contrary, it now appears that validity generalization is possible on a widespread basis, resulting in great savings of time, effort, and expense. More importantly, it now appears possible to establish general principles and theories concerning traitperformance relationships in the world of work, enabling personnel psychology to develop beyond the stage of a technology to that of a science. Reference Notes 1. Novick, M. R. Bayesian methods in educational testing: A survey. Paper presented at the Second International Symposium on Educational Testing, Bern, Switzerland, June 29 - July 3, 1975. 2. Dunnette, M. D. Validity study results for jobs relevant to the petroleum refining industry. Washington, D.C.: American Petroleum Institute, 1972. 3. Callender, J. C., Osburn, H. O., & Greener, J. M. Small sample tests of two validity generalization models. Paper presented at the meeting of the American Psychological Association, New York, September 1979. 4. Pearlman, K. Comparison between predictive and concurrent test validation results. Manuscript in preparation, 1980. 5. Schmidt, F. L., Hunter, J. E., & Caplan, J. R. Validity generalization: Results for two occupations in the petroleum industry. Washington, D.C.: American Petroleum Institute, October 1979.
References Albright, L. E., Glennon, J. R., & Smith, W. J. The use of psychological tests in industry. Cleveland, Ohio: Howard Allen, 1963. Bennett, G. K., & Cruikshank, R. M. A summary of clericaltests. New York: Psychological Corporation, 1949. Block, J. The equivalence of measures and the correction for attenuation. Psychological Bulletin, 1963, 60, 152-156. Block, J. Recognizing attenuation effects in the strategy of research. Psychological Bulletin, 1964, 62, 214-216. Bobko, P., & Bartlett, C. J. Subgroup validities: Differential definitions and differential prediction. Journal of Applied Psychology, 1978,65, 12-14.
Boehm, V. R. Differential prediction: A methodological artifact? Journal of Applied Psychology, 1977, 62, 146-154. Boehm, V. R. Populations, preselection, and practicalities: A reply to Hunter and Schmidt. Journal of Applied Psychology, 1978,65, 15-18. Brogden, H. E., & Taylor, E. K. A theory and classification of criterion bias. Educational and Psychological Measurement, 1950, 10, 159-186. Callender, J. C., & Osburn, H. G. Development and test of a new model for validity generalization. Journal of Applied Psychology, in press. Epstein, S. The stability of behavior: I. On predicting most of the people much of the time. Journal of Personality and Social Psychology, 1979, 37, 10971126. Ghiselli, E. E. The validity of occupational aptitude tests. New York: Wiley, 1966. Ghiselli, E. E. The validity of aptitude tests in personnel selection. Personnel Psychology, 1973, 26, 461-477. Glass, G. V. Primary, secondary, and meta-analysis of research. The Educational Researcher, 1976, 10, 3-8. Guion, R. M. Personnel testing. New York: McGrawHill, 1965. Guion, R. M. Recruiting, selection, and job placement. In M. D. Dunnette (Ed.), Handbook of industrial and organizational psychology. Chicago: Rand-McNally, 1976. Hall, J. A. Gender effects in decoding nonverbal cues. Psychological Bulletin, 1978, 85, 845-857. Hunter, J. E., & Schmidt, F. L. Differential and singlegroup validity of employment tests by race: A critical analysis of three recent studies. Journal of Applied Psychology, 1978,65, 1-11. Hunter, J. E., Schmidt, F. L., & Hunter, R. Differential validity of employment tests by race: A comprehensive review and analysis. Psychological Bulletin, 1979,86, 721-735. Jones, M. H. The adequacy of employee selection reports. Journal of Applied Psychology, 1950, 34, 219-224. Katzell, R. A., & Dyer, F. J. Differential validity revived. Journal of Applied Psychology, 1977, 62, 137-145. Katzell, R. A., & Dyer, F. J. On differential validity and bias. Journal of Applied Psychology, 1978, 63, 19-21. Kulik, J. A., Kulik, C.-L. C., & Cohen, P. A. A metaanalysis of outcome studies of Keller's personalized system of instruction. American Psychologist, 1979, 34, 307-318. Lent, R. H., Aurbach, H. A., & Levin, L. S. Predictors, criteria, and significant results. Personnel Psychology, 1971,24, 519-533. Linn, R. L. Single-group validity, differential validity, and differential prediction. Journal of Applied Psychology, 1978,65, 507-512. Novick, M. R., & Jackson, P. H. Further cross-validation analysis of the Bayesian m-group regression method. American Educational Research Journal, 1974, //, 77-85. O'Connor, E. J., Wexley, K. N., & Alexander, R. A.
VALIDITY GENERALIZATION RESULTS FOR CLERICAL OCCUPATIONS Single-group validity: Fact or fallacy? Journal of Applied Psychology, 1975, 60, 352-355. Pearlman, K. The validity of tests used to select clerical personnel: A comprehensive summary and evaluation (Tech. Study TS-79-1). U.S. Office of Personnel Management, Personnel Research and Development Center, August 1979. (NTIS No. PB 80-102650) Pearlman, K. Job families: A review and discussion of their implications for personnel selection. Psychological Bulletin, 1980, 87, 1-28. Schmidt, F. L. The relative efficiency of regression and simple unit predictor weights in applied differential psychology. Educational and Psychological Measurement, 1971,5;, 699-714. Schmidt, F. L. The reliability of differences between linear regression weights in applied differential psychology. Educational and Psychological Measurement, 1972, 32, 879-886. Schmidt, F. L., Berner, J. G., & Hunter, J. E. Racial differences in validity of employment tests: Reality or illusion? Journal of Applied Psychology, 1973, 53, 5-9. Schmidt, F. L., Gast-Rosenberg, I., & Hunter, J. E. Validity generalization results for computer programmers. Journal of Applied Psychology, in press. Schmidt, F. L., & Hunter, J. E. Development of a general solution to the problem of validity generalization. Journal of Applied Psychology, 1977, 62, 529-540. Schmidt, F. L., & Hunter, J. E. Moderator research and the law of small numbers. Personnel Psychology, 1978, 31, 215-232. Schmidt, F. L., Hunter, J. E., McKenzie, R., & Muldrow, T. The impact of valid selection procedures on workforce productivity. Journal of Applied Psychology, 1979, 64, 609-626.
401
Schmidt, F. L., Hunter, J. E., & Pearlman, K. Task differences as moderators of aptitude test validity in selection: A red herring. Journal of Applied Psychology, in press. Schmidt, F. L., Hunter, J. E., Pearlman, K., & Shane, G. S. Further tests of the Schmidt-Hunter Bayesian validity generalization procedure. Personnel Psychology, 1979,32, 257-281. Schmidt, F. L., Hunter, J. E., & Urry, V. W. Statistical power in criterion-related validity studies. Journal of Applied Psychology, 1976,61, 473-485. Schmidt, F. L., Pearlman, K., & Hunter, J. E. The validity and fairness of employment and educational tests for Hispanic Americans: A review and analysis. Personnel Psychology, in press. Smith, M. L. Sex bias in counseling and psychotherapy. Psychological Bulletin, 1980,87, 392-407. Smith, M. L., & Glass, G. V. Meta-analysis of psychotherapy outcome studies. American Psychologist, 1977,32, 752-760. Thorndike, R. L. Personnel selection. New York: Wiley, 1949. U.S. Department of Labor. Dictionary of occupational titles (3rd ed.). Washington, D.C.: U.S. Government Printing Office, 1965. U.S. Department of Labor. Dictionary of occupational titles (4th ed.). Washington, D.C.: U.S. Government Printing Office, 1977. U.S. Equal Employment Opportunity Commission, U.S. Civil Service Commission, U.S. Department of Labor, & U.S. Department of Justice. Uniform guidelines on employee selection procedures. Federal Register, 1978, 43(166), 38295-38309. Wolins, L. Responsibility for raw data. American Psychologist, 1962, 17, 657-658.
(Appendix follows on next page)
402
K. PEARLMAN, F. SCHMIDT, AND J. HUNTER
Appendix General Hypothesis. A. The present validity generalization procedure recognizes eight potential sources of variance in distributions of observed validity coefficients for given test-job combinations: Vii» wheren\ = the relative frequencies of the restricted standard deviations. 5. The variance due to differences between studies in range restriction is then
\ D. Estimating variance due to sampling error. 1 . Variance due to sampling error is computed for each observed validity coefficient as follows:
where r^ = the observed validity coefficient and Nt = the sample size associated with r\. 2. The final estimate of sampling error variance is the sample-size weighted average of the sampling error for individual coefficients:
=