In addition, we wish to thank Bryce Dixson and David. Wiebe for their assistance ...... tests? In P. K. Ackles, J, R. Jennings, & M. G. H. Coles (Eds.), Ad- vances in ...
Journal of Applied Psychology 1991, Vol. 76, No. 2, 229-238
Copyright 1991 by the American Psychological Association r Inc.
0021-9010/91/$3,00
Validity of the Control Question Polygraph Test: The Problem of Sampling Bias Christopher J. Patrick
William G. Iacono
University of British Columbia Vancouver, British Columbia, Canada
University of Minnesota
Sampling bias is a potential problem in polygraph validity studies in which posttest confessions are used to establish ground truth because this criterion is not independent of the polygraph test. In the present study, criterion evidence was sought from polygraph office records and from independent police files for all 402 control question tests (CQTs) conducted during a 5-year period by federal police examiners in a major Canadian city. Based on blind scoring of the charts, the hit rate for criterion innocent subjects (65% of whom were verified by independent sources) was 55%; for guilty subjects (of whom only 2% were verified independently), the hit rate was 98%. Although the estimate for innocent subjects is tenable given the characteristics of the sample on which it is based, the estimate for the guilty subsample is not. Some alternatives to confession studies for evaluating the accuracy of the CQT with guilty subjects are discussed.
- - i s also a serious drawback because ground truth verification is often lacking in real-life cases. Field researchers have approached the criterion problem in various ways, attempting to establish polygraph accuracy with reference to such criteria as judicial outcomes, expert assessments of the available evidence, and inculpatory confessions. Although confessions are perhaps the most certain criterion of ground truth available, and also the most frequently used in field research, an exclusive reliance on confession-verified cases may produce a specific sampling bias that results in inflated accuracy figures. As Iacono and Patrick (1987, 1988) have argued, confessions are most often obtained by polygraphers after a subject has failed the polygraph test. A deceptive polygraph test outcome provides the incentive for an examiner to interrogate a subject, and if the subject confesses, the polygraph outcome is confirmed. (In the ultimate version of this self-fulfilling prophecy, an examiner may accept a minor admission from the subject-one that does not relate specifically to the issue of the polygraph t e s t - - a s evidence o f the subject's guilt.) On the other hand, guilty subjects who produce truthful outcomes are not interrogated, and therefore there will be no opportunity for false negative errors to appear in a confession-verified sample. False positive errors will lack representation for similar reasons: If an innocent person produces a deceptive polygraph test outcome, he or she will be presumed guilty (even though a confession is not obtained), and further investigative effort will seldom be expended to identify the real culprit. As a result of these selection biases, virtually all of the cases included in a confessionverified test sample will be (a) those in which the examiner's opinion was deceptive and the subject confessed during posttest interrogation and (b) those in which a truthful opinion was subsequently confirmed by another suspect who confessed following a failed polygraph test. Iacono (in press) provided a detailed analysis o f how selection biases in studies using posttest confessions to establish ground truth can produce dramatically misleading estimates of polygraph test validity. In addition, selection biases can come into play at the stage of
The polygraph examination procedure used most frequently in criminal investigations is the control question test (CQT; cf. Barland & Raskin, 1973; Reid & Inbau, 1977), a procedure in which physiological responses to specific crime-relevant questions are compared with responses to control questions dealing with the subject's prior history of wrongdoing. The CQT relies on the assumption that guilty subjects should be more concerrted with and hence more reactive to the relevant questions, whereas innocent subjects should be more disturbed by the more broadly incriminatory control questions. This assumption is without a sound theoretical basis (Ben-Shakhar, Bar-Hillel, & Lieblich, 1986; K l e i n m u n t z & Szucko, 1982; Lykken, 1978,1981), however, and therefore carefully controlled empirical research is needed to establish the validity of the CQT. Ideally, an estimate of CQT validity would be derived from a representative sample of real-life examinations in which an unambiguous criterion of ground truth was available. Laboratory studies, although advantageous from the standpoint o fcriterion certainty, have generally failed to recreate the motivational and emotional characteristics of a real-life polygraph examination (Iacono & Patrick, 1987; Lykken, 1981). On the other hand, the advantage of field studies--that they are based on actual crimes
Preliminary findings were presented at the Annual National Polygraph Workshop held at the Canadian Police College in Ottawa, Canada, August 1986, and at the annual meeting of the Society for Psychophysiological Research, October 1987, Amsterdam, the Netherlands. This research was supported in part by Grant 410-84-0614 from the Social Sciences and Humanities Research Council of Canada. We are grateful to John Yuille for his help during the planning stages of this project. In addition, we wish to thank Bryce Dixson and David Wiebe for their assistance with data collection and data coding. Christopher J. Patrick is now at the Department of Psychology, Florida State University, Tallahassee, Florida. Correspondence concerning this article should be addressed to William G. Iacono, Department of Psychology, University of Minnesota, Minneapolis, Minnesota 55455. 229
230
CHRISTOPHER J. PATRICK AND WILLIAM G. IACONO
chart scoring and interpretation, when examiners may depart from strict chart-based decision making to minimize errors. As noted elsewhere (Ben-Shakhar et al., 1986; Lykken, 1981), an opinion about the outcome of a polygraph test often takes into account other information besides the chart data. Such extrapolygraphic sources of information include case facts available from police reports, discussions with the case investigator prior to the polygraph test, and subject behaviors and comments before and after the polygraph test (including the subject's responses during a posttest interrogation). Inconclusive opinions may be rendered in cases where extra-polygraphic information is at odds with technically conclusive chart data, as well as in cases in which the chart scores are technically inconclusive. As a result, the exclusion of charts associated with inconclusive opinions may eliminate cases for which criterion evidence would reveal chart-based errors. Iacono and Patrick (1987, 1988) recently reviewed the extant field research on the CQT, comprising 10 studies. Of these, all but two (Barland & Raskin, 1976; Bersh, 1969) relied exclusively on confession-verified cases identified by polygraph examiners or failed to report the criteria used to establish ground truth, and all but one (Barland & Raskin, 1976) either explicitly excluded inconclusive cases from consideration or failed to report criteria for case selection. In addition to issues of sample selection, the 10 studies reviewed by Iacono and Patrick each suffered from one or more of the following methodological limitations: absence of blind scoring of the polygraph charts, use of global chart evaluation rather than numerical scoring, reliance on questionable criteria for ground truth (i.e., judicial outcomes or panel assessments of available case facts), and use of nonstandard testing or scoring procedures. Iacono and Patrick concluded from their review that the field validity of the CQT cannot be determined from the existing body of published research. Essentially the same conclusion was reached by Raskin (1987). Given the continuing role of the CQT in criminal investigations and judicial proceedings (currently, 24 U.S. states provide for the admission of polygraph evidence in criminal cases; Iacono & Patrick, 1987), field validity studies remain an important research priority. The present investigation was designed to overcome the methodological limitations of past research and to provide a comprehensive assessment of CQT validity. Our case sample was obtained from the Polygraph Section of the Royal Canadian Mounted Police (RCMP), whose policy (like that of U.S. federal government agencies that use polygraph testing) is to restrict the use of the polygraph to serious crime investigations (ranging from theft to robbery to homicide) in which other avenues of investigation have already been pursued. RCMP examiners follow an explicit set of procedural rules for CQT administration (reflecting the current state of the art), which gave us access to standardized data from examinations that were conducted with a high level of competency. An important goal of the present study was to assess the impact of sampling biases on estimates of CQT validity. We pursued this objective in two ways. First, we evaluated the reliability of examiner scoring and decision making in a large sample of cases (n = 276) to identify systematic biases in the assignment of subjects to truthful, deceptive, and inconclusivecategories. This provided us with insight into how selective exclusion of inconclusive cases from a validation sample could bias accu-
racy estimates. Second, we compared accuracy figures for two subsets of cases: (a) tests listed as verified by examiners in polygraph agency records (most often on the basis of posttest admiss i o n s - b u t not always relevant to the issue of the test) and (b) tests verified independently of the polygraph test. This in turn allowed us to evaluate the representativeness of cases comprising a final validation sample (n = 89), which included all independently verified cases together with those examiner-verified cases that were truly verified. Method
Subject Sample To avoid the problem ofa nonrepresentative case sample, we considered all cases available within a specified time period: We collected data for every polygraph test completed by the Vancouver Polygraph Section of the RCMR located in Vancouver,Canada, for its nine largest referring detachments during the years 1980-1984 (overall N = 402). Cases were identified from Polygraph Section logbooks, which listed in chronological order all tests conducted during the study period together with referring detachments. No test for which complete charts were produced was excluded from study; information was collected from Polygraph Section files and police detachment files for all 402 cases.
Examiners Conclusions about CQT validity should be based on the results of examinations that employ contemporary field techniques. In the present study, all tests were conducted by well-trained male RCMP polygraph operators employing up-to-date, standardized CQT procedures. RCMP examiners are required to have at least 12 years of prior police experience, including 5 years' experience in serious crime investigation, and must complete a rigorous polygraph training program. The six polygraphers who conducted the majority of the examinations for the present study had long-established careers as investigativeofficers (M = 17.5 years; SD = 1.9). Though varying in terms of their field testing experience (M = 4.4 years; SD = 2.2), the polygraphers had all undergone similar training (in most cases, a 14-week American Polygraph Association accredited course at the Canadian Police College in Ottawa, Canada). The average number of tests conducted by these men was 450.
Polygraph Examinations All examinations were conducted in a standard police polygraph suite with either Stoelting or Lafayette field model polygraphs, which provided measures of respiration, skin resistance, and cardiovascular activity. Each examination consisted of three phases: a pretest interview, a test phase, and a posttest interview. During the pretest interview, the examiner collected biographical information, discussed the main issue of the test with the subject, and reviewed the test questions, modifying the wording of the control questions to accommodate any admissions from the subject. During the test phase of the examination, the examiner monitored the subject's physiological responses to test questions• Each test was a modified zone of comparison (MZOC) CQT similar to that used in recent studies by Raskin and his colleagues (e.g., Honts, Hodes, & Raskin, 1985; Raskin & Hare, 1978). In most cases, the main issue of the test was whether the subject was directlyinvolvedin the incident under investigation. In this case, a CQT focusingon direct involvement(DIR) was conducted, including relevant questions of the form, "Did you ?': In some cases, the examiners were interested in whether the subject was involved in the incident under investigation in some indi•
.
.
231
VALIDITY OF THE CONTROL QUESTION TEST rect way, in which case an indirect involvement (IND) CQT was administered, involving questions of the form, "Do you know for sure who was responsible f o r . . . ?" or "Did you plan with someone to . . . ?". An IND test was performed after a DIR series in some cases to rule out both direct and indirect involvement, but in cases in which direct involvement was not an issue the IND series was the only test conducted. At some point during the test phase, either before the first presentation of the test questions or after, the examiner conducted a demonstration or stimulation test (cf. Badand & Raskin, 1975; Reid & Inbau, 1977) in which he recorded and displayed the subject's physiological response to a known lie. The purpose of the demonstration test was to strengthen the subject's belief that the polygraph can accurately detect lies. Each question series (DIR or IND) normally comprised three charts (i.e., three separate presentations of the question sequence), with a fourth chart administered only if the outcome was not clear after three. The third chart was typically a silent answer test (SAT; cf. Matt6, 1980; Raskin & Hare, 1978), in which the subject was instructed to remain silent after the presentation of each question rather than answering out loud as before. The examiner scored the charts with a semiobjeetive numerical scoring procedure similar to that used by Raskin and his colleagues at the University of Utah (cf. Raskin, 1986). A score from 1 to 3 was assigned to a question pair if the response to the control question was larger than the response to the relevant question, with the magnitude of the score reflecting the size of the difference. Similarly, a score from - 1 to - 3 was assigned if the relevant question elicited a larger response. Separate scores were derived for each physiological channel (respiration, skin resistance, and cardiovascular). In a DIR test, in which all three relevant questions pertained to the same direct involvement issue, the sum of the numerical scores over charts, channels, and question pairs provided the basis for a decision: Total scores o f - 6 or lower resulted in deceptive verdicts, total scores of 6 or higher resulted in truthful verdicts, and scores between - 5 and 5 were ruled inconclusive. Most IND tests, on the other hand, comprised three separate relevant issues (e.g., "Do you know for sure who stole the money?" "Did you plan with someone to steal the money?" and "Have you personally received any of the stolen money?"). For this reason, each IND test question was judged separately by computing the sum of the numerical scores for that question over charts and channels. Examiners were trained to evaluate scores for each IND test question against a_+2 inconclusive region (with a score exceeding 2 resulting in a truthful decision for that relevant question and a score below - 2 resulting in a deceptive verdict), but in practice examiners used a lower cutoff for truthful decisions. In all cases, numerical scoring of the charts was performed prior to the posttest interview (without the examinee present), and the examiner's strategy in the posttest phase was dictated by his evaluation of the subject's truthfulness. If in his opinion the subject was truthful, the subject was advised of this opinion and permitted to leave. If the subject was believed to have been deceptive, an interrogation was undertaken with the object of eliciting a confession from the subject. If the examiner's decision was inconclusive, an attempt was made to schedule a reexamination with the subject. Reexaminations usually occurred within 1-2 weeks after the original polygraph test and followed a very similar format.
Procedure The study was completed in three phases, as follows: Review of Polygraph Section files. For each test included in our study sample, a variety of details were collected from Polygraph Section logbooks and files. The logbooks contained (in addition to test dates and referral sources) examiner conclusions about case verification made on the basis of posttest admissions and other information
obtained after tests were conducted; as such, logbook records are often the main source of criterion data in CQT field studies. From the Polygraph Section files we obtained case facts, subject characteristics, numerical chart scores, original examiner opinions, and details concerning posttest confession-verified cases. Review of police detachment files. The second phase of the study was devoted to the collection of outside criterion information (i.e., facts concerning the outcome of a case that became available after polygraph subjects were tested) from the nine detachments that had supplied cases for the study sample. We were interested in the full range of evidence bearing on the true guilt or innocence of each subject in our sample. (The terms guilty and innocent are used henceforth to describe the criterion status of subjects--whether tested as suspects, victims, or witnesses--because they provide an effective contrast with the terms deceptiveand truthful used to describe polygraph test outcomes.) Therefore, various types of criterion data were collected, ranging from circumstantial evidence to physical evidence to eyewitness evidence to judicial outcome to full confession. Some form of criterion information was obtained for 192 (48%) of the 402 cases in our study sample. Of these, 89 cases (i.e., 22% of the total) were resolved by confession of the guilty party or by a statement from the victim that no crime was committed (e.g., an allegedly stolen item was discovered, following the testing of suspects, to have been misplaced by the owner) and were considered to be verified with maximum certainty. Blind rescoring of the polygraph charts. In the third phase of the study, we obtained two independent blind analyses of a sample of tests (n = 276), which included all examinations for which any type of criterion data were obtained, together with a random sample (approximately 20%) of tests from the remaining nonverified cases. Included in this sample were tests from 222 cases in which only a single test was administered, with the balance drawn from cases in which a retest was conducted after the original test; of the latter group of tests, 24 were original tests and 30 were retests. Nine experienced RCMP examiners from polygraph units in Western Canada assisted with the rescoring; each of the 276 chart sets in question was rescored independently by two of these examiners. Three of the examiners involved in administering the original tests also participated in the rescoring, but these examiners rescored only unfamiliar charts (i.e., charts they had not previously administered and/or scored). To eliminate any possibility of the charts being recognized by the rescorers, all identifying information was covered over and the charts were coded and referred to by number. This provided us with numerical evaluations that were free from any extrapolygraphic influences and that were based solely on the physiological tracings. Results T h e results o f this study are p r e s e n t e d in two m a i n sections. I n the first, we present a n analysis o f scoring a n d decision m a k ing reliabilities for all o f t h e 276 tests t h a t were blindly rescored. Besides p r o v i d i n g basic d a t a o n interscorer a g r e e m e n t , this section illustrates h o w e x a m i n e r biases in scoring a n d decision m a k i n g m a y ultimately influence t h e c o m p o s i t i o n o f cases in a field validity study. In the s e c o n d section, we present hit rates for t h r e e s u b s a m pies o f cases: (a) tests listed as verified in Polygraph Section logbooks (i.e., examiner-verified tests), which represent t h e sole source o f d a t a in m a n y existing field studies o f the CQT; (b) tests verified i n d e p e n d e n t l y o f Polygraph Section files; a n d (c) all cases verified with m a x i m u m certainty, t h a t is, all i n d e p e n dently verified cases plus those examiner-verified cases t h a t m e t criteria for m a x i m u m certainty. M a x i m u m certainty cases c o m p r i s e d two types: (a) subjects verified as guilty by t h e i r o w n full confession (not subsequently retracted) to o n e or m o r e o f
232
CHRISTOPHER J. PATRICK AND WILLIAM (3. IACONO
the issues covered by the polygraph test (n = 52) and (b) subjects verified as innocent by the details of a confession given by another person (n = 33) or by the innocent recovery of money or merchandise believed to have been stolen (n = 4). The Results section closes with an analysis of true-negative and false-positive cases within the final (maximum certainty) validity sample.
Reliabifity of Chart Interpretations Numerical scores. To assess the consistency of the numerical scoring of the polygraph charts, we computed Pearson correlations between (a) the original (OR) examiner's scores and the scores for each of the two blind evaluators (R1 and R2) and (b) the scores for R1 and R2. Of the 276 chart sets that were rescored, 180 contained only a DIR test, 9 contained only an IND test, and 87 contained both DIR and IND series tests. For DIR tests, the R1/R2 interscorer reliability figures for respiration, cardiovascular, skin resistance, and total scores were .74, .87, .92, and .93, respectively. The observed pattern of correlations for the three physiological channels (r~spimaon< rcardlov~ul~r< r, kin resistance) is consistent with results from other studies in which the reliability of the CQT has been assessed (e.g., Barland & Raskin, 1975; Patrick & Iacono, 1989). The interscorer reliability figures for the original versus blind examiners were as follows: OR/R1---.76, .88, .91, and .93; OR/R2--.74, .86, .92, and .93. None of the differences between pairs of correlations (OR/RI, OR/R2, R1/R2) was significant at the .05 level according to t tests for dependent correlation coefficients (Glass & Hopkins, 1984, pp. 310-311). For IND tests, R1/R2 correlations for questions 5, 7, and 10 (each covering a separate issue) were .82, .85, and .86, respectively, and again there were no significant differences between these figures and the corresponding coefficients for OR/RI and OR/R2. A further question of interest was whether there might be differences in the reliability of scoring for tests in which the original examiner's opinion was inconclusive rather than truthful or deceptive. To simplify this analysis, we examined the reliability of DIR test scoring within each of the three opinion categories (truthful, deceptive, and inconclusive) for tests in which the original examiner's opinion was based on a DIR test alone (n = 180). In each case the correlation between rescorers was higher than the correlation between the original examiner and either rescore, but this difference was significant only within the inconclusive category, in which the correlation for RI/R2 (.84) exceeded that for OR/R2 (.68), two-tailed t(34) = 2.48, p < .05. On the other hand, t tests for independent correlation coefficients (Glass & Hopkins, 1984, pp. 307-309) revealed no significant differences in the reliability of blind chart scores across the three opinion categories (i.e., reliability figures for R1/R2 for charts associated with truthful, deceptive, and inconclusive opinions were very similar--.82, .79, and.84, respectively). Classifications. A second reliability issue concerns the consistency of the classifications that result from the original and blind chart scores when traditional cut-off criteria are applied. To assess the reliability of classifications, we examined the extent of agreement between the original examiner's opinion (truthful, deceptive, or inconclusive)for each test as stated in his written report and (a) the classification of cases derived from
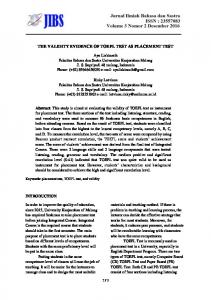
the original examiner's numerical scoring of the charts and (b) classifications based on the mean of the two blind rescores. (The two rescores for each test were averaged to provide a single, more stable blind score.) For purposes of this analysis, subjects were classified as deceptive if their numerical score w a s - 6 or lower on the DIR test or lower than - 2 on any one of the IND test questions. Subjects were classified as truthful if they scored 6 or higher on the DIR test and (when an IND test was given) at least 1 on each IND series question. 1Cases that failed to meet the criteria for deceptive or truthful were classified as inconclusive. In Table 1, the decisions made by the original examiner are compared with (a) the classifications that would have resulted if he had applied the above-mentioned cut-otis to his own numerical scores in a strict fashion and (b) the classifications based on the mean of the two blind rescores. The kappa coefficient (Cohen, 1960) between classifications based on original opinions and classifications based on original scores was .67; for classifications based on opinions versus mean blind rescores, kappa was only .53. In 31% of cases in which the original examiner reached a truthful decision, the charts were either inconclusive or deceptive according to his own numerical scoring. In the blind chart evaluations, an even greater proportion (51%) of truthful opinions were associated with charts that were inconclusive or deceptive; a chi-square test (using original score data to set expected frequencies for blind score data) confirmed that this increase was significant, x2(1, N = 104)= 19.91, p < .01. In contrast, the vast majority of deceptive opinions were associated with conclusively deceptive charts regardless of whether classifications were based on original or blind numerical analyses. A substantial percentage of tests in which an inconclusive opinion was rendered (many of which, as noted earlier, were followed by retests) were associated with charts that were conclusivelydeceptive: 39% when classifications were based on original scores, and 44% when classifications were based on mean blind rescores. Figure 1 depicts quantitatively the relationship between original and blind scores and classifications; for ease of explication, only those cases in which the original examiner's opinion was based on a DIR test alone (n = 180) are represented. Particularly noteworthy are (a) the difference in score distributions for deceptive and truthful opinions, with the latter showing considerable skew toward the inconclusive region; (b) a similar regression of blind rescores (relative to original scores) for both decep-
The truthful cutoff for each IND test question was reduced to 1 from 2 because (a) in practice, original examiners invariably applied a lower cutoff for truthful decisions and (b) using I as a cutoff for truthful classifications (and - 2 for deceptive classifications)resulted in an inconclusive rate similar to that for DIR tests, whereas use of_+2 cutoffs would have inflated the inconclusive rate for tests including an IND series. In Table 1, use of_+2IND cutoffs for cases associated with truthful opinions would have yielded 10 more inconclusive outcomes for original examiner score classifications and 4 more for mean rescore classifications. In terms of hit rates for ground truth verified cases,_+2 cutoffs would have altered the inconclusive rate for innocent subjects only, resulting in fewer conclusively truthful classifications and a higher error rate once inconclusiveswere excluded. In actual fact, however, this effect was negligibleand would not have affected significantly the hit rate data presented in Tables 2-5.
VALIDITY OF THE CONTROL QUESTION TEST
233
tive and truthful opinions, with an appreciable increase in inconclusive classifications only for the latter; and (c) a lack of any comparable regression of blind rescores for inconclusive opinions (in fact, just the opposite occurred). Summary Analyses of numerical scoring and opinion reliabilities indicated that original examiners responded to a negative bias in the charts (i.e., a tendency for scores to be skewed toward the deceptive range) with a positive bias in their scoring and decision making. Charts that produced conclusively truthful numerical scores were almost always associated with truthful opinions. However, charts with technically deceptive scores were frequently ruled inconclusive by original examiners, and charts that were technically inconclusive were judged to be truthful in a disproportionate number of cases.
Accuracy of Chart Interpretations Hit rates were computed by comparing classifications based on original examiner opinions, original examiner scores, and mean blind rescores with subjects' criterion status. Score cutoffs for DIR and IND tests were the same as those described in the preceding section. Consistent with field practice, in cases in which both types of test were administered, classifications were based on the combined result (i.e., a subject was classified as truthful if he or she met criteria for a truthful classification on both tests and as deceptive if he or she scored as deceptive on one or the other). Examiner verified cases. Two practices that may serve to inflate estimates of CQT accuracy in field validity studies are (a) the exclusion of tests yielding inconclusiveopinions from the study sample and (b) exclusive reliance on cases listed as confirmed or verified in polygraph agency logbooks. Cases listed as verified by examiners on the basis of criterion data available to them (in most cases, admissions obtained during the posttest) may provide a biased picture of CQT validity because the criterion information tends not to be independent of polygraph test outcomes (Iacono & Patrick, 1987, 1988). In addition, examiners may not always use consistent, unbiased criteria in designating certain cases as verified. Moreover, the exclusion of charts from inconclusive tests may further bias polygraph test validity estimates to the extent that inconclusive opinions, as our data in Table I indicate, are determined by nonchart information (e.g., case facts or subject behaviors).
Table 1
Original Examiner Opinions Versus Numerical Score Classifications Original opinion Classification based on numerical scores Original score Truthful Deceptive Inconclusive Scores missing Mean blind rescore Truthful Deceptive Inconclusive
Truthful
Deceptive
Inconclusive
72 1 31 l
0 108 3 1
1 23 35 0
51 4 50
0 107 5
l 26 32
Figure 1. Original and mean blind score distributionsfor cases involving a direct involvement test only (n = 180), broken down by original examiner opinion category (Inconcl = inconclusive). Classification figures based on original examiner opinions and scores and mean blind rescores are shown in Table 2 for all cases in our study sample for which criterion information was available at the Polygraph Section office, excluding two tests for which the original examiner's opinion was inconclusive; in both of these cases (which appear in Table 5) the subjects were confirmed as innocent, and blind scoring of the charts produced deceptive outcomes. Table 2 includes cases listed as verified in Polygraph Section logbooks or for which ground truth evidence in the form of a confession was present in the Polygraph Section files. 2 Two features of the data in Table 2 are 2 Polygraph Section logbooks listed 17 cases as verified deceptive, and one case as verified truthful, which failed to meet our ground truth criteria for maximum certainty. The 17 verified deceptive cases included cases in which subjects admitted to wrongdoings other than those covered by the relevant questions on the polygraph test, and cases in which posttest admissions were vague (e.g., during the posttest, the subject agreed with the examiner's deceptive verdict, but would not elaborate further) or subsequently retracted without further corroboration. The verified truthful case in question was one in which information obtained independently from police files clearly contradicted the logbook's designation of ground truth. None of these cases are included in Table 5.
234
CHRISTOPHER J. PATRICK AND WILLIAM G. IACONO
particularly noteworthy: (a) the relative absence of erroneous classifications and (b) the tendency for conclusive opinions to be rendered on the basis of inconclusive charts, particularly in criterion innocent cases. Independently verified cases. As noted earlier, we collected detailed criterion information from police detachment files for each case in our study sample. Table 3 presents the classification figures for cases verified with maximum certainty by information obtained independently of Polygraph Section files. This sample included six tests that received inconclusive opinions from the original examiner. Five of these involved criterion innocent subjects, for whom blind scores yielded three deceptive and two inconclusive outcomes; in the remaining test, involving a criterion guilty subject, blind scoring produced an inconclusive result. In Table 3, classifications are presented separately for original examiner opinions and scores and for mean blind rescores; for classifications based on numerical scoring, cases involvinga reexamination were classified according to the retest score except when the first test yielded a conclusive score. Worthy of note are the following points: (a) whereas 24 test subjects were independently confirmed as innocent (i.e., 65% of the sample of innocent cases that were verified with maximum certainty), only 1 subject was independently confirmed as guilty (i.e., only 2% of the sample of guilty cases that were verified with maximum certainty); and (b) errors of classification were clearly in evidence, particularly when classifications were based on numerical scores. In particular, the blind hit rate for independently verified innocent subjects (excluding inconclusives) was only 57%. We also examined hit rates for cases in which only a DIR test was administered. In Table 4 mean blind rescore classifications for examiner verified and independently verified tests in this subsample are compared. The pattern of results was essentially the same as that presented in Tables 2 and 3. The hit rate for independently verified innocent subjects who received only a DIR test was 56% (excluding inconclusives). Allcases verified with maximum certainty A total of 89 (22%) of the 402 subjects constituting our study sample were verified as guilty or innocent with maximum certainty. This group of
Table 3
Hit Rates." Independently Verified Cases Criterion Classification Original opinion Truthful Deceptive Inconclusive Original score Truthful Deceptive Inconclusive Mean blind rescore Truthful Deceptive Inconclusive
Innocent
Guilty
16 3 5
0 0 1
10 5 9
0 0 1
8 6 10
0 0 1
cases represents the most complete validation sample available and includes all cases in the independently verified group, together with those examiner-verified cases that met the stringent criteria for verification at this level. Table 5 shows the classification figures for these 89 cases, broken down by original opinions, original scores, and mean blind rescores. For purposes of classification by numerical score, cases involving a reexamination were classified according to the retest score unless the initial test yielded a conclusive score. Excluding inconclusives, the hit rate figures for guilty subjects were as follows: 100% for original opinions and original scores, and 98% for mean blind rescores. For innocent subjects, the corresponding figures were 90%, 70%, and 55%, respectively. A series of chi-square tests were performed to compare hit rates based on original examiner opinions, original scores, and mean blind rescores (excluding inconclusives) with hit rates based on chance expectancies. The hit rates for original opinions were significantly above chance for both guilty and innocent subjects, x2(1, N = 51) = 51.00, p < .01, and x2(l, N = 30) = 19.20, p < .01, respectively. For hit rates based on original scores, the difference from chance expectancy for guilty subjects was highly significant, x2(l, N = 48) = 48.00, p < .01, but the difference for innocent subjects was not significant, x2(l, N = 23) = 3.52. For classifications based on mean blind re-
Table 2
Hit Rates." Examiner Verified Cases Table 4
Criterion Classification Original opinion Truthful Deceptive Original score Truthful Deceptive Inconclusive Scores missing Mean blind rescore Truthful Deceptive Inconclusive Not blindly rescored
Innocent
Guilty
12 0
0 68
6 0 5 1
0 65 2 1
3 1 8 0
0 63 3 2
Blind Score Hit Rates." Cases Involving a Direct Involvement Test Only Criterion Classification Examiner verified Truthful Deceptive Inconclusive Not blindly reseored Independently verified Truthful Deceptive Inconclusive
Innocent
Guilty
2 0 5 0
0 40 3 I
5 4 4
0 0 1
235
VALIDITY OF THE CONTROL QUESTION TEST Table 5
Hit Rates."All Cases VerifiedWith Maximum Certainty Criterion Classification Original opinion Truthful Deceptive Inconclusive Original score Truthful Deceptive Inconclusive Scores missing Mean blind rescore Truthful Deceptive Inconclusive
Innocent
samples revealed a specific bias in case representation: Although independently verified innocent cases were strongly represented in this final sample, all but one of the guilty subjects in the final sample were examiner-verified.
Guilty
False-Positive Errors 27 3 7
0 51 1
16 7 13 1
0 48 3 I
11 9 17
1 48 3
scores, the hit rate for guilty subjects was again significantly above chance, ×2(1, N = 49) = 45.08, p < .01, but the hit rate for innocent subjects was not, ×2(1, N = 20) = 0.20. One mediating factor of potential importance in assessing polygraph test validity is the status o f examinees constituting the criterion sample. For example, an argument has been made that the testing of victims (i.e., to rule out false complaints) may carry a particularly high risk of error because of the victims' proximity to the incident under investigation and their heightened sensitivity to relevant questions (cf. Raskin, 1986). However, the exclusion of subjects tested as victims or alleged witnesses (i.e., 4 criterion innocent and 15 criterion guilty subjects) from Table 5 yielded a pattern of blind hit rates consistent with those for the overall sample: Excluding inconclusives, the hit rate for guilty subjects (97%) was significantly above chance, ×2(1, N = 35) = 31.11, p < .01, but for innocent subjects (56%) it was not, ×2(1, N = 16) = 0.25. Another factor deserving scrutiny in studies o f polygraph test validity is the relatedness of cases constituting the criterion sample (cf. Barland & Raskin, 1976). Criterion bias may be a particular problem in cases that are verified in the context of a multiple-suspect investigation. In the present sample, hit rates (excluding inconclusives) for cases in which more than one subject was examined on the same issue (55% and 100% for innocent and guilty subjects, respectively) were not significantly different from hit rates for subjects tested singly (56% and 98%, respectively). However, as Iacono and Patrick (1987) noted, criterion bias is likely to be most evident when several subjects are tested on the same issue and one of them confesses, exonerating the others. Only 4 of the 25 cases (16%) tested as part o f multiple-subject investigations were verified on the basis of a posttest confession, and for these cases mean blind scores yielded three correct classifications and one inconclusive. Summary A comparison of hit rates for examiner-verified and independently verified cases revealed a specific bias in the former, namely, the selective elimination of chart-based classification errors. Consideration of hit rates for the most complete sample of cases likely to be found in a field validation study (i.e., all cases verified with maximum certainty, whether by the examiner or independently) in the light of data from the first two
An effort was made to identify testing variables or subject characteristics that would predict correct versus incorrect classifications for innocent subjects in the maximum certainty sample, that is, true negatives versus false positives. Two variables were examined: (a) type o f crime under investigation (i.e., against a person or against property) and (b) subject age. Predictions were that false-positive errors would occur more frequently in investigations of crimes against persons (cf. Horvath, 1977) and among younger subjects (cf. Patrick & Iacono, 1989). Although more false-positive errors occurred among subjects tested for person crimes than among subjects tested for property crimes (50% as compared to 37.5%), a chi-square test comparing hit rates for these two innocent subsamples was not significant, X2(1, N = 20) = 0.30, p > .05. On the other hand, the age difference between false-positive and true-negative subjects (Ms = 20.33 and 30.73, respectively) was significant, one-tailed t(18) = 2.06, p < .05. Discussion Recent reviews of the literature on the validity of the CQT (Iacono & Patrick, 1987, 1988; Lykken, 1981; Raskin, 1987) have identified two groups of field studies with sharply contrasting findings: One group reports hit rates averaging over 90% for innocent subjects, whereas the other reports only chance-level accuracy figures for innocent subjects; both groups yield mean hit rates in excess of 80% for guilty subjects. Considerable attention has been given to the methodological weaknesses of studies in both groups, and one of our objectives in the present study was to provide a fair test of CQT validity using competent examiners, up-to-date testing procedures, blind numerical scoring procedures, and the best available criteria for ground truth. Given these methodological precautions, the results of the present study provide the first clear evidence for sampling bias as an important determinant of hit rates in field studies of the CQT.
Biases Related to Scoring and Decision Making For the 276 tests that were blindly rescored (i.e., all cases for which criterion data were available together with a random sample of the remaining nonverified cases), numerical scores for the two blind evaluations (R1, R2) showed substantial agreement with each other and with original examiner (OR) scores. The only evidence for a systematic bias in scoring was for charts associated with inconclusive opinions by the original examiner: For these cases, agreement between the two blind scorers (R1/ R2) was higher than that between either set of blind evaluations and the original examiners' scores (OR/R1, OR/R2), and for one of these comparisons (OR/R2) the difference in reliability figures was significant. Similarly, a comparison of subject classifications based on original and blind chart evaluations revealed a unique pattern
236
CHRISTOPHER J. PATRICK AND WILLIAM G. IACONO
for cases in which the original examiner's opinion was inconclusive as opposed to truthful or deceptive: Whereas for the latter two categories mean blind scores tended to be more conservative (i.e., regressing more toward the inconclusive region) than original examiner scores, for cases that the original examiner called inconclusive the pattern was reversed (i.e., mean blind scores more frequently produced conclusive classifications). In contrast, there was no difference in the reliability of blind (R1/R2) chart scores for inconclusive cases compared with truthful or deceptive opinion cases, suggesting that there was no difference in the clarity of charts associated with the three opinion categories. Furthermore, we observed that in 39% o f the cases in which the original examiner's opinion was inconclusive, his own scoring had yielded a deceptive score. These findings have two important implications: (a) Original examiners modified their scoring or countermanded their own scoring of the charts (or both) in some cases, with the most frequent result being that deceptive charts were called inconclusive, and (b) the exclusion of charts associated with inconclusive opinions from further analyses would have led to the removal of some charts that were technically deceptive. We found the opposite to be true for charts associated with truthful opinions. In 31% (32/104) of these cases, the original examiner's scores were not conclusively truthful. An even greater percentage (51%) failed to yield conclusively truthful mean rescores; this was in strong contrast to charts associated with deceptive opinions, of which 96% produced conclusively deceptive mean rescores. This discrepancy emerged even though scores for charts associated with truthful and deceptive opinions (a) were equally reliable across scorer pairs and (b) showed a similar pattern of regression (i.e., shrinkage) from original scores to mean blind rescores. One implication o f these data is that there was a clear asymmetry in score outcomes with the CQT, with the distribution o f truthful scores skewed much more toward the inconclusive region than the distribution of deceptive scores. A second implication is that the original examiners placed greater confidence in charts with scores in the truthful direction, as evidenced by their willingness to form truthful opinions on the strength o f charts that were not conclusively truthful. In contrast, as noted above, original examiners frequently classified deceptive charts as inconclusive and almost never rendered a deceptive opinion unless the charts were conclusively deceptive. These data suggest that the original examiners mistrusted the numerical scoring rules as they are applied to the determination o f innocence and that they made adjustments for a negative bias in the charts through a positive bias in their opinions.
Biases & Criterion Case Selection In addition to the above reliability analyses, we examined hit rates for three criterion case samples: (a) examiner verified, (b) independently verified, and (c) a composite sample including all cases from (a) and (b) that were verified with maximum certainty For innocent subjects, hit rates were observed to vary as a function of how classifications were made and also as a function of which cases were included in the criterion-verified sample. Classifications based on original examiner opinions, and to a lesser extent original examiner scores, resulted in higher hit rates than those based on blind scoring. Together with the
aforementioned reliability results, these data suggest that extrapolygraphic cues (i.e., information from sources other than the polygraph tracings; cf. Iacono & Patrick, 1987) play an important role in examiner decisions and the accuracy of those decisions. A comparison of classifications for examiner-verified versus independently verified cases indicated that false-positive errors were largely selected out from the former because of(a) original examiner opinion and scoring biases' leading to deceptive charts' being designated inconclusive, and (19)a lack o f followup or feedback from referral agencies concerning those cases in which potential errors existed. Five of the 7 criterion-innocent cases in which inconclusive opinions were rendered were actually false positives according to blind chart scores, and criterion information obtained independently o f polygraph office records revealed three innocent cases in which the original examiner's opinion was deceptive. The overall hit rate for innocent cases verified with maximum certainty (based on mean blind scores, excluding inconclusives) was 55%, and reanalyses o f hit rates excluding victims and witnesses failed to indicate any biasing effect o f these cases on the overall figure. In contrast, the overall hit rate for guilty cases verified with maximum certainty was 98%. However, only 1 of the 52 cases in this sample was verified by information obtained independently of polygraph examiner records, and the vast majority of examiner-verified guilty cases meeting our certainty criteria (48/51 = 94%) were verified by posttest confessions. As Iacono and Patrick (1987, 1988) noted, the use of posttest confessions as a criterion for guilt contains an inherent bias, namely, that a polygraph test subject is normally interrogated during the posttest phase only if he or she produces clearly deceptive charts. As a result, virtually all posttest confessions are guaranteed to corroborate the chart data. In the present study, the original examiners tended to be cautious in their evaluation of the chart data (i.e., they frequently rendered truthful opinions when the charts were technically inconclusive and inconclusive opinions when the charts were technically deceptive), and therefore charts associated with posttest confessions were in most cases associated with a high negative (i.e., deceptive) score. This accounts for the lack of difference in classification figures for criterionguilty subjects across classification methods (i.e., original examiner opinions versus original scores versus blind scores). These results suggest that the very high hit rate for guilty subjects in the present study may well be an artifact of the dependence between the criterion and the chart data. In addition, logbook records listed additional verified deceptive cases for which inspection of the case facts revealed less than certain criterion information (i.e., a partial or retracted confession, or a confession to an issue different from that covered by the polygraph test; see Footnote 2). As Iacono (in press) noted, false confessions and other erroneous inculpatory evidence obtained as corroboration for deceptive polygraph charts will tend to inflate rather than deflate accuracy figures for guilty subjects. Moreover, our inability to find criterion-guilty subjects who produced truthful charts (i.e., false-negative errors) could be attributed to similar biases. As noted earlier, examiners tended to place great confidence in charts with scores in the truthful direction, such that truthful opinions were almost always rendered when original scores were conclusively truthful and often when original scores were technically inconclusive but tending to-
VALIDITY OF THE CONTROL QUESTION TEST ward truthful. As a result, given that the polygraph tended to be used as a last resort in the cases included in our study sample, a guilty subject who produced a truthful test score would almost never be discovered because there would be no reason to continue investigating him or her. On the other hand, there appeared to be a greater opportunity for false-positive errors to come to light. Given that inconclusive opinions were sometimes rendered in cases in which the charts indicated deception, there were cases in which other suspects were pursued (and in some cases found to be guilty) even though the polygraph test results were technically deceptive. In addition, even though a particular investigation might have ceased when a polygraph subject was judged to be deceptive but declined to confess, independent evidence sometimes arose to substantiate the subject's innocence (e.g., confession o f another suspect in an independent investigation or recovery of merchandise thought to have been stolen). Because in the present study a large proportion of criterioninnocent subjects were identified independently of the polygraph test, and because these cases constituted a majority of those associated with conclusive test scores, it is possible to place some confidence in the overall hit rate figure for innocent subjects (55%). Interestingly, this figure is remarkably similar to the 56% hit rate we observed for innocent subjects in a recent mock crime study in which prisoners were tested by experienced examiners under realistic motivational conditions (Patrick & Iacono, 1989). Moreover, as in that study, we found that subject characteristics (i.e., age) discriminated true- and falsepositive cases. This is important because it implicates features of the individual as contributing to errors with the CQT (cf. Lykken, 1974).
Implications for the Validity of the Control Question Test The results of the present study provide new insight into CQT validity and suggest avenues for further research. First, our data may explain why practitioners of the CQT believe the technique is infallible even though it is based on controversial assumptions and even though some published field studies show a substantial error rate for the test, particularly among innocent subjects. Because posttest confessions constitute the major source of feedback that field examiners receive about their opinions, and because this criterion (as noted earlier) is highly dependent on the outcome of the test, nearly all of the feedback that examiners receive tends to be confirmatory. In addition, because field examiners are mainly concerned with the accuracy of their opinionsagainst available ground truth criteria, cases that yield inconclusive opinions (even though the examiner's score is conelusive and contradicted by outside criterion evidence) are not regarded as errors. As noted previously, ours is not the first CQT field study to report a substantial error rate for innocent subjects: Barland and Raskin (1976), Horvath (1977), and K l e i n m u n t z and Szucko (1984) reported false-positive rates of 55%, 49%, and 37%, respectively. However, in each of these studies, methodological weaknesses have been identified (cf. Iacono & Patrick, 1987, 1988; Raskin, 1987) that could account for their substantial error rates. Our data indicate that even when these methodological problems are eliminated--that is, when polygraph tests are con-
237
ducted by seasoned examiners using state-of-the-art procedures, and independent blind numerical evaluations of complete chart sets are validated against the best available criteria for ground t r u t h - - t h e observed hit rates may still contain biases related to case sampling factors. In particular, studies that rely exclusively on posttest confession-verified cases, and those that exclude tests associated with inconclusive opinions, are likely to overestimate the validity o f the CQT. These factors may help to account for the results of seven additional CQT field studies which, in contrast to the three studies mentioned above, all reported hit rates in excess o f 80% for innocent as well as guilty subjects (cf. Iacono & Patrick, 1987,1988). Of these, all but one (Bersh, 1969) relied exclusively on confession-verified cases listed by examiners or failed to report the criteria used to establish ground truth, and all seven either explicitly excluded inconclusive cases from consideration or failed to report criteria for case selection. Our own findings indicate that when solid criterion evidence is acquired for all possible cases and classifications are based on blind numerical scoring of the polygraph charts, chance-level accuracy figures are observed for innocent subjects. The fact that a large proportion o f innocent cases in the present study were verified independently of polygraph office records, and that these constituted the majority of conclusive outcomes contributing to the blind hit rate, reduces the likelihood that sampling biases influenced the accuracy estimate for this group. Independent criterion evidence for innocent cases was available due to the following: (a) continuing investigation of other suspects in the case following a truthful or inconclusive opinion, (b) a confession to the index crime by a suspect in an independent investigation, and (c) innocent recovery of merchandise believed to have been stolen, thereby exonerating polygraph test subjects. In contrast, little confidence can be placed in the very high accuracy estimate obtained for guilty subjects. As noted earlier, there was a very low probability that criterion evidence for guilty subjects would be obtained independently of the polygraph test, and therefore the hit rate for the guilty is based on a biased sample (i.e., made up almost entirely of subjects who confessed after producing deceptive charts). We should acknowledge, however, that variations in the practices of examiners and police investigators could modify this picture. For example, we have mentioned that in our sample the polygraph tended to be used as a last resort in case investigations. If law enforcement agencies were to use the polygraph routinely during the early stages of investigations, there might be greater opportunity for evidence to emerge that opposed a truthful CQT outcome, particularly if case investigators were skeptical of polygraph examiner opinions. In addition, the discrepancy we found between hit rates based on examiner log books on the one hand and police file data on the other presupposes a degree of independence between these two sources of information that may not exist in all agencies. Our main point is that, in future field studies of the CQT, selection factors that might result in the systematic exclusion of certain types of cases from a validity sample need to be considered. Our data suggest that alternatives to confession studies are needed to derive valid CQT hit rate figures for guilty subjects. One possibility is to consider a wider range of incriminating evidence, obtained independently of the polygraph test (e.g., judicial outcomes, physical evidence, or statements by wit-
238
CHRISTOPHER J. PATRICK AND WILLIAM G. IACONO
nesses or accomplices). Although the accuracy of ground truth would then become an issue, an analysis of hit rates across categories of criterion evidence could be revealing, particularly ifa drastic discontinuity was observed at some level of evidence. An alternative to the study of real-life cases is the analogue field study (cf. Iacono & Patrick, 1987), in which circumstances are arranged such that polygraph test subjects are genuinely concerned about the outcome of the test, and an incontrovertible criterion of guilt versus innocence is available for the entire sample. For example, in a recent mock crime study of this type, Patrick and Iacono (1989) tested prisoner subjects in a groupthreat situation in which participants were advised that monetary rewards for the group as a whole were dependent on individual test results and that if the rewards were lost the persons responsible would be identified to the group. A final implication of the present study's findings is that extrapolygraphic information plays an important role in opinions formed by field examiners and in the accuracy of those opinions. Examiners in the present study at times modified their scoring to yield inconclusive scores for charts that were conclusively deceptive according to blind analysis, and in other cases rendered inconclusiveopinions for charts they themselves scored as deceptive or rendered truthful opinions when their own scores were inconclusive. The general effect of these deviations from chart-based decision making was to improve substantially the hit rates produced by blind scoring: Whereas the hit rate for innocent subjects based on blind score classifications (55%) was not significantlygreater than chance, the hit rate based on examiner opinions (90%) was. Taken together, the finding of a 45% false-positive error rate when decisions were based only on the physiological recordings and the observation that examiners adjust their opinions in such a way as to reduce the number of erroneous decisions suggests that (a) the psychophysiological test by itself is biased against innocent people and (b) examiners rely on extrapolygraphic information to improve their decision-making accuracy. Ginton, Daie, Elaad, and Ben-Shakhar (1982) provided experimental evidence that observation of subject behaviors during a polygraph examination can contribute significantlyto classification accuracy. In addition to these types of cues, examiners in the present study also had access to prior investigative information for each case (e.g., police reports and discussions with the case investigator), which presumably could have influenced their decisions. Further research is needed to identify and quantify extrapolygraphic information that contributes to the accuracy of original examiner classifications. References Barland, G. H., & Raskin, D. C. (I973). Detection of deception. In W E Prokasy & D. C. Raskin (Eds.), Electrodermal activity in psychological research (pp. 418-477). San Diego, CA: Academic Press. Barland, G. H., & Raskin, D. C. (1975). An evaluation of field techniques in detection of deception. Psychophysiology 12, 321-330.
Bafland, G. H., & Raskin, D. C. (1976). Vafidity and reliability of polygraph examinations of criminal suspects (Report No. 76-1, Contract No. N1-99-0001).Washington, DC: National Institute of Justice, Department of Justice. Ben-Shakhar, G., Bar-Hillel, M., & Lieblich, I. (1986). Trial by polygraph: Scientific and judicial issues in lie detection. Behavioral Sciences and the Law, 4, 459-479. Bersh, E J. (1969). A validation of polygraph examiner judgments. Journal of Applied Psychology, 53, 399-403. Cohen, J. (1960). A coefficientof agreement for nominal scales. Educational and Psychological Measurement, 20, 37--46. Ginton, A., Daie, N., Elaad, E., & Ben-Shakhar, G. (1982). A method for evaluating the use of the polygraph in a real-lifesituation. Journal of Applied Psychology 67, 131- 137. Glass, G. V., & Hopkins, K. D. (1984). Statistical methods in education and psychology (2nd ed.). Englewood Cliffs, NJ: Prentice-Hall. Honts, C. R., Hodes, R. L., & Raskin, D. C. (1985). Effects of physical countermeasures on the physiological detection of deception. Journal of Applied Psychology 70, 177-187. Horvath, E S. (1977). The effect of selected variables on interpretation of polygraph records. Journal of Applied Psychology 61, 127-136. Iacono, W G. (in press). Can we determine the accuracy of polygraph tests? In P. K. Ackles, J, R. Jennings, & M. G. H. Coles (Eds.), Advances in psychophysiology (Vol. 4). Greenwich, CT: JAI Press. Iacono, W G., & Patrick, C. J. (1987). What psychologistsshould know about lie detection. In I. B. Weiner & A, Hess (Eds.), Handbook of forensic psychology (pp. 460-489). New York: Wiley. Iacono, W. G., & Patrick, C. J. (I988). Assessing deception: Polygraph techniques. In R. Rogers (Ed.), Clinical assessment of malingering and deception (pp. 205-233). New York: Guilford. Kleinmuntz, B., & Szucko, J. J. (1982). On the fallibilityof lie detection. Law and Society Review, 17, 85-104. Kleinmuntz, B., & Szucko, J. J. (1984). A fieldstudy of the fallibility of polygraphic lie detection. Nature, 308, 449-450. Lykken, D. T. (1974). Psychology and the lie detector industry. American Psychologist, 29, 725-739. Lykken, D. T. (1978). The psychopath and the lie detector. Psychophysiology 15, 137-142. Lykken, D. T. (1981). A tremor in the blood." Uses and abuses of the lie detector. New York: McGraw-Hill. Matt6, J. A. (1980). The art and science of the polygraph technique. Springfield, IL: Charles C. Thomas. Patrick, C. J., & Iacono, W. G. (1989). Psychopathy, threat, and polygraph test accuracy. Journal of Applied Psychology 74, 347-355. Raskin, D. C. (1986). The polygraph in 1986: Scientific, professional and legal issues surrounding applications and acceptance of polygraph evidence. Utah Law Review, 29-74. Raskin, D. C. (1987). Methodological issues in estimating polygraph accuracy in field applications. Canadian Journal of Behavioral Science, 19, 389-404. Raskin, D. C., & Hare, R. D. (1978). Psychopathy and detection of deception in a prison population. Psychophysiology 15, 126-136. Reid, J. E., & Inbau, E E. (1977). Truth and deception: The polygraph ("lie detector") technique (3rd ed.). Baltimore, MD: Williams & Wilkens. Received September 21, 1989 Revision received October 26, 1990 Accepted October 29, 1990 •