was $106. But if the herd grew to slightly more than double, the arc MNBe drops to about $6.34. Further additions to the herd add only about $0.61 per elk.
Valuing Wildlife for Efficient Multiple Use: Elk Versus Cattle Dennis C. Cory and William E. Martin A restructuring of current theoretical and empirical research efforts is required if valuation estimates are to be of use in multiple-use policy making, a restructuring that focuses on the impact of recreation quality on recreation benefits and efficient wildlife herd sizes. The argument is illustrated for cattle production and elk management on public lands.
If an entrepreneur has a given set of productive resources and is producing independent products for sale in a market economy, the efficient solution to the multiple-product question is clear: produce that combination of outputs so that the marginal rate of transformation along the production possibilities curve is equal to the inverse ratio of the marginal revenues for each pair of products taken two at a time. In situations where one or more of the products is not sold in the market under competitive conditions, for example recreational activities on the public lands, the efficient solution is not as clear. There is no competitive price for outdoor recreation. It was precisely this issue which prompted the development of techniques to estimate the value of nonmarket goods. A solution to this effort began with Hotelling in 1949 and refinements on that solution have continued to this day. The form of that solution has been to estimate the demand for the outdoor recreational experience-where the quantity of product has been expressed either in terms of number of trips, number of days,
Dennis C. Cory and William E. Martin are Associate Professor and Professor, respectively, in the Department of Agricultural Economics at the University of Arizona. This article is a contribution to Regional Research Project W-133, "Outdoor Recreation and the Public Interest." Thanks are given to Eric B. Oswald, Russell L. Gum, and to three anonymous referees for helpful comments. Arizona Agricultural Experiment Station Journal Article No. 4154. Western Journal of Agricultural Economics, 10(2): 282-293 © 1985 by the Western Agricultural Economics Association
or in cases where trips or days are rationed, by the number of applications. The two most-used procedures are the "travelcost method," and the "contingency-valuation method." The former method uses observations on actual trips taken, while the latter method asks recreators and potential recreators about their willingness to pay for recreational trips under alternative price and other conditions, such as the quality of the recreational experience. Given that demand for a quantity of trips or days has been estimated, the value of the site on which the recreation experience takes place is estimated as consumers' surplus-the area under the demand curve. In some cases, value has been expressed as compensating or equivalent variation-terms more correct theoretically, if not more precise empirically. While valuation information generated by traditional travel-cost and contingentvaluation methods is useful in choosing among mutually exclusive production alternatives on a given land base [e.g. Martin et al., 1978], additional information is required to make these estimates applicable in a multiple-use context. When outdoor recreation based on wildlife availability can coexist with extractive or productionoriented activities, subject to constraints imposed by the carrying capacity of the land, efficient multiple-use management requires marginal valuation estimates of wildlife numbers to compare to associated marginal net benefit impacts occurring for competing uses. That is, the value of changing the size of a wildlife herd must
Valuing Wildlife for Multiple Use
Cory and Martin
be compared to the value of altering alternative activities, such as the size of a cattle herd. Thus, knowing the total consumers' surplus generated by all hunting trips or the average consumers' surplus per trip, for example, gives no information that may be used to estimate the optimum numbers of cattle and game to be produced on a given range. Cattle and game are in competition. The socially optimum combination of cattle and game numbers is the desired management decision. The decision is not to eliminate completely one group or the other. To make the optimal decision, one must know the value of the marginal game animal, the value of the marginal cow, and the production possibilities tradeoff curve. The value of a day or a trip must be converted to the value of the marginal animal. Otherwise, the recreation value estimate-no matter how precise empirically or theoretically-has little management value.' The purpose of this paper is to illustrate estimation difficulties encountered in applying Pareto-optimal resource allocation models in a multiple-use context. In the following section, a simple multiple-use management model involving wildlife is constructed. Section three includes the results of estimating this model for Paretooptimal herd sizes for elk and cattle on U.S. Forest rangeland in east-central Arizona. The paper concludes with a discussion of the implications of these results for extending current recreation valuation procedures to the multiple-use management case and with specific suggestions for areas of future research. In particular, it is argued that a restructuring of current theoretical and empirical research efforts is required in wildlife economics if valuation estimates are to be of any use in 'Keith and Lyon [1985] make a similar argument in a paper focusing on a brief review of the few bioeconomic models that have been attempted, and where they offer their own bioeconomic model for deer. The multiple-use issue, however, has not been directly addressed.
multiple-use policymaking, a restructuring that focuses on the impact of recreation quality on recreation benefits and efficient wildlife herd sizes. In the following sections, concepts to relate demand for hunting and demand for cattle to the optimum multiple-use decision are developed and an empirical example is offered. The focus is on cattle production and elk management. Throughout the discussion, the assumption is made that public managers are making conscious decisions about the number of cattle allowed on the range and the number of elk hunters allowed to hunt. Thus, cattle numbers are controlled as on all public lands, and as with most hunting or fishing activities, the game harvest is controlled. In the case of elk in Arizona, successful applicants for a hunt are chosen by lottery. Modeling Efficient Multiple Use of Rangeland: A Minimal Specification Assume a rangeland of fixed size can be used for two purposes: elk hunting and cattle production. The two uses are not mutually exclusive. Given the carrying capacity of the range, feasible combinations of elk and cattle populations are given by the following linear production possibilities tradeoff curve: Q, =
- iaQe
(1)
where Qc = size of the cattle herd, Qe = size of the elk herd, and a, 3 are positive constants. 2 That is, if the entire rangeland 2
Linearity is not a crucial assumption in the model since Pareto-optimal decision rules can be easily derived for nonlinear specifications of (1). Linearity is imposed as a matter of expositional convenience since the empirical tradeoff curve estimated for the case study [O'Niel] has this form. Nelson [1982] has made preliminary estimates of more complicated forms. In practice, as pointed out by one anonymous referee, empirical specification of the biological tradeoff curve can in itself become a complex estimation task. The linear specification was suggested by wildlife managers in the field.
283
Western Journal of Agricultural Economics
December 1985
were used for cattle production, herd size is constrained to less than or equal to a by the land's carrying capacity. Similarly, elk herd size cannot exceed a/f. Possible combinations of Qc and Qe are given by
a)
(1).
Efficient multiple use of the rangeland requires the determination of Qc and Qe which will maximize the level of net benefits (NB) generated from its use subject to the carrying capacity constraint given by (1). Symbolically, MAX NB = NB,(QC) + NB,(Q,)
M-
C)
O
n-
U
(2)
!
Qo
Quantity of Cattle (Qc)
(QcQe)
s.t. fQe + Q, - a
Ql
Figure 1.
Supply and Demand for Cattle.
Qe, Qc > 0
where NBC is the net benefit function for cattle production and NBe is the net benefit function for elk hunting. Formulating the management problem in this way assumes that allocating rangeland to elk hunting and cattle production in this period has no irreversibility implications for future periods. The assumption of temporal independence makes a static or oneperiod analysis sufficient, since management can operate the rangeland resource efficiently by repeating the process of determining optimal herd sizes in each of the subsequent planning periods. In practice, dramatic changes in Qe and Qc from period to period could significantly affect future NBe and NBC through security of tenure issues in cattle production and uncertainty generated by inconsistency in elk-hunting policies [Martin]. For modest changes in herd sizes these issues can be ignored.
Estimating NB from Cattle Production For a given production area, as Qe increases Qc must decrease imposing a welfare loss in the market for cattle. This loss is illustrated in Figure 1. The market is assumed to be in initial equilibrium at "a" with Qc = Q0 and an equilibrium cattle price of P0. As cattle production is decreased, say from Q0 to Q1, equilibrium 284
price initially will rise to P1 then readjust downward as marginal suppliers enter the market (i.e. supply shifts from S to St causing market equilibrium to be restablished at b). The welfare loss after adjustment, assuming the production area was marginal, is given by dbae. The marginal loss in net benefits associated with reducing cattle production on the rangeland is composed of two parts: 1) a loss in producer surplus experienced by Arizona ranchers (dae), and 2) a net loss in consumer surplus (i.e., a loss in consumer surplus that is not simply a transfer to cattle producers) resulting from an increase in the equilibrium cattle price (dab). Since Arizona cattle production does not constitute a source of marginal supply, but is instead inframarginal, the loss in producer surplus is given by the area under the marginal profit function for cattle production on the range (Mro,). Estimating the net loss in consumer surplus would require a general equilibrium model to establish the new equilibrium cattle price. For purposes of this illustration, then, consumer price impacts are assumed negligible and dab = 0. Thus, MNBC = MNB,(Q,) = Mrc(Q,)
(3)
where Mxrc is the marginal profit function for cattle production.
Valuing Wildlife for Multiple Use
Cory and Martin
W°, respectively. The net benefits generated by Q0 then are given by4
Elk Numbers and Estimating Net Benefits from Elk Hunting The NBe function is derived from considerations involving the willingness-to-pay of elk hunters (We) for a hunting experience on the multiple-use rangeland. In particular, it is assumed that W, = W,(P, X, S)
NB W(T) dT NBO =
W°(T) dT
(7)
e
Now assume Qe is increased to Q1. A larger herd size for elk implies that T, S, and We will increase so that =
(4)
NBe =
T W(T) dT
We(T) dT
(8)
e o
where P is a vector of prices, X is a vector of other factors affecting willingness-topay, and S is the success rate of the hunt. Based on empirical evidence collected in this study, it is further assumed that dWe/ OS > 0 and d 2 We/dS 2 < 0. The success rate itself is assumed to be a function of the size of the elk herd and the number of hunting permits issued: S = S(Qe, T)
(5)
where T = number of hunting permits, and T = T(Q,, I)
(6)
where I is a vector of institutional considerations pertinent to the managing agency. Adding to wildlife numbers increases the success rate while raising the number of permits is hypothesized to decrease the success rate because of congestion externalities generated by additional hunters using a hunting ground of limited size (i.e., OS/OQe > 0 and aS/dT < 0). Further, it is assumed that higher wildlife numbers would justify issuing more hunting permits (OT/OQe > 0). These relationships are illustrated in Figure 2 where Pe is the exogenously-determined price of an elk hunting permit.3 Given elk herd size Q0, equations (6), (5), and (4) are used to determine TO, SO, and
3 P, is assumed exogenously determined since rationing occurs through participation in a lottery with the price of a hunting permit set high enough to cover a variety of administrative costs. That is, P, is a nonbinding constraint on participation and is institutionally determined.
From (7) and (8) it follows that the change in net benefits associated with increasing
the herd size from Q0 to Q1 is NBe = NB} - NBO =
I
(We - WO)dT +
OI
WdT TO
(9)
That is, the change in net benefits consists of a marginal quality effect experienced by inframarginal users and a marginal participation effect enjoyed by previously excluded hunters. 5
Optimal Herd Sizes Having derived the NBc and NBe rela-
tionships as functions of Qc and Qe respectively, rewrite (2) in Lagrangian form using (3) and (7): L = M7r,(Qe) + NB,(Qe) + X(a Q - Qc)
(10)
Taking the derivative of (10) with respect to Qc and Qe determines the following necessary conditions for efficient multiple use: MNBe - iX = 0
4
In this formulation permits are rationed on a willingness-to-pay basis. Obviously, rationing through a lottery does not fulfill these conditions. This assumption later is relaxed to allow for participation of a random subset of T hunters with a mean willingness-to-pay in excess of the exogenously determined price of the permit.
5
It is assumed, based on empirical evidence collected in this study, that
IOW,/aS -S/3OQ I > Iawe/aT -T/aQ . 285
Western Journal of Agricultural Economics
December 1985
I G)
Co C
MNBe
0-
-I( 4--
I-
I .
II
Number of Hunting Permits (T) Figure 2.
Demand for Elk Hunting Permits.
and M r -
= 0,
from which it follows that QC and Qe should be chosen such that MNB, = Mcr,
(11)
The decision rule given by (11) is illustrated in Figure 3. In Quadrant I, MNBe as a function of Qe is illustrated. Quadrant II shows the cattle-elk tradeoff curve, and Quadrant III depicts Mrc as a function of Q,. The size of the elk herd should be increased on efficiency grounds as long as MNBe > fM7rw foregone, reaching an efficient size when MNBe = fMTr,,, Qe =
Qe*, and Qc = Q*.
Figure 3.
Optimal Herd Sizes.
wildlife numbers. Since the average WTP is based on a sample of applicants consisting of all individuals with a willingnessto-pay in excess of the permit price, and the permit price is set far below that price which would eliminate a need for a lottery, estimated benefits will be lower than would occur for an economically efficient allocation. The Arizona case presents a particularly difficult estimation problem. In recent years, no systematic relationship has existed between elk herd size and the number of permits issued. The following estimation discussion considers two plausible special cases: either permits are assumed to be invariant with or proportional to elk numbers.
Estimation Modifications of the model are required for estimation purposes. In Arizona, permits are not allocated on a willingness-topay basis but rather by random lottery. In this case, the change in net hunting benefits resulting from increasing the elk herd size can be estimated by comparing the average willingness-to-pay of all applicants times the number of permits issued before the change in wildlife numbers with the new willingness-to-pay times the number of permits after the change in 286
Efficient Multiple Use of Rangeland: An Attempted Application
The Demand for Hunting Elk Helfrich [1981], using a random sample of Arizona Game and Fish elk hunting applications and mail survey methods, estimated demand for elk hunting trips in the Apache-Sitgreaves Forest Area using the contingent-value method. Demand was estimated separately for each of three
Valuing Wildlife for Multiple Use
Cory and Martin
TABLE 1. Regression Results (Student's t in Parentheses). Coefficients Dependent Variableb Total Permits
Average Success (All Hunts) Average Success (All Hunts) Rifle Permits
Average Rifle Success Archery Permits Average Archery Success
Number of Elk Observeda
Number Permits
1.30
.38
(2.27) 0.0042 (2.70) 0.0051 (4.44)
0.0007 (0.93)
.63 .63
-0.25
.18
(-1.84) 0.0091 (4.18) 1.54 (3.24) -0.0002 (-0.16)
Corrected R2
-0.0060 (-1.34)
.74
-.
47
0.0020 (3.33)
.64
a Since the number of elk observed is about 35 percent of the total number of elk in the area, for later calculab
tions dT/Qe. and aS/adQ assumed equal to 0.35 * estimated coefficient shown. Success is measured as elk killed as a percent of hunters in the field. Hunters in the field are slightly less than total permits issued.
hunts in 1979 on this area. The first was an early-fall rifle hunt with 3,840 applicants but only 400 permittees. The second hunt was a later-fall rifle hunt with 3,272 applicants and 1,500 permittees. The third hunt was an archery hunt for which there were only 371 first-choice applicants but for which 400 hunters were assigned permits. Additional details on the Helfrich study are included in Martin, Cory and Helfrich [1985]. Demand was estimated for all applicants. The potential total net benefit, if all applicants were allowed to hunt, was estimated as the total area under the demand curve given that demand truncates where it meets the institutionally-set permit fee. The early hunt had a success ratio of 34 kills per 100 permittees, the late hunt had a 13 percent success rate, and the archery hunt's rate was six percent. Each respondent was informed of the relevant success rate and was asked to determine their willingness-to-pay given a hypothetical situation in which hunters could expect a success rate 33 percent
higher. The new demand was estimated and new total social benefits were computed. Thus, an estimate was obtained of the change in willingness-to-pay as a function of the change in success-presumably with permits held constant so that congestion remained constant. Estimates of this type about quality changes have been somewhat common. They give information relative to equation (4). But, in order to make these data useful for management, data for equations (5) and (6) are required. Percent success (S) and number of permits (T) are published for each hunt in each management unit for each year [Arizona Department of Game and Fish]. A missing link is the number of elk in each unit. The Arizona Department of Game and Fish was contacted in order to obtain these missing data. They have indicated that such data could be generated, but have been unable to do so because of other commitments. As an alternative to obtaining such estimates, published data on elk numbers actually observed in a survey of 287
December 1985
some of the units were used [Arizona Department of Game and Fish]. Given the single estimate of elk numbers in 1979 for the area under study [O'Niel], it appears that the observers may see about 35 percent of total numbers. Obviously, this estimate is highly suspect. Lacking quantity estimates for many units, regressions were run using statewide data on permits and success from 1972 to 1983, and the numbers of elk actually observed, which later were assumed to be 35 percent of the total. Regressions were tried for rifle hunts, archery hunts, and total hunts combined. As hypothesized, total permits are related positively to the number of elk (Table 1). However, permit numbers are determined institutionally, and rifle permits lately have been held almost constant with rising elk numbers, the difference being made up with increased archery permits. The coefficient on permit numbers as related to success has the correct negative sign-showing congestion effects-only with respect to rifle permits. Further, archery success does not seem to be related to elk numbers. A difficult problem for evaluation is faced. If one uses the total permit equations, one assumes that permits rise with elk numbers and average success, and therefore average willingness-to-pay rises with elk numbers; and that there are no congestion difficulties. Under these circumstances the marginal net benefit of an additional elk never declines and equilibrium cannot occur. The archery-permit equations also indicate no congestion problems and even imply that additional elk have no effect on success. The "total" equations imply managing for all elk and no cattle with an infinite number of permits. The archery equations imply that success increases with hunter numbers, but elk are unnecessary. The rifle-permit equations do indicate that success is positively related to elk numbers and that increased permit num288
Western Journal of Agricultural Economics
bers would have congestion effects. Thus, an equilibrium solution would be possible if rifle permits were related positively to elk numbers. But because rifle-permit numbers are set without regard to elk numbers, additional elk do not create additional value associated with additional permits. The Value of Elk: Permits Held Constant Given these institutional restrictions and data limitations, an attempt is made to estimate the marginal value of an additional elk given that permits remain constant. Obviously, such an estimate will not lead to an efficient multiple-use solution but it will help illustrate the evaluation problem. The three groups of hunters surveyed by Helfrich indicated their marginal willingness-to-pay for improved hunting success, given their average base success. From these data one may compute an elasticity of willingness-to-pay with respect to success. That is: Ewtp
%AWTP
These elasticities were 0.36 for a hunting success of six to eight percent, 0.33 for a 13 to 17.3 percent success and zero for 34 to 45.3 percent success. Viewed as arc elasticities, they are shown in Figure 4. The implication is that if no additional permits are offered to the early-rifle-hunt group (who create 56 percent of potential value but only 20 percent of delivered value because their permits are so limited), additional elk create no additional value to that group. The elasticity of the archery group is high, but they too would create little additional value since they are small in numbers. Further, success does not appear to be related to elk numbers. Thus, if no additional permits are offered, additional elk have little value. The value of additional elk will accrue only to the
Valuing Wildlife for Multiple Use
Cory and Martin AA
I7,00C or
110
-a .40 44 E'la
3
LU >, .30 to
TNB e
0 Jw
90
i
80
& a,
Mu125,00C C
0
- .20
0 LU
o00o 150,000
(n
h
60
0 :w 0
a,
MNBe
I00,0
50
c
og
c
co
40 Z .10
z
nkI
U1
0
I
Percent Success Figure 4.
30 ,E co
C
,
75,000 I
I )
Elasticity of Willingness-to-Pay. Figure 5;. Elk.
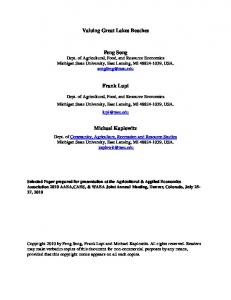
large late-hunt-rifle group. This value is estimated. Assume, from Table 1, that dS/QQ = 0.35 (0.0091) = 0.0032. Therefore, AQ = AS/0.0032. The change between a 13 and a 17.3 success rate would require 1,353 additional elk. The change from 17.3 to a 40 percent success rate would require 7,084 additional elk. The 1979 elk population of this hunting area was estimated at 1,270 [O'Niel]. Given the average arc elasticities between those changes in success (Figure 4) of 0.33 and 0.15, respectively, the changes in net benefits would be $8,580 and $4,320, respectively, the changes in net benefits would be $8,580 and $4,320, respectively. The results are shown in Figure 5. The current elk herd of 1,270 animals was generating (in 1979) total net benefits of $135,240, given the number of permits allotted. Total willingness-to-pay was $441,700, generated by 7,512 applicants, but only 2,300 applicants were permitted to hunt. The weighted average willingness-to-pay for an elk-hunting trip was $58.80. The average willingness-to-pay for a late-rifle-hunt trip was $52.48. If the elk herd were increased until the success rate was 40 percent for the late-rifle-hunt group, but permits were not increased, total net benefits would increase at a de-
20
17
u'
10 I
I
2,000 4,000
I
6,000 Qe
I
i
8,000 10,000
0
Total and Marginal Net Benefits of
creasing rate until a maximum of $148,140. A herd of approximately 9,700 elk would be needed. Average net benefits (or arc marginal net benefits) per elk at the 1979 herd size was $106. But if the herd grew to slightly more than double, the arc MNBe drops to about $6.34. Further additions to the herd add only about $0.61 per elk.
The Value of Elk: Permits Allowed to Vary An alternative attempt at evaluation using the available data is based on the riflepermit equations for success, but assumes that all permits vary with elk numbers in the same proportion. Total permits are assumed to increase at half the rate estimated as shown in Table 1, reflecting the higher success rate for rifle hunting versus archery. This assumption is arbitrary, but is a reasonable management alternative given the estimated coefficients. Beginning at the mean success of all hunters of 15.4 percent, E,,w = 0.33 when reading from Figure 4. Let each AQe = 500. Then each AT = 114 for 500 additional elk. The net S equals 1.36 percentplus 1.60 for quantity and minus 0.24 for additional permits. Thus, one can compute the %AS. Knowing the elasticity of 289
December 1985
Western Journal of Agricultural Economics
percent change in willingness-to-pay with respect to percent change in success, one may solve for the change in average willingness-to-pay for an elk hunting trip. The new average willingness-to-pay is multiplied by the new total number of permits. 6 Under these asumptions, total net benefits increase at a decreasing rate. Marginal net benefits decline as hypothesized. The arc MNBe for the additional 500 elk drops to about $21.86 and declines slowly. Beef Values
return of negative $30 per AUY. Should price per pound rise to $0.80, long-run marginal net return per AUY could reach $25. Obviously, cattle prices and ranch size make a difference in the value of producers' surplus per animal.
Multiple-Use Equilibrium Too little information is available to make a precise judgment even about some sort of second-best solution to the multiple-use question where, not only are elk permits allocated by lottery rather than by price, but permits are not related to quantity of elk. Further, annual producer surplus to ranchers has a wide variance. Still a few observations may be informative. Assume that yearling cattle prices are at $0.58 per pound. Only producer surplus values are considered. A beef-cattle animal unit is valued as if raised on the larger ranches. Long-run marginal producers' surplus is valued at $37 per animal and is assumed constant over the range of values to be considered. The average value of an elk in the same area at the same time was $106. For a very small change the average value could be assumed to be close to the marginal value. An optimum is obtained where MNBe = f3Mrc. In this area, / is estimated as equal to 0.5 [O'Niel]. Therefore:
Martin and Snider [1980] have estimated both long-run and short-run values of an animal unit year (AUY) of forage used for cattle production on central Arizona mountain ranches. This area overlaps much of the same area as analyzed for elk values. Short-run returns to forage exclude all fixed costs. Long-run returns to forage recognize depreciation and interest on capital equipment and improvements. Long-run return basically is an estimate of the return to the land and forage itself from the producers' point of view. It is an estimate of producers' surplus per beef animal grazed. Costs were in 1977 prices. Return per AUY depends on the size of the operating unit. The larger ranches in this area are about 700 AUYs. With yearling steers at $0.58 per pound (near-current February 1985 values) the long-run marginal value of an AUY is approxiMNBe = 106 > 0.5(37) = 18.50 =-Mr,, mately $37.7 Smaller ranch units do not fare as well. At $0.58 per pound, a 150- This very rough evaluation implies that in AUY ranch has a long-run marginal net this area cattle and elk numbers appear 6
The change in permits is --- AQe or 0.35(1.30) (500)/2. The net change in success is AS a-AT or 0.35(0.0091)(500)
-
-AQe
-
0.35(0.0060)114.
Coefficients are from Table 1, modified as explained in the text. 7 The long-run marginal value of an AUY measures the value of an additional animal on the range, assuming that range conditions and fixed capital remain constant.
290
far apart from a social equilibrium. The marginal elk is much more valuable than the marginal beef animal. In making this evaluation, simplifications were required. Most ranchers do not achieve the assumed level of efficiency and therefore do not have the assumed level of producers' surplus. Using estimates for the larger ranches tends to narrow the difference in value between cattle and elk. On the other hand, the value of marginal
Cory and Martin
consumers' surplus for beef is ignored completely. This assumption tends to widen the difference in value. In the case of elk hunting, value is derived from the average value per person per trip over all hunt applicants. The value would be higher if hunts were allocated to the highest bidders. Additionally, in computing the average value per applicant, all potential hunters with values above the low institutionally-set permit price are included. Thus, the computed average value is a function of the institutionally-set price and would be higher if the price was set higher. While for elk the above evaluation really uses average values per animal given current animal numbers, and computed marginal values for elk are quite small, current cattle and elk numbers do appear out of equilibriumparticularly when the biases in the analysis are considered. Conclusions Methods for estimating demand for both market and nonmarket goods have been developed to the point where rather precise knowledge can be gained in a static framework. But as this report illustrates, even in a rather simple multiple-use context, little can be said about the optimum combinations of products for which to manage. The model developed and estimated in this research abstracts from several relevant aspects of a multiple-use management problem involving wildlife. The analysis was static. In practice, dynamic considerations, such as discounting, accounting for changing output prices and preferences, and time lags involved in adjusting wildlife herd sizes to efficient levels, must play a key role in formulating pragmatic, effective policy. The model ignores the costs of wildlife management, and assumes that these costs and the costs of cattle production are independent. Clearly, wildlife-management costs must be considered in evaluating the marginal net
Valuing Wildlife for Multiple Use
benefits of adjusting wildlife herd sizes, and typically external effects will be imposed on cattle operations from augmenting wildlife numbers and associated consumptive uses. Finally, a comprehensive analysis would have to consider the impacts on recreation activity at substitute sites as recreation quality, in terms of hunting success, is changed at the site under investigation. While extending the model to account for optimization over time, interdepen-
dent costs and substitute sites, is a straightforward exercise theoretically, the implications of such an extension for applied management are at best unclear. The estimation problems posed by even a simple model, such as the one developed here, are considerable. While significant difficulty can be encountered in each of the three areas invovled in a multiple-use valuation of wildlife (i.e., estimating biological tradeoff curves, marginal net benefits of wildlife numbers, and marginal net benefits of cattle production), progress on these fronts is uneven. A great deal of theoretical and empirical effort has been spent on refining measurements of producer and consumer surplus impacts in established markets. Both the theoretical justification and empirical estimation of alternative measures of net benefit impacts resulting from quantity changes have been developed and can be readily applied to cattle production in a multipleuse context. While less is known about the carrying capacity of rangeland in multiple-use contexts, advances in this area primarily will come from research conducted in the biological and plant sciences in cooperation with resource economists and planners. The remaining arena for theoretical and estimation refinement involves the evaluation of the relationships among willingness-to-pay for a recreational experience, recreation quality and wildlife numbers. A variety of factors interact in determining recreation quality, but recent sur291
December 1985
vey results suggest that hunting success plays a dominant role in quality determination [Miller]. As illustrated in the estimation presented earlier, hunting success can provide the crucial link between wildlife numbers and recreation benefits. Two areas for future theoretical and empirical research are suggested. First, the relationship between hunting success and the size of wildlife herds needs to be investigated further. Having established the existence and nature of this relationship for different types of wildlife, a second research need centers around the relationship between willingness-to-pay and hunting success. Specifically, knowledge about the elasticity of willingness-to-pay with respect to hunting success is required over a large range of success rates for various types of wildlife. This information then could be used in a variety of theoretical and empirical contexts similar to the way price elasticity information concerning cattle markets has been used in the past. Such elasticity information need not be site specific, as are current estimates of willingness-to-pay for recreational trips or days, and could be of wide use to managers across regions. Such a research effort would dramatically change the focus of recent efforts away from refinements of travel-cost and contingent-valuation methodologies toward an emphasis on relating marginal changes in wildlife numbers to recreation benefits through quality considerations. Estimating demand for recreational trips related to both the consumptive and nonconsumptive use of wildlife has become a standard procedure. Improvements to obtain more precision are being suggested daily. Unless those demand estimates can be related to wildlife numbers, however, the economists' claim of assisting management is hollow. Further, unless wildlife is managed so that there are direct linkages between demand for quality, demand for trips and wildlife numbers, little can be said about wildlife 292
Western Journalof Agricultural Economics
values. In the case of Arizona where allocation of rifle-hunting permits is unrelated to elk numbers, marginal elk lose any potential value through administrative fiat. References Arizona Department of Game and Fish. "Arizona Game Survey and Harvest: Data Summary." Mimeographed report. Annual. Helfrich, M. A. P. "Towards Estimating the Optimum Combination of Cattle and Elk on the Apache-Sitgreaves National Forest of Arizona." Unpublished Masters Thesis, Department of Agricultural Economics, University of Arizona, 1981. Hotelling, H. "The Economics of Public Recreation." The Prewitt Report. Mimeographed. Land and Recreation Planning Division, National Park Service, Washington, D.C., 1949. Keith, J. E. and K. S. Lyon. "Recreation and Dynamics: The Role of Economics in Management." Western Journal of Agricultural Economics 10(1985):2 216-222. Martin, W. E. "The Distribution of Benefits and Costs Associated with Public Rangelands." Presented at a conference sponsored by the Wilderness Society, "Federal Lands and the U.S. Economy: Striking a Balance in the 1980s and 1990s." Airlie House, Warrenton, Virginia, November 15-16, 1982. In Public Lands and the U.S. Economy, George M. Schuster and Peter M. Emerson (eds.). Westview, Boulder, Colorado, 1984. Martin, W. E., D. C. Cory, and M. A. Helfrich. "Valuing Wildlife for Efficient Multiple Use: An Arizona Case Study." College of Agriculture Report No. 35, Department of Agricultural Economics, University of Arizona, 1985. Martin, W. E. and Gary Snider. "The Value of Forage for Grazing Cattle in the Salt-Verde Basin of Arizona." Report No. 22, Department of Agricultural Economics, University of Arizona, 1980. Martin, W. E., J. C. Tinney, and R. L. Gum. "A Welfare Economic Analysis of the Potential Competition Between Hunting and Cattle Ranching." Western Journal of Agricultural Economics 3(1978): 87-97. Miller, J. R. "Game Availability and Hunter Partic-
Cory and Martin ipation: A Study of Washington Elk Hunting." The
Annuals of Regional Science 3(1982): 79-94. Nelson, J. R. "Relationships of Elk and Other Large
Herbivores." In Elk of North American Ecology and Management, Jack Ward Thomas and Dale
Valuing Wildlife for Multiple Use E. Towcill (eds.). Stackpole Books, Harrisburg, Pennsylvania, 1982. O'Niel, J. Personal communications. Region I Game Specialist, Arizona Game and Fish Department, Pinetop, Arizona, 1981.
293