Annotation of Emotions in Real-Life Video Interviews: ... different coders on a subset of complex real-life emotional segments selected from the EmoTV Corpus ...
Annotation of Emotions in Real-Life Video Interviews: Variability between Coders S. Abrilian, L. Devillers, J-C. Martin LIMSI-CNRS, BP 133, 91403 Orsay Cedex, France {abrilian, devil, martin}@limsi.fr Abstract Research on emotional real-life data has to tackle the problem of their annotation. The annotation of emotional corpora raises the issue of how different coders perceive the same multimodal emotional behaviour. The long-term goal of this paper is to produce a guideline for the selection of annotators. The LIMSI team is working towards the definition of a coding scheme integrating emotion, context and multimodal annotations. We present the current defined coding scheme for emotion annotation, and the use of soft vectors for representing a mixture of emotions. This paper describes a perceptive test of emotion annotations and the results obtained with 40 different coders on a subset of complex real-life emotional segments selected from the EmoTV Corpus collected at LIMSI. The results of this first study validate previous annotations of emotion mixtures and highlight the difference of annotation between male and female coders.
term goal of this paper is to produce a guideline for the selection of annotators.
1. Introduction The annotation of emotional corpora raises the issue of how different coders perceive the same multimodal emotional behaviour. This is even truer for video corpora of real-life emotions as compared to mono-modal corpora of acted emotions. Real-life video corpora such as the Belfast corpus (Douglas-Cowie et al, 2003) and the EmoTV corpus (Devillers, Abrilian and Martin, 2005) illustrate everyday life contexts in which emotions are often complex: shaded, masked and mixed, partly due to social conventions (Douglas-Cowie, et al, 2005). Indeed, due to the high subjectivity involved in the perception of emotion, most of emotion studies rely on more than two coders (usually between 2 and 5). As they usually involve the annotation of emotional behaviour with a single verbal label, majority voting techniques are often used to select a single winner label. Yet, the complexity of real-life data makes it difficult to define a list of relevant discrete emotional labels, as well as the selection of a single label per emotional segment, since coders might be able to perceive combinations of emotions. Furthermore, such a subjective annotation of emotional data might benefit from the individual differences between coders with respect to their emotional skills (e.g. some might be able to point out masked emotions; some others might easily show empathy). But how many coders should be recruited? How should these coders be selected with respect to gender, age, level of expertise in the study of emotions, personality, or native language? How do these individual characteristics influence their perception of complex emotions during the annotation process? The first goal of this paper is to verify the annotations done by three annotators compared to those obtained with a larger set of annotators on complex mixed real-life emotions. The second objective of this paper is to study the distance between a reference vector (obtained with a large set of annotators) and the vectors produced by each class of coders (age, gender, expertise, etc.). The long-
This paper reports the study and results of a perceptual test: 40 subjects annotated 3 emotional segments displaying complex emotional behaviours selected from the EmoTV corpus. We believe that such experimental studies of coder variability will be helpful for the design of protocols dedicated to the study of real-life emotions in audio-visual corpora.
2. Corpus EmoTV is a corpus of 51 video clips recorded from French TV channels containing interviews on 24 different topics (politic, religion, sport…) (Abrilian et al., 2005). The corpus is in French and consists of 48 subjects, the total duration of the corpus is 12mn (average length of 14s per clip) and the lexicon size is 800 words (total number of words: 2500). EmoTV video clips have been selected with the following constraints: Interviews during news (2 people, only one visible), no spoken feedback from the journalist who interviews, people are recorded in the same position in front of the camera with their upper body visible. Our corpus is well balanced between positive and negative emotions. It is also rich in blended emotions such as conflictual valences, i.e. positive relief blended with sadness. Clips also show rich emotional behaviours expressed by gestures, facial expressions and speech (prosody and verbal content). Previous annotations by three coders have shown that around 50% of the clips feature mixed emotions with multi-modal conflictual cues (Devillers, Abrilian and Martin, 2005).
3. Emotion representation 3.1.
Annotation scheme
Our coding scheme (Devillers, Abrilian and Martin, 2005) is based on a multi-level representation of emotion where emotion is represented both by abstract dimensions and categorical labels. Our annotation scheme features two classical abstract dimensions: activation (passive, normal, active) and
2004
valence (negative, neutral, positive). Intensity (low, normal, high) and control dimensions (controlled, normal, uncontrolled) were added since they provide relevant information for the study of real-life emotion. The real-life emotions we observed led us to propose an annotation scheme with a combination of two labels (a major and a minor) for each segment and to propose the following typology of non-basic emotional patterns: • Blended emotions: two emotions are merged, and occur at the same time, • Masked acted emotion: the videotaped person is masking her real emotion, like a joy mask (by smiling) with a real disappointment behind, • Sequence: two emotions, one occurring shortly after the other, in a single emotional segment, • Cause-effect conflict: for example positive/negative conflict (e.g. to cry for joy and relief), • Ambiguity between two emotions in a same broad class (e.g. anger and irritation). The list of the 18 categorical labels used for emotion annotation is: anger, despair, disappointment, disgust, doubt, embarrassment, exaltation, fear, irritation, joy, neutral, pleased, pride, sadness, serenity, shame, surprise and worry. These labels were grouped into 7 macroclasses in Table 1. Negative labels Anger Irritation
Positive labels Joy Exaltation Pleased Serenity Pride
Other labels Surprise
Disgust Fear Doubt Worry Embarrassment Shame Sadness Despair Disappointment
Table 1: 7 Macro-classes of verbal labels (without Neutral) Furthermore, a global description of perceived signs of emotion in the different modalities is also annotated.
3.2.
Soft vector of emotions
Since segments were labelled by more than one coder and also since the coders could assign one or two labels to each segment, it was necessary to integrate these multiple labels in a single representation of the emotional behaviour. Let us consider each annotation as a vector (Major, Minor). The N (Major, Minor) vectors (for N annotators) were combined to produce an emotion soft vector (Devillers, Abrilian, Martin, 2005), (Devillers, Vidrascu, Lamel, 2005). Different weights are assigned to the different annotations: one weight for the Major emotions (wM) and another one to the Minor emotions (wm). For two annotators, the two vectors are added, W being the sum of the weights. The resulting soft vector size is the number of different emotional classes used by the annotators (see Table 2).
Soft vector of emotions: Labeller 1 Major anger, Minor fear Labeller 2 Major anger, Minor sadness Conversion into an emotion vector: (wM/W anger, wm/W fear, wm/W sadness) Table 2: Example of the representation of the decisions of two labellers for an emotion: for example, for wM=2, wm=1, W is the sum of the weights (6): the emotion vector is thus: (0.66 anger, 0.17 fear, 0.17 sadness)
4. Perceptive test 4.1.
Description and Protocol
The three segments of the perceptive test are extracted from one of the EmoTV clips. A woman is emotionally reacting to a law decision that she considers as unfair (her father and brother are being kept in jail). This video involves several emotional behaviours and multimodal cues (tears, voice quality, gesture, posture, face, etc.). The perceptive test involved a high number (40) of coders compared to similar studies. Each subject had to annotate the three segments of a clip with the following information: • Emotion labels, • Emotion-type, • Abstract dimensions, • And global multimodal cues. Each coder had also to fill a questionnaire providing information about gender, age, expertise and comments about the test difficulty. We obtained three groups of coders (see Table 3); gender, age and expertise. Coders were aged between 21 and 55 (average 28). The class Age was split into the “Student”/“No student” classes. There were few experts compared to naïve coders. In this study, we mainly report the difference between male and female groups. For the other groups, the repartition is too unbalanced to provide reliable results. Gender Male (25) Female(15) Age Student (30) No student (10) Expertise No expert (34) Expert (6) Table 3: Coders repartition in 3 classes
4.2.
Annotation validation strategy
Rather than only measuring the inter-coder variability as a validation measure, our validation strategy also considers the intra-coder consistency by checking the compatibility between the dimensions and the verbal labels selected by each coder. 11 coders showing such inconsistencies were observed in the test. But these inconsistencies occurred only once or twice. So, these 11 coders have been kept in our inter-coder analysis and reference soft vectors described in the following sub-sections.
2005
4.3.
to underline the perceptive richness provided by a large number of coders.
Validation of previous annotations
Table 4 presents a comparison of the annotation results obtained from 2 experiments. The first one consisted in the annotation, by 3 subjects (two males/one female, one student/two no-students, three experts) of emotion, context, and high level multimodal description of 11 video clips containing a total of 48 segments (Devillers, Abrilian and Martin, 2005). 3 of the annotated segments are the ones used for the second experiment, described in this paper. Annotations of labels, emotion-type and dimensions: intensity, valence, control, and activation, are listed in this table.
Segment 1
Previous annotation with 3 expert coders Emerging labels
1.00 Anger
Pattern
1.00 Single
Avg. Intensity Avg. Valence Avg. Control Avg. Activation
3.3 2.0 3.6 3.3 0.67 Anger, 0.11 Despair, 0.11 Disappointment, 0.11 Sadness
Segment 2
Emerging labels
Pattern Avg. Intensity Avg. Valence Avg. Control Avg. Activation
Segment 3
Emerging labels
0.67 Blend , 0.33 Single 4.0 1.3 2.6 4.0 0.56 Despair, 0.33 Anger, 0.11 Sadness
Pattern
0.67 Blend, 0.33 Sequence
Avg. Intensity Avg. Valence Avg. Control Avg. Activation
3.6 1.0 1.3 4.6
Annotation with 40 other coders (than the three experts) 0.282 Anger, 0.214 Irritation, 0.171 Worry, 0.145 Despair 0.32 Blend, 0.30 Single, 0.17 Masked-Acted, 0.15 Ambiguity 3.2 2.3 3.1 3.1 0.317 Anger , 0.183 Sadness , 0.158 Disgust , 0.133 Despair , 0.100 Irritation 0.30 Sequence, 0.25 Blend, 0.22 MaskedActed, 0.20 Single 3.7 2.1 2.8 4.0
4.4.
Inter-coder analyses
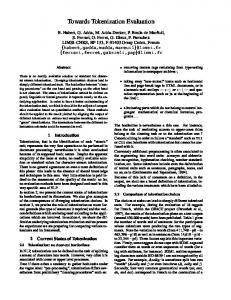
4.4.1. Emotion-type 78% of the 40 coders (9% more for women than for men) have used a mixture as emotion-type for the three segments; 69% for segment 1, 80% for segment 2 and 85% for the last. As we can see in Figure 1, no female coders have chosen a single emotion-type for the segment 3. In all the following tables and figures, “seg” stands for segment.
40% 20% 0 seg 1
seg 2
seg 3
Female (15) Male (25)
Figure 1: Proportion of single emotion-type for males and females for the three segments (seg1, seg2, seg3) of the clip. The repartition of the emotion-types “mixtures” during the clip for the 40 coders is given in Figure 2. The first segment has been perceived mainly with blended and masked emotion and also a lot of ambiguities. The second segment has been perceived as featuring more sequential emotions than the 1st segment. In the last segment, there are less masked emotions perceived, which corresponds to the fact that the woman did not control her emotion at the end of the clip (she was speaking with tears in the voice).
0.383 Despair, 0.250 Sadness, 0.208 Anger
100%
0.37 Sequence, 0.25 Blend, 0.15 Single, 0.12 Ambiguity, 0.10 Masked-Acted 4.4 1.9 2.1 4.3
80%
cause-effect
60%
sequential masked
40%
ambiguity 20%
blended
0% seg 1 seg 2 seg 3
Table 4: Comparison of 2 annotation experiments, on the same data; by 3 coders and then 40 other coders. The results show that the winning label is the same in both experiments, for all the 3 segments. Moreover, for the segments 2 and 3, the same 3 labels despair, anger, and sadness, are annotated by the two groups of coders. In fact, most of listed attributes have similar values. These results permit to validate the annotations, to consolidate the use of 3 expert coders for this kind of experiment, and
Figure 2: Repartition of the 78% of emotion-type “mixtures” for the three segments; in fact 69% for segment 1, 80% for segment 2 and 85% for the third Those results show the complexity of the mixtures of emotion. The perception of the mixtures of emotions differs between males and females. Female coders
2006
perceived 25% more ambiguous emotion and 15% more masked emotion than male coders. 4.4.2. Emotion labels Table 5 shows the winner label obtained with a majority voting technique for all 40 coders, Male (25), Female (15), Student (30) and No student (10), Expert (6) and No expert (34) coders. It is remarkable that the annotation differences are only between male and female coders. Thus, It seems fundamental to have coders of both genders in order to enrich the emotion annotation. For the other groups (age and expertise), the results should be confirmed with a more representative set of coders.
All coders Male Female Students No students Experts No experts
Seg 1 Anger Anger Worry Anger Anger Anger Anger
Seg 2 Anger Anger Sadness Anger Anger Anger Anger
Seg 3 Despair Sadness Despair Despair Despair Despair Despair
The set of winner labels contains 4 verbal labels: anger, despair, sadness and worry. The best combinations of two labels for all coders and for female and male are given in Table 6. For two labels, there is more variability than for one label but finally there is only 5 different labels perceived. Seg 1 Anger/Despair Disgust/Sadness Anger/Worry
Seg 2 Anger/Sadness Anger/Disgust Anger/Disgust
Seg 1 3.2 (1.0) 3.2 (1.1) 3.1 (0.7) Seg 1 2.3 (0.6) 2.4 (0.4) 2.1 (0.6) Seg 1 3.1 (1.1) 3.2 (1.1) 2.7 (1.0) Seg 1 3.1 (1.0) 3.1 (1.1) 3.0 (0.8)
Seg 2 3.7 (0.8) 3.8 (0.8) 3.6 (0.7) Seg 2 2.1 (1.0) 2.2 (1.0) 1.9 (1.0) Seg 2 2.8 (1.0) 2.6 (1.1) 2.9 (0.8) Seg 2 4.0 (0.8) 4.2 (0.7) 3.9 (0.8)
Seg 3 4.4 (0.7) 4.3 (0.8) 4.6 (0.5) Seg 3 1.9 (1.3) 2.0 (1.1)) 1.7 (1.4) Seg 3 2.1 (1.1) 2.0 (1.1) 2.1 (1.1) Seg 3 4.3 (0.7) 4.2 (0.6) 4.3 (0.8)
Table 7: Average Intensity, Valence, Control and Activation annotations, and standard deviation.
Table 5: The winner label with a majority voting technique for each segment.
All coders Male
Intensity All coders Male Female Valence All coders Male Female Control All coders Male Female Activation All coders Male Female
Seg 3 Despair/Sadness Anger/Despair
4.4.4. Multimodal cues In Table 8, the multimodal cues are set to 1 if at least half of the coders checked that modality; otherwise they are set to 0. We can see few differences between female and male coders ; male coders checked more torso and brows cues than female coders who checked eyes cues.
Group of Coders Speech Torso Head Shoulders Eyes Brows Mouth Gestures
Seg 1 All M
F
Seg 2 All M
F
Seg 3 All M
F
1 0 1 0 1 0 0 0
1 0 1 0 1 0 0 0
1 0 1 0 1 0 0 1
1 0 1 0 1 0 0 1
1 0 1 0 1 0 0 1
1 0 1 0 1 0 1 1
1 0 1 0 0 0 0 0
1 1 1 0 1 1 0 1
1 1 1 0 1 0 0 1
Female Worry/? Sadness/Anger Despair/Anger Table 6: The best Major/Minor pair (or pairs if two pairs are equal, Major/? if there are more than two pairs) for all coders and for female and male coders.
Table 8: Multimodal cues for all coders and for male and female coders.
4.4.3. Dimensions For each annotated label, the average and the standard deviation of the intensity, valence, control and activation have been computed. The values are summarized in Table 7. All the values are given for each segment between 1 to 5; 1 being low or negative and 5 high or positive. The trends are the same for all coders and the female and male group of coders. The average intensity and activation increase during the sequence of the three segments. The average valence is negative and seems to decrease at the end of the clip. The average control is also decreasing at the end of the clip. Female coders perceived the third segment as being more negative and more intense than the male coders did. This comes from the Major label chosen by the coders; despair for females and sadness for males (see Table 5). Globally speaking, there is a good inter-rater agreement (standard deviation often inferior to 1). Furthermore, Standard deviation is often decreasing in the last segment showing a better reliability of annotations for the last segment.
Each subject answered a question about the difficulty of the task. We measured the correlation between the effective difficulties of the task by using the time necessary to achieve the perceptive test with the subjective perception of this difficulty declared in the questionnaire (Table 9). The average test duration is 20mns (19.7 for females, 20.8 for males). There is a balanced repartition of the test difficulty judgment in the different groups of coders. Difficult Easy 23mn 18mn Table 9: Average time of the test for a difficult or easy test qualifier (“easy” stands for “easy” and “fairly easy” judgments, “difficult” for “quite difficult” to “very difficult”)
4.4.5.
4.5.
2007
Qualitative annotation
Study of the number of coders for emotion labelling
4.5.1.
Soft vector of emotions on 40 coders
We combined the different annotations of the 40 coders into a soft emotion vector for each emotional segment. These soft vectors are used as reference vectors for the comparison between sub-vectors computed from the annotations for different subsets of coders (Figure 3). Each soft-vector has the same size corresponding to the number of labels. Here the vector size is 18. Table 10 shows the non null coefficient of each vector. If we remove the values of the vector under chance level (1/18) we obtain 4, 5 and 3 different labels respectively for the 3 segments revealing the complexity of the emotions. These vectors also show the evolution of the emotions across the segments. One can see this evolution in the combinations Anger-Irritation, decreasing from segment 1 to segment 3, and Sadness-Despair, increasing. The 40 coders used a total number of 10 labels for describing the emotion perceived in the first segment, 9 for the second segment, and 8 for the third one. This shows 1) the subtlety of natural complex emotions (more than half of proposed labels were used), and 2) the evolution of the emotion’s
complexity (less labels annotated from segment to segment). (0.29 Anger, 0,21Irritation, 0.17 Worry, 0.14 Despair, 0.07 Disappointment, 0.05, Seg 1 Sadness, 0.02 Disgust, 0.02 Shame, 0.02 Fear, 0.01 Pride) (0.32 Anger, 0.18 Sadness, 0.16 Disgust, 0.13 Despair, 0.1, Irritation, 0.05 Seg 2 Disappointment, 0.02 Shame, 0.02 Worry, 0.02 Pride) (0.38 Despair, 0.25 Sadness, 0.21 Anger, 0.09 Disgust, 0.02 Irritation, 0.02 Seg 3 Disappointment, 0.02 Exaltation, 0.01 Shame) Table 10: Labels reference soft vectors
50 45
43,2 39,1
40 35
31,8 30,7
Distance
30
Segment1 25
25 27,5
Segment2
23,3 19,1
20
Segment3 17 15,6
15,9 14,3
15 14,3 10
15,3 13
13,5
14,2 10,7
5 0 Three
Five
Ten
Fifteen
Tw enty
Tw enty five
Figure 3: Average distance between the reference vector of each segment and the annotations done by sets of random selections of 3, 5, 10, 15, 20, 25 coders. perception of the 40 coders for the 3 segments are all female coders (8/8, one is selected twice), young (8/8) and 1/8 is an expert. Figure 3 gives the average distance between different sets of coders. The curve decreases until fifteen coders then seems to be nearly stabilized.
In order to evaluate the relation between the number of coders involved in the annotation process and the reference soft vectors, we started by considering subsets of the annotations produced by 3 coders. We computed the Euclidian distance between the annotations produced by any group of 3 coders and the 3 reference vectors (one for each segment). The minimum and average distances are listed in Table 11.
4.5.2. Soft vector of emotions per macro-classes Table 12 shows the soft-vectors computed with the 7 macro-classes instead of the 18 labels.
3 coders Seg 1 Seg 2 Seg 3 Minimum distance 11.2 9.9 9.6 Average distance 35.6 34.1 28.9 Table 11: Minimum and average distances between a 3coders soft vector and the reference soft vectors of the three segments.
(0.49 Anger, 0.26 Sadness, 0.18 Fear, 0.03 Disgust, 0.03 Embarrassment, 0.01 Joy) (0.41 Anger, 0.38 Sadness, 0.15 Disgust, Seg 2 0.03 Fear, 0.03 Embarrassment, 0.01 Joy) (0.64 Sadness, 0.24 Anger, 0.09 Disgust, Seg 3 0.02 Joy, 0.01 Embarrassment) Table 12: Macro-classes reference soft vectors These macro-class vectors give a better view of the emotions emerging from the annotations. For instance, Seg 1
The minimum and average distances tend to decrease from the first segment to the third segment showing the meaningfulness of the context (and also of the learning of the annotation task) for the selection of labels. For this study, the three most representative subjects of the
2008
in the case of segment 1, in the label reference vector, anger, irritation and worry are the most weighted labels, and one needs the macro-class reference vector to see that sadness is strongly present, but divided in despair, sadness and disappointment labels. These macro-class vectors also amplify the results observed with label vectors; anger and sadness are always present and vary oppositely across the segments. Figure 4 shows the average distances evolution between the macro-class soft vectors of random choice of 3, 5, 10,
15, 20, 25 coders, and the macro-class reference softvector of the 40 coders. Comparing to the convergence curves observed in Figure 3, the macro-class ones show lower distances to the reference vectors for all the subsets of coders. One can see, in both Figure 3 and Figure 4, that the distances between reference vectors and vectors of 3 coders are relatively high, and that these distances decrease significantly for 5 and 10 coders. Then for 15, 20 and 25 coders, the variation is less visible.
40
35
33,4
30
Distance
25
22,623,7 Segment1
19,5 20
Segment2
19,2 19,2 19,5
16,5
Segment3
13,6
15
13,1
12,9
11,6 12,2
10
10,5
10,4 8,4
5
10,3 7,8
0 Three
Five
Ten
Fifteen
Tw enty
Tw enty five
Figure 4: Average distance between the macro-class reference and macro-class annotations done by sets of random selections of 3, 5, 10, 15, 20, 25 coders.
5. Conclusion
6. References
This experiment, involving a large number of subjects, permit us to evaluate the difficulty of annotating real life emotions and to point out the differences of emotion perception between the male and the female coders. Indeed, this experiment showed interesting differences concerning emotion labelling in the first hand, males focusing on aggressiveness (anger) and females on deeper feelings (despair, worry); and multimodal cues perception in the other hand, males perceiving torso and brows movements, while females detect eyes movements. Similarities between the soft-vectors computed from the annotations of the 40 coders and the previous experiment with 3 coders show the consistency of the annotations, and validate them, as well as they validate the coding scheme defined for those experiments. We will extend the study by balancing the groups of coders, more experts and no students will be involved in this experiment. Personality tests have already begun on a subset of the coders; we will complete these tests in order to study the impact of personality on the perception of emotions in real life data.
Douglas-Cowie, E., Campbell, N., Cowie, R. and Roach, P. (2003), “Emotional speech; Towards a new generation of databases”, Speech Communication, 40(1-2), pp.33-60. Devillers, Vidrascu & Lamel, (2005). “Challenges in reallife emotion annotation and machine learning based detection”, Neural Networks 18/4, pp.407-422. Devillers, Abrilian, & Martin, (2005). “Representing Real-life Emotions un Audiovisual Data with Non Basic Emotional Patterns and Context Features”, ACII 2005. Douglas-Cowie, E., Devillers, L., Martin, J-C., Cowie, R., Savvidou, S. Abrilian, S., Cox, C. (2005) “Multimodal databases of everyday emotion: content and labelling”, Interspeech 2005. Abrilian, S., Devillers, L., Buisine, S., Martin, J-C (2005), “EmoTV1: Annotation of Real-life Emotions for the Specification of Multimodal Affective Interfaces”, HCI International.
Acknowledgement This work was partly funded by the FP6 IST HUMAINE Network of Excellence (http://emotionresearch.net).
2009