Evolutionary Design of Gene Networks: Forced Evolution by Genomic Parasites A.V. Spirov1,2, E.A. Zagriychuk2 and D.M. Holloway3 1
Computer Science and CEWIT, SUNY Stony Brook, 1500 Stony Brook Road, Stony Brook, NY 11794, USA, 2The Sechenov Institute of Evolutionary Physiology & Biochemistry, Thorez Pr. 44, St.-Petersburg, 2194223, Russia (e-mails:
[email protected];
[email protected]). 3Mathematics Department, British Columbia Institute of Technology, 3700 Willingdon Avenue, Burnaby, B.C., Canada, V5G 3H2 (e-mail:
[email protected]).
ABSTRACT The co-evolution of species with their genomic parasites (transposons) is thought to be one of the primary ways of rewiring gene regulatory networks (GRNs). We develop a framework for conducting evolutionary computations (EC) using the transposon mechanism. We find that the selective pressure of transposons can speed evolutionary searches for solutions and lead to outgrowth of GRNs (through co-option of new genes to acquire insensitivity to the attacking transposons). We test the approach by finding GRNs which can solve a fundamental problem in developmental biology: how GRNs in early embryo development can robustly read maternal signaling gradients, despite continued attacks on the genome by transposons. We observed co-evolutionary oscillations in the abundance of particular GRNs and their transposons, reminiscent of predator-prey or host-parasite dynamics. In addition to modeling genomic evolution, we feel these oscillations may offer a new technique in EC for overcoming premature convergence.
Keywords: Evolution in Silico, Evolutionary Design, Genomes, Genomic Parasites, Artificial Transposons, Co-Evolution, Gene Networks, Gene Co-option, Complexification, Genetic Algorithms.
1 Introduction Modelling is becoming increasingly used in biology to both explore theoretical principles and synthesize vast amounts of data. The study of evolution is one of the central pillars of biology, and has both inspired a number of techniques in computer science and benefited from the application of computer modelling. In computer science, this has led to the development of the field of Evolutionary Computation (EC), with such sub-fields as Genetic Algorithms (GA) and Evolutionary Programming (EP). A number of highly efficient optimization algorithms have been developed along these lines. EC was initially motivated and has largely been developed following some fundamental biological principles of evolution, such as mutation, selection, reproduction. However, knowledge of evolutionary biology has progressed rapidly in recent decades, and there are many aspects of evolutionary dynamics which have not been applied in EC. There is a large potential for improved algorithms and new applications for EC [Cf. 1, 2, 3, 4]. In this paper, we specifically discuss developments in molecular evolution which are being approached with EC. We present a new technique that incorporates the mechanism of mobile genetic elements (transposons) into EC, and test it on a fundamental problem in embryo development – segmentation of the insect body plan. Evolution of gene regulatory networks While evolutionary selection operates on individuals, these individuals develop from embryos according to their genes and the regulatory interactions connecting their genes (gene regulatory networks, GRNs). Understanding the mechanisms by which the unique form of one species transforms into the form of another species involves understanding the evolutionary dynamics of the GRNs controlling an individual’s form. Computational modelling of evolvable GRNs can elucidate evolutionary processes, which can then be used to improve EC. A number of groups are involved in modelling GRN evolution (evolution in silico), it is less common to apply these principles to EC. (A complementary approach to evolution in silico is the reconstruction of GRNs from gene expression data, or GRN evolutionary design.) Many of the evolution in silico approaches use a ‘coarse-grained’ approach, in which the interactions between genes are represented by a regulatory matrix Wi←J, where i←J denotes the action of the transcription factor J (encoded by 1
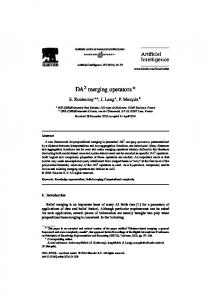
gene j) on gene i (reviewed in [5]). In such an approach, a gene is a black box with simple pairwise interactions with other genes. GRN evolution in silico can also be done at a more detailed ‘fine-grained’ level that accounts for DNA sequence information (though this comes with increased computational cost; [5, 6, 7, 8]). Real mutation occurs at this level, so fine-grained modelling allows for the study of evolutionary dynamics at this level, and the development of new areas of EC. Fig. 1 illustrates the general GRN evolution in silico approach: a population of individual GRNs is generated; these are solved, for example to create gene expression patterns; the patterns are scored against fitness criteria, for example data on gene expression patterns; the fittest individuals reproduce; these survivors are subject to mutation (in the genes or their regulatory parameters); and the cycle repeats. Multiple rounds of rewiring (changing the network connections) and retuning (changing the connection strengths) optimizes the GRN for a particular function. The coarse- or fine-grained level at which the GRN dynamics are represented determines the level at which mutation operates. In coarse-grained approaches, mutation directly alters gene-gene interactions; in fine-grained approaches, mutations in the DNA can be simulated, and gene-gene interactions are affected as a natural consequence (as well as producing a closer simulation of the dynamic response to a DNA alteration). In general, the dynamics of even the best studied and smallest GRNs are incompletely characterized. Evolution in silico offers the substantial advantage that it can operate with incomplete or simple models and generate families of solutions which solve the constraints. This allows us to study potential GRN designs, begin to understand how these designs might have evolved, and map these findings to the molecular and fossil record of evolution. In model development, too rigid an adherence to all the known details of a GRN can constrain the breadth of an evolutionary simulation, essentially over-determining to a particular species; this must be balanced against simulations with generic models, in which numerous GRN types may be generated that solve a particular problem. These may provide the range of possibilities encountered in evolution, but in the end should not contradict known data. With respect to constraints, modelling can also aid in understanding particular features of a GRN. For instance, if most parameters of a model are held fixed, evolution of a particular gene connection, connection type or connection strength can help characterize the role of this gene and its dynamics in the network.
Figure 1. Schematic of GRN evolution in silico. Differential equations for each network are integrated (step 1). The fitness function is computed from the steady state of each network (step 2). The fittest 50% of solutions (networks) are retained (selection), copied (reproduction, step 3) and randomly mutated (step 4). Mutations change parameters (kinetics) or the network connections themselves, as shown here. (after [9])
2
DNA can be altered in a number of ways biologically, from point mutation of single bases to exchange of large sequences of material, as in inheritance from parent to child (particularly during the crossover stage of recombination) or infection by a pathogen (e.g. a virus). EC approaches have traditionally employed the simplest of these mechanisms, point mutation. Incorporation of more complex alteration mechanisms offer one of the richest areas for extending and improving EC. Transposable elements In prior work, we have presented new EC approaches using crossover mechanisms, including ones inspired by the mechanisms used in retroviral infections [6, 7]. Here, we present an EC approach using mobile genetic elements (transposons, or transposable elements, TEs) to alter GRNs. These sequences have tags which enable them to copy themselves into new locations in the host genome [10, 11, 12, 13, 14, 15]. Transposons are ubiquitous and may comprise up to 45% of an organism's genome [12, 14, 15, 16]. Studies indicate that TEs can be a major source of genetic change, leading to the creation of novel genes, the alteration of gene functions, and major genomic rearrangements [11, 12, 13, 17, 18, 19]. While TEs provide a means for diversifying the genome (contributing to evolvability), they have also been characterized as genomic parasites or ‘selfish DNA’: a transposon landing into a critical region of the host DNA can disrupt functions and be quite deleterious. While such transpositions can disrupt existing regulatory elements, transposons may also provide a rich pool of regulatory elements that contribute to the long-term evolutionary potential of the population in a beneficial manner [20, 21]. For instance, the Alu transposon may constitute up to 10% of the DNA in human cells, and has been implicated in binding of the developmentally critical hormone retinoic acid [22, 23, 24]. Co-evolution Co-existence with transposons, and either their negative or positive effects, requires host genomes to respond evolutionarily. That is, host genomes must adapt by co-evolving with their transposon ‘parasites’. By implementing transposons in EC, and allowing for evolution of the host GRNs, we can study such co-evolutionary dynamics. In particular, we can study how factors such as how transposon invasion rate, spread rate and evolutionary response of the host genome affect GRN function. We describe specific results below, but as a general principle we find coevolutionary algorithms produce more effective searches by restricting (explicitly or implicitly) the search space, as well as tending to avoid premature convergence: we focus on the biological problem of evolution of developmental GRNs, but the technique has broader potential in improving EC efficiency. Early applications of co-evolution in GA were by Potter and De Jong [25, 26, 27], for optimizing functions in engineering applications; and by Hillis [28], who used a competition operator. We extend these approaches with the introduction of transposon biology. In contrast to the earlier approaches, selection is not based on a direct ‘selection operator’, but by survivability of the host, i.e. the relative ability of the host to solve required functions. Computationally, transposons are represented as sequences within a genetic ‘string’, and have the autonomy to be transmitted vertically, from one generation to another, or horizontally, from one individual to another. In silico evolution of a population of genetic strings (individuals) represents the co-evolution of the host and transposon DNA.
GRN outgrowth In considering the response of the host genome to transposon pressure, we need to consider the means by which GRNs can evolve. A major theme that has emerged in recent years is that GRNs tend to evolve by gene co-option: instead of developing genes de novo, existing genes in one network can become incorporated into another (existing) network, acquiring novel functions in the new network [29, 30]. Instead of involving major changes in DNA coding sequences (instructions for the transcription of RNA/protein products), co-option can occur by relatively minor changes in the DNA of regulatory sequences, the elements upstream of the coding region to which regulatory transcription factors (TFs) bind and control the expression of the coding regions. Gene co-option (or recruitment) can serve as a major factor in GRNs becoming more complex in evolutionary time (network outgrowth). While there has been more attention in recent years on GRN outgrowth, it is not well characterized what forces might influence co-option. Recruitment may occur by chance (at a very low level) and then be subject to evolution. Or, there may be special evolutionary mechanisms performing recruitment, which could more complicated rearrangements of genetic material. Transposons might be involved in evolutionary events at this level. In our model, we account for outgrowth by allowing for recruitment of genes to an existing GRN. Within the co-evolutionary framework, this allows us to explore what factors in transposon-host interactions contribute to GRN outgrowth; for instance, as a first hypothesis, whether transposons force GRNs towards higher complexity due to negative selection.
3
GRN modelling GRNs have been represented at numerous levels in computational models, from discrete, local descriptions to continuous, spatially-distributed descriptions (see review in [5]). Local descriptions are adequate for the temporal dynamics of a GRN, while spatially-distributed approaches are necessary for gene expression across embryological tissues. Discrete (e.g. Boolean) models can provide a coarse approximation of gene states, while finer description of gene expression may require a continuous (differential equation) approach. Spatial dependence may require incorporation of transport terms for gene products (e.g. protein diffusion). Computational cost generally increases the finer the description of the process. For evolution in silico of GRNs, any of the parameters in the model may be affected by mutation, with the fitness of the individual GRN depending on the resulting functionality of the GRN model for solving particular problems. Drosophila We develop and test our transposon-genome EC approach on the particular case of body segmentation of the fruit fly, Drosophila. This model genetic organism is extremely well characterized, experimentally and theoretically, providing the basis for data-driven model development. A number of groups have done modelling projects on both the GRN design [31, 32, 33, 34, 35, 36, 37, 38] and in silico evolution (e.g. [5, 6, 7, 8, 39, 40]) of the gene network determining the early anterior-posterior (AP) positioning of gene expression. (See the HOX pro Web resource [41, 42] for a catalogue of the known regulatory elements for the gene ensemble: ). This early patterning produces the differentiation of the body into distinct segments. Working in Drosophila allows us to build GRN models from known quantitative data on gene expression. In addition, with respect to the current project, the evolutionary significance of transposons has been directly studied in the Drosophila genome ([43, 44]), and comparative work within insects provides evidence for gene co-option and network complexification [45, 46]. For instance, the transition from grasshoppers to flies appears to have occurred with a doubling of number of genes in the segmentation network (at least) over a short geological time span. GRN Spatial Patterning The task of our model is to produce the developmentally observed patterns of gene expression in early Drosophila segmentation. Fitness of an individual GRN is scored by how well the GRN solutions fit the experimental data. We focus on the earliest stages of this process: activation of the segmentation GRN in response to the concentration gradient of maternally-supplied protein. Ability to respond to such morphogenetic gradients is a property of many fundamental GRNs in developmental biology. In our simulations, we are able to characterize how functionality of the GRN (ability to read the gradient and produce good pattern) is maintained in the presence of transposon pressure. Transposon mobilization Studies of transposons in the Drosophila genome have shown a number of intriguing features which we can explore with our EC approach. It appears that TEs can lie dormant in a host genome for some time, until some stress factor (temperature, irradiation, DNA damage, the introduction of foreign chromatin, viruses, etc.) activates them. Lozovskaya [47] described the phenomenon of hybrid dysgenesis, in which multiple unrelated TEs are mobilized simultaneously via host genome destabilization. (This process was generally termed “genomic shock” by McClintock [48].) The insertion of activated TEs into a number of loci can then lead to altered gene expression patterns. It also appears that there are different classes of TEs, in terms of number of copies per genome and the degree of predetermination of insertion sites: TEs with high and low specificity for insertion sites have both been described. Selective pressures can vary substantially between different TE classes, and among different Drosophila species. This has led to discussion of possible alternative strategies for TE-Drosophila genome interaction, such as selection against insertional mutations [49] vs. consideration of the deleterious effect of chromosomal rearrangements due to recombinational events between TE insertions. In the present project, we present results on simulating genomic shock, in which TE activation bursts and attacks key genes in the segmentation GRN. While EC was initially inspired by biological evolution, we feel that there is a large potential to extend and improve EC through the introduction of operators from modern molecular genetics [7, 50, 51]. Towards that end, in this paper we describe our implementation of transposable elements into an EC framework [for previous work in this area see [51, 52, 53, 54, 55, 56, 57, 58, 59, 60, 61, 62, 63, 64, 65]. By developing this model on the well-studied case of early segmentation in Drosophila, we can use the EC approach to address biological questions of how early embryological patterning maintains robustness to transposon pressure. In particular, the model allows us to explore in what way the features of the dynamics (e.g. transposon insertion rate, gene recruitment rate) affect patterning and robustness. While our main focus is on using EC to uncover GRN design, the efficiencies introduced by transposon-genome coevolution in EC are promising for improving optimization in general.
4
2 Methods We introduce the following extensions to the general EC framework of repeated cycles of mutation, selection and reproduction: 1) variable-length genomes; 2) corresponding operators for reproduction, point mutation and crossover; 3) artificial TEs; and 4) operators for TE invasion and transposition. 1. Variable-length genomes. Unlike most classical GA approaches (but like GP), we use variable-length genomes (chromosomes). As in GP, growth of the genome in our algorithm is limited: every genome can have up to nine separate strings/chromosomes (Fig. 2). Each chromosome represents one gene. Each gene is represented by up to three 4-letter words, separated by spacers. Using a 3-letter alphabet (A, T, C) gives 34 = 81 possible words (summarized in Table 1). GRN dynamics are simulated by the regulation of genes by transcription factors (TFs) which are encoded by the genes. TF dynamics are simulated by Hill kinetics (eq. 1, described below). The binding strength of a TF on the 9 genes is given by the weights at the bottom of Table 1. I.e., each word corresponds to a weight number used in the Hill kinetics parameters. a) b) c) d) e) f) g) h)
'AAAT*AACA*AATA'; 'CAAA*ACAA'; 'CCAA*ACCA*CCCC'; 'AAAA'; 'AAAA*AAAG*CAAA'; ''; 'AAAA*AAAG'; and so on
Figure 2. Organization of an individual's genome. Each genome consists of nine genes (variable length strings). Each string can include up to three four-letter words separated by spacers (asterisks ‘*’). We use a three-letter alphabet (A, T, C), giving 34 = 81 possible distinct 4-letter words, as summarized in Table 1.
Variable-length operators for duplication, elimination and random addition can be applied independently to every chromosome (gene). Chromosomes are acted upon by standard operators for reproduction, point mutation and crossover, as well as the transposition operators defined below. Table 1. The target sites "dictionary".
Factor M:'AAAA' 'AAAT' 'AAAC' 'AATA' 'AATT' 'AATC' 'AACA' 'AACT' 'AACC' Factor A:'ATAA' 'ATAT' 'ATAC' 'ATTA' 'ATTT' 'ATTC' 'ATCA' 'ATCT' 'ATCC' Factor B:'ACAA' 'ACAT' 'ACAC' 'ACTA' 'ACTT' 'ACTC' 'ACCA' 'ACCT' 'ACCC' Factor C:'TAAA' 'TAAT' 'TAAC' 'TATA' 'TATT' 'TATC' 'TACA' 'TACT' 'TACC' Factor D:'TTAA' 'TTAT' 'TTAC' 'TTTA' 'TTTT' 'TTTC' 'TTCA' 'TTCT' 'TTCC' Factor E:'TCAA' 'TCAT' 'TCAC' 'TCTA' 'TCTT' 'TCTC' 'TCCA' 'TCCT' 'TCCC' Factor F:'CAAA' 'CAAT' 'CAAC' 'CATA' 'CATT' 'CATC' 'CACA' 'CACT' 'CACC' Factor G:'CTAA' 'CTAT' 'CTAC' 'CTTA' 'CTTT' 'CTTC' 'CTCA' 'CTCT' 'CTCC' Factor H:'CCAA' 'CCAT' 'CCAC' 'CCTA' 'CCTT' 'CCTC' 'CCCA' 'CCCT' 'CCCC' weight
1
2
3
4
5
6
7
8
9
2. Artificial transposons. TEs spread within the population of evolving genomes by being transmitted from donor to recipient strings (chosen at random). Every genome has vacant strings to record TE target sequences (there are 3 TE sequences, shown in grey in Table 1). TEs can only insert at the target sequences, and these targets are in definite sites of definite genes (as in nature). If this gene is eliminated, or the insertion site is mutated, the TE strain cannot infect the genome. Insertion of a TE will result in subsequent elimination of the genome at N reproductive cycles from onset of the infection. Therefore, the overall chance for an infected genome to leave progeny decreases progressively with every new cycle. Progeny can inherit TEs by chance. We develop new operators (procedures) to implement invasion, transmission, and mutation of TEs: Procedure INVASION: randomly choose host genomes and search for the TE sequences. If the pattern is found, the individual is infected by the TE. The procedure records (in a reserved place in the genome) the “life countdown” number.
5
Procedure COUNT_DOWN runs in each cycle (before reproduction, after scoring), scanning through the host population and decrementing the life countdown number. When an individual’s life countdown number reaches “0”, it is eliminated. Procedure TRANSMISSION randomly selects pairs of host genomes and performs TE transmission. This implements horizontal transmission, if one of hosts is infected and the other has the TE recognition pattern. “Life countdown” is filled in for the newly infected individual, as above. An estimated typical rate of transpositions in natural populations of Drosophila (number of transpositions per element per generation) is of the order 10-4 [66]. For simulations we use faster rates, on the order of two to three orders of magnitude higher. Procedure TE_MUTATION is a standard GA mutation operator, which only differs in the usage of a symbol string instead of a binary one. Mutation of i-th symbol of TE sequences (if any) of the k-th individual substitutes any given letter (A,T,C) for another one with equal probability. In a stagnant mature homogeneous population practically all hosts will be infected according to these operators. The TE strains collected by a mature population would cross-recognize all genes. Hence, a selective advantage could be gained by mutants which develop a new genome structure, while retaining GRN functionality. 3. Mutation and Recombination Operators. We use a standard GA mutation operator, which only differs in the usage of a symbol string instead of a binary one (like TE_MUTATION). Mutation of i-th symbol of j-th gene of the k-th individual substitutes any given letter (A,T,C) for another one with equal probability. Crossover is standard one-point crossover operator, exchanging parts between arbitrarily chosen pairs of genes in randomly chosen pairs of individuals. 4. Transposition Operators. We used fixed transposon coordinates to transmit transposons from host to host. The two-place transmission operator was implemented as follows: the genomes of a randomly chosen pair of hosts were checked for TE sequences. If a TE was found in one of the hosts (donor) but not in the other (acceptor), a copy of the TE is transmitted from donor to acceptor, as long as the acceptor has appropriate sequences (for the TE) in appropriate sites (genes). 5. Initial Population. An initial population is generated of several thousand individuals. Each individual is composed of K strings of genes (in this publication K=7). The first gene (a), is obligatory, meaning that the (a) expression profile is the only character under selection. The other, optional, genes are initially inactive. Each genotype has several TE sequences. Space is allocated for recording the TE in each genome. 6. Genotype-Phenotype Mapping. Natural selection operates at the level of the population of individuals (phenotypes). I.e. phenotype is subject to direct selection. For segmentation patterns, phenotype is the gene expression pattern generated by the GRN. Parameters for the differential equations model (below) of the GRN are encoded in the EC chromosomes (genotype). At each generation, these parameters are used to solve the differential equations. Solutions are the gene expression patterns, which are scored for goodness of fit to experimental images. The primary developmental event we are modelling is reading of the morphogenetic gradient, M, by embryonic genes a-h (initially, only the obligatory gene a). Initial generations select for gene (a) dynamics which best fit segmentation patterns in response to gradient m. (Additional genes are co-opted in response to TE infection, see below.) For each generation, gene expression patterns are calculated as follows. First, a subroutine scans each gene string for TF target sites, and records the corresponding weights from Table 1. For simplicity we assume that each gene encodes either an activator or a repressor of the other genes. We further assume that simple cooperative Hill kinetics applies [67]; for gene x activated by TF z (product of gene Z):
dX
dt
=
Zn (C x Z ) m
(1)
This yields cooperative activation at small values of Z for n > 1. For m > n, inhibition occurs for large values of Z. n is the number of target sites in a gene for morphogen factor M (from 1 to 3); m is the sum of the weights from Table 1. For example, if gene (a) has three target sites for M (sequence 'AAAT*AACA*AATA') n=3. Table 1 gives weights of 2, 4, and 7 for that sequence, so m = 2 + 4 + 7 = 13. Equations (1), for all genes, are solved numerically [68] by Euler’s method (in 1D, representing the AP axis of the embryo). The solutions are plotted as concentration profiles (e.g. Fig. 5). In terms of the Wi←J matrix in the Introduction, each gene i corresponds to a row in W and each element of the row describes the regulatory action of the TFs encoded by genes in the GRN (including self-effects). However, a Wi←J element is only non-zero if it has at least one target site for factor J in gene (i), otherwise the element is zero.
6
7.
Scoring. Fitness was calculated according to the difference between GRN solutions (concentrations a i mod el
) and data (concentrations idata ): a
E (via mod el via data ) 2
(2)
b
The following parameter values were used in this publication: size of population, popul = 2000; mutation rate (P/bit)/generation, MU= 0.09; crossover rate (P/bit)/generation, CRS = 0.03; transposition rate (P/bit)/generation, TRP = 0.05; initial TE invasion rate (P/bit)/generation, INV = 0.03; TE transition rate (P/bit)/generation, TRANS= 0.60; TE mutation rate, in %% from host’s rate, VirMu= 10; Parameter N for the COUNT_DOWN procedure, N=1.
3 Results and Discussion Since the primary function of the segmentation GRN in this study is to read the external gradient M, we have focused our TE-GRN co-evolution computations on the ability of the artificial transposons to isolate GRNs from M. In the model, TE sequences are in the M gene, so that transposons attack the M activation sites.
GRN rewiring via co-evolution with transposons In this study, the population was initiated with individuals containing seven chromosomes (three target-sites each). Each individual obtained the genome: a) b) c) d) e) f) g)
'AAAT*AACA*AATA'; 'CAAA*ACAA*AAAA'; 'CCAA*ACCA*CCCC'; 'CACA*ACAC*AAAA'; 'AAAA*AAAG*CAAA'; 'CAAA*ACAA*AAAA'; 'AAAA*AAAG*CAAA';
Each individual then undergoes mutation followed by TE invasion. The INVASION procedure scans the genome for TE sequences (AAAT, AACA, & AATA; Table 1, grey), and finds the three sites in the (a) gene. Note that the TE sequences are 3 of the 9 sequences for the M gradient, and (a) is initially the only gene reading the M gradient. The genome is tagged for invasion (the intervening mutation step could not have removed all of the TE sites). The initial genome was constructed so as to generate the simplest expression patterns for evolutionary tuning. From a bellshaped M profile, the simplest gene (a) expression (from eq. 1, activating at low M and inhibiting at high M) is the 2domain pattern shown in Fig. 3. In the initial population most individuals have one active gene (gene (a); the first mutation step may create M binding sites in other genes, but this is unlikely). In these cases, the other genes (b-h) represent a pool of potential genes that can be co-opted into the GRN to read the M gradient. The total number of genes, the sequence of their recruitment and their regulatory relations are pre-determined in these simulations.
a. b.
dA
dt
=
Mn (C a M ) l
A
7
c. Figure 3. Functional organization of individuals in the initial population (a), corresponding kinetic equation (b), and corresponding concentration profiles (c). a). Morphogen M activates gene (a) in a concentration-dependent manner. The target sites (4-letter words) for M in the (a) gene become the first "shooting mark" for the attack of transposable elements. The rest of the genes ((b), (c), (d), etc.) are available for cooption and free to mutate and evolve. b). Hill’s law activation of gene (a) by morphogen M and first-order degradation of A. M is the morphogen concentration; A is the gene (a) product concentration; Ca, n, l, , are parameters of the Hill equation. c). Spatial pattern of (a)-gene expression. The M factor gradient (red) controls A-gene expression in concentration-dependent manner (that is, higher concentrations of M repress gene (a)). As a result, the bell-shaped profile of M activates (a) in two symmetrical peaks.
With this initial configuration, the population is immediately infected with TE (initial TE strain, from external source; Fig. 3a), since the M sequences for gene (a) are also TE sequences. The output in Fig. 3c is a good fit to the target data, and scores well in terms of E (eq. (2)). However, the immediate infection of gene (a) interferes with its M activation; the transposon disrupts the regulatory connection from M to (a). Because reading out the gradient is the main function of the GRN, the transposon drastically reduces the score of the “infected” GRN. As a consequence, the infected individual can live no longer than N cycles of reproduction, with a low chance for leaving progeny. The initial TE infection can also now be transmitted both horizontally (to other hosts) and vertically (to the next generation). In this case, TE infection has immediate negative impact on the GRN function. However, the pool of potential genes offers an indirect selective advantage if they can be recruited quickly enough to maintain GRN function. For example, TE infection of gene (a) can impart an indirect selective pressure on mutations in gene (b) to become activated by M (Fig. 4). If gene (a) acquires the ability to be activated by B, the functioning of the newly found GRN becomes appropriate. We call these first successful mutants type 1 GRNs.
a. 8
dB
b.
dC
dt
dt
dA
Mn
= =
dt
(C a M ) l
M j (C c M ) i
=
Bk ( Cb B ) q
B C C A
Figure 4. Functional organization of the GRN with the first two recruited genes (a), and corresponding system of kinetic equations (b). a) Recruitment of gene (b) enables gene (a) to acquire resistance to the initial TE infection. Gene (c) tends to be recruited also because C acts as a repressor and helps to shape the A profile two-domain form. b) Gene (b) is activated by M in a concentration dependent manner in accordance with eq. (1). Gene (a) is activated by B in the concentration-dependent way also. M is the morphogen concentration; A, B are concentrations of products of genes A, B, correspondingly; Ca, Cb, Cc,, I, j, n, l, k , q, α, , , μ, , , φ are parameters of the Hill equation.
Another example of a type 1 pattern is shown in Fig. 5A. In this case, genes (b) and (c) are coopted into the GRN. Mutations in genes (a) and (c) produce (by chance) the B-specific binding sites and B becomes an activator for genes (a) and (c). Factor B is encoded by gene (b) via concentration-dependent activation by M. In so doing, the GRN gets rid of the negative selective pressure of the initial TE infection. C acts as a repressor of (a), in this way shaping the main A domain to fit to the desired profile (Fig. 5A black; Fig. 3c). In the example shown in Fig. 5A, the (a) gene is expressed in two pairs of domains, but only one pair fits to the desired pattern. The computation did not apply penalties for extra domains of (a) expression (though this could be implemented). Type 1 GRNs emerge very quickly in simulated evolution, co-opting the (b) and (c) genes to eliminate the initial TE negative selective pressure, and rewiring the GRN. Reduction of TE sites in gene (a) confers a selective advantage on the mutants. The new GRN obtains a good score and is insensitive to the initial TE infection. Hence, the GRN soon becomes abundant in the population. Moreover, the indirect pressure of selection results in high heterogeneity of mutants, because they are selected in the model not only by phenotype score, but by resistance to the initial TE as well. By definition, gene (b) can be also a target for the TE initial strain (if mutation create the TE sites in (b)). It means that the type 1 GRN mutants (Fig. 4) will be under TE attack very soon. As with the previous scenario, new genes can be recruited to the type 1 GRN to respond to avoid the TE selective pressure. And in turn, new, mutant strains of TE (the TE_MUTATION procedure, Methods section) can appear to invade the new GRN. A representative example of a new type 2 GRN is shown in Fig. 5B. In this example, besides newly recruited genes (b) and later (d), the list of potential recruits also includes gene (c) and later gene (e). These genes act on their targets as repressors and are able to correct patterns of genes (a) and (b), raising scores and generating increasingly complex GRNs which are completely insensitive to the initial TE.
A
9
B
C Figure 5. Representative examples of patterns producing by individuals with good score at consecutive stages of computer evolution (co-evolution of GRNs with artificial TEs). A) Representative example of a type 1 GRN pattern, produced by the initial TE selective pressure. Two new genes, (b) and (c), have been co-opted into the GRN. Factor B (green), encoded by gene (b), acquires the function of activator for genes (a) and (c). C (red) acts as a repressor of (a), shaping the main A domain (blue) to fit to the desired profile (black; also Fig. 3c). B) Representative example of a type 2 GRN pattern. Two genes, (b) and (d), are coopted in GRN. The factor D, encoded by gene (d) acquires the function of a morphogen for gene (a). In so doing, the GRN gets rid of the selective pressure of the initial TE infection. C) A type 3 pattern. Three genes, (b), (c) and (d), are coopted into the GRN. The factor D, encoded by gene (d) acts as an activator for genes (a) and (c). In time, the cycles of resistance and attack repeat, leading to increasingly complex networks. A type 3 GRN is shown in Fig. 5C, in which it appears gene (c) has wired into the type 2 GRN shown in Fig. 5B. In general, TE pressure induces the GRNs to co-opt increasing numbers of genes: the co-evolutionary process tends to select larger and increasingly complex GRNs.
Evolutionary search of complex expression patterns via GRN – TE co-evolution The results of Fig. 5C suggest that gene (c) is not obligatory for type 3 GRNs. This suggests we might use the selection of the (c) expression pattern to test the efficacy of the co-evolutionary approach. For this, we add a search for a four-domain pattern of gene (c) to the original scheme. I.e., the tests in this section add to the search criteria of the previous section (fitting Fig. 3c) by also evaluating each individual for ability to fit the (c) expression profile to the profile in the Fig. 6A. If an individual fits both criteria well, the search is considered successful and is terminated. Efficacy of the (c) gene pattern search is measured by the total number individuals evaluated in order to find the desired (c) profile. As controls, we used the versions of the program in which the transposition and transposon operators were switched off. Note that we do not perform a selection of the 4-domain (c) profiles, we simply search for it among the diversity of GRNs produced by TE-GRN coevolution.
10
A
1
2
3
4
B
C Figure 6. A) Four-domain profile used for evolutionary search. B) 4-domain expression profile of the Drosophila gene Blimp-1 as an inspirational example (BDTNP data; http://bdtnp.lbl.gov/Fly-Net/bioimaging.jsp), 3D visualization on a virtual early embryo with the four expression domains numbered (PointCloudXplore; [69]); C) corresponding expression profile along the AP axis.
What we have found in this series of co-evolutionary experiments is that the less the TE selective pressure on GRNs, the lower the chances of finding the desired 4-domain (c) pattern. Table 2 shows the statistics for these runs, and how the chances for finding the (c) pattern depend on the two key TE operators, invasion rate and transposition rate. For this set of experiments, invasion rate is the most important parameter affecting the chances of finding the desired (c) pattern. We conclude from these tests is that co-evolution biases GRNs to form more complicated patterns. But note that evolutionary selection in these cases depends on the two-domain profile of gene (a); the four-domain (c) pattern is searched for in the resulting solutions, but appears to be a by-product of the gene (a) co-evolution. Table 2. Co-evolution of TE and GRN, conditions affecting the appearance of four domains for gene (c).
Key parameter values for co-evolution High invasion and high transposition rates High invasion and low transposition rates Low invasion and high transposition rates Low invasion and low transposition rates No invasion or transposition
Evaluated, on average 33679.4±7917.1 35811.9±10713.6 47677±17831.1 48538.9±15595.9 153189±56965.1
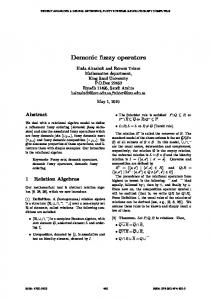
GRN – TE oscillations For typical conditions used in the evolutionary computations in this publication, we typically observe irregular oscillations in GRN – TE dynamics. Fig. 7 shows several examples of such oscillations. Because of the deleterious action of TEs on their hosts, these dynamics are characteristic of host – parasite oscillations, with hosts and parasites (or predator and prey) out of phase with each other. These results are observed at a broad range of parameter values in our GRN-TE co-evolutionary simulations. 11
A
B
C
TE→(a) TE→(b)
D
Generations
Figure 7. Irregular oscillations between hosts (GRN) and their parasites (TE) in GRN-TE co-evolution. A. Type 2 GRNs are out-of-phase with the initial TE attacking the (a) gene. This can be expected, due to GRNs escaping the TE pressure by rewiring gene regulatory connections. B. Type 3 GRN peaks are preceded by peaks of the initial TE attacking the (b) gene. C. Oscillations between type 2 and type 3 GRNs. D. Relation between the TEs attacking gene (a) of the initial GRN and the TEs attacking gene (b) of type 2 GRNs. It can be seen that the TEs attacking gene (b) appear very early in evolution, and that the bursts of these TEs precede the bursts of the TEs attacking gene (a).
Rare bursts of new forms: We have found that low values of the invasion and transposition operators can cause a transition from the oscillatory behavior in Fig. 7 to the bursting activity shown in Fig. 8. At these operator levels, the populations of GRNs and TEs spend most of their evolutionary time stagnant. But after long and irregular periods short, sharp peaks of new forms of GRNs appear and then quickly disappear.
12
TE→(a) TE→(b) Type2 GRNs
Generations Figure 8. Bursts of co-evolutionary events at low levels of TE activity (primarily low invasion rates). Sudden bursts of population sizes in the TEs attacking gene (b) precedes bursts of the TEs attacking gene (a), which coincide with bursts of type 2 GRNs. Bursts end abruptly followed by resumption of the long stagnant phases.
We believe that these GRN - TE co-evolutionary oscillations and bursts could be used as a new tool in forced GRN computational evolution. Specifically, it is a promising mechanism for gentle and indirect forced GRN evolution. The observed oscillations could be useful in overcoming the very general problem of premature convergence in evolutionary searches for GRNs with desired features.
4 Conclusions 1) Targeted destruction of key regulatory connections in a GRN by transposons can produce negative selection pressure on the GRN. 2) Initially non-functional genes can be co-opted into the GRN to respond to this selective pressure. Co-opted genes substitute the regulatory connections under transposon attack (i.e., they rewire the GRN). 3) We have focused on the co-option of genes to restore disrupted connections to external morphogen signaling. This is relevant to the maintenance of gradient-reading GRNs (critical in biological development) in the face of transposon attacks. 4) For gradient-reading GRNs, we have observed outgrowth and complexification of the networks under the selection pressure of targeted transposon activity. 5) GRN – TE co-evolution is capable of facilitating the search for desired expression patterns for genes co-opted into the GRNs as by-products, not by selective pressure. We suggest this happens because co-evolution restricts GRN evolution and canalizes it, thus accumulating in the co-evolved populations some GRN types without explicit selection pressure. 6) Oscillatory dynamics in GRN-TE co-evolution may offer a new method for avoiding premature convergence in evolutionary searches and optimization problems.
References 1 Altenberg, L. (1994). The evolution of evolvability in genetic programming. pp 47-74 in K. E. Kinnear, ed. Advances in Genetic Programming. MIT Press, Cambridge. 2 Lee, C.-Y. and Antonsson, E. K. (2001). Adaptive Evolvability via Non-Coding Segment Induced Linkage, In Lee Spector and Erik D. Goodman and Annie Wu and W.B. Langdon and Hans-Michael Voigt and Mitsuo Gen and Sandip Sen and Marco Dorigo and Shahram Pezeshk and Max H. Garzon and Edmund Burke, Proceedings of the Genetic and Evolutionary Computation Conference (GECCO-2001), San Francisco, California, USA, 7-11 July 2001, PP 448-453. 3 Lones, M. A. and Tyrrell, A. M., (2001). Enzyme genetic programming, In Proceedings of the 2001 Congress on Evolutionary Computation, CEC 2001, IEEE Press, PP 1183-1190. 4 Luke, S., Hamahashi, S. and Kitano, H. (1999). “Genetic” programming, GECCO-99: Proceedings of the Genetic and Evolutionary Computation Conference, Banzhaf, W. et al, eds. San Fransisco: Morgan Kaufmann. 5 Spirov A.V. and Holloway D.M., Using evolutionary computations to understand the design and evolution of gene and cell regulatory networks. METHODS (Elsevier), solicited, reviewed, in revision. 6 Spirov, A.V, and Holloway, D.M. (2010). Design of a dynamic model of genes with multiple autonomous regulatory modules by evolutionary computations. Procedia Computer Science 1, 999-1008. 7 Spirov, A.V. and Holloway, D.M. (2012). New approaches to designing genes by evolution in the computer. In Real-World Applications of Genetic Algorithms, ed. O. Roeva, pp. 235-260, InTech Press.
13
8 Spirov, A.V. and Holloway, D.M. (2012). Evolution in silico of genes with multiple regulatory modules, on the example of the Drosophila segmentation gene hunchback. IEEE proceedings of Computational Intelligence in Bioinformatics and Computational Biology 2012 (CIBCB 2012), 244-251. 9 François P, and Siggia E, (2008) “A case study of evolutionary computation of biochemical adaptation”, Physical Biology, 5 : 026009 10 Agrawal, A., Eastman, Q.M. and Schatz, D.G. (1998). Transposition mediated by RAG1 and RAG2 and its implications for the evolution of the immune system. Nature 394:744-751. 11 Brosius, J. (1991). Retroposons - Seeds of evolution. Science 251, 753. 12 Hurst, G. D. D. and Werren, J. H. (2001). The role of selfish genetic elements in eukaryotic evolution, Nature Reviews Genetics 2, 597-606. 13 King, C.C. (1992). Modular transposition and the dynamical structure of eukaryote regulatory evolution. Genetica 86: 127-42. 14 Makalowski, W. (1995). SINEs as a Genomic Scrap Yard. Chap. 5 in The Impact of Short Interspersed Elements (SINEs) on the Host Genome, edited by Richard J. Maraia. Austin: R.G. Landes Company, 1995. 15 Makalowski, W. (2000). Genomic scrap yard: how genomes utilize all that junk, Gene 259: 61-67. 16 Lozovskaya, E.R., Hartl, D.L. and Petrov, D.A. (1995). Genomic regulation of transposable elements in Drosophila. Curr Opin genet Dev 5:768-73. 17 Fadool, J. M., Hartl, D. L. and Dowling, J. E. (1998). Transposition of the mariner element from Drosophila mauritiana in zebrafish. Proc. Natl. Acad. Sci. USA 95, 5182-5186. 18 Shapiro, J.A. (1999). Transposable elements as the key to a 21st century view of evolution, Genetica 107: 171– 179. 19 Shapiro, J.A. (2002). Repetitive DNA, genome system architecture and genome reorganization. Res Microbiol. 153: 447-53. 20 Bucheton A. (1995) The relationship between the flamenco gene and gypsy in Drosophila: how to tame a retrovirus. Trends Genet 11: 349-353. 21 Bronner G; Taubert H; Jackle H (1995) Mesoderm-specific B104 expression in the Drosophila embryo is mediated by intetrnal cis-acting elements of the transposon. Chromosoma 103: 669-75. 22 Vansant G, Reynolds WF. 1995. The consensus sequence of a major Alu subfamily contains a functional retinoic acid response element. Proc Natl Acad Sci U S A. 92(18):8229–8233 23 Cui F, Sirotin MV, Zhurkin VB., 2011 Impact of Alu repeats on the evolution of human p53 binding sites. Biol Direct., 6:2. 24 Polak, Paz and Domany, Eytan. 2006. Alu elements contain many binding sites for transcription factors and may play a role in regulation of developmental processes, BMC Genomics. 7: 133. 25 Potter M.A. and De Jong K.A., 1994 A cooperative co-evolutionary approach to function optimization, In: Third Parallel Problem Solving from Nature, Jerusalem, Israel. 26 Potter M.A. and De Jong K.A., (1995) Evolving neural networks with collaborative species, In: Proc.of the 1995 Summer Computer Simulation Conference, ottawa, Ontario, Canada, 24-26 July 1995. 27 De Jong K.A. and Potter M.A., (1995) Evolving complex structures via cooperative coevolution, In: Forth Annual Conference on Evolutionary Computation, San Diego, CA, 1-3 March 1995. 28 Hillis W.D., 1990. Co-evolving parasites improve simulated evolution as an optimization procedure, Physica D, 42:228-234. 29 Carroll, S.B., Grenier, J.K., Weatherbee, S.D., 2001. From DNA to Diversity: Molecular Genetics and the Evolution of Animal Design, Malden, MA: Blackwell Science. 30 True, J.R., Carroll, S.B., 2002. Gene co-option in physiological and morphological evolution. Annu. Rev. Cell Dev. Biol., 18:53–80. 31 Reinitz, J., Sharp, D.H., 1995. Mechanism of formation of eve stripes. Mechanisms of Development, 49:133-158. 32 Jaeger, J., Surkova, S., Blagov, M. et al., 2004. Dynamic control of positional information in the early Drosophila blastoderm. Nature, 430:368-371. 33 Sánchez, L., Thieffry, D., 2001. A logical analysis of the Drosophila gapgene system. J. Theor. Biol., 211:115141. 34 Manu, Surkova, S., Spirov, A.V. et al., 2009. Canalization of Gene Expression in the Drosophila Blastoderm by Gap Gene Cross Regulation. PLoS Biol., 73: e1000049. 35 Manu, Surkova, S., Spirov, A.V. et al., 2009. Canalization of Gene Expressionand Domain Shifts in the Drosophila Blastoderm by Dynamical Attractors. PLoS Computational Biology, 53.e1000303 36 Umulis, D.M., O'Connor, M.B., Othmer, H.G., 2008. Robustness of embryonic spatial patterning in Drosophila melanogaster. Current Topics in Developmental Biology, 81:65-111. 37 Bieler, J., Pozzorini, C., Naef, F., 2011. Whole-embryo modeling of early segmentation in Drosophila identifies robust and fragile expression domains. Biophysical J., 101:287-296. 38 Gursky, V.V., Panok, L., Myasnikova, E.M. et al., 2011. Mechanisms of gap gene expression canalization in the Drosophila blastoderm. BMC Syst. Biol., 5:118. 14
39 Azevedo, R.B.R., Lohaus, R., Srinivasan, S., Dang, K.K., Burch, C.L. (2006). Sexual reproduction selects for robustness and negative epistasis in artificial gene networks. Nature 440(7080): 87-90. 40 François, P., Hakim, V., Siggia, E.D., 2007. Deriving structure from evolution: metazoan segmentation. Mol. Syst. Biol., 3:12. 41 Spirov A.V., Bowler T. and Reinitz J., (2000), HOX Pro: a specialized data base for clusters and networks of homeobox genes, Nucleic Acids Res. 28: 337-340. 42 Spirov A.V., Borovsky M. and Spirova O.A., (2002), HOX Pro DB: the functional genomics of hox ensembles, Nucleic Acids Res. 30: 351-353. 43 Miki Fujioka, Xian Wu and James B. Jaynes, 2009 A chromatin insulator mediates transgene homing and very long-range enhancer-promoter communication, Development 136 (18) 3077-3087. 44 C Bartolome, X Maside, B Charlesworth, (2002) On the abundance and distribution of transposable elements in the genome of Drosophila melanogaster - Molecular biology and evolution, 19:926-937 45 Patel, N.H., 1994. Developmental evolution: insights from studies of insect segmentation. Science, 266:581-590 46 Sommer, R.J., Tautz, D., 1993. Involvement of an orthologue of the Drosophila pair-rule gene hairy in segment formation of the short germ-band embryo of Tribolium Coleoptera. Nature, 361:448-450. 47 Lozovskaya, E.R., Hartl, D.L. and Petrov, D.A. (1995). Genomic regulation of transposable elements in Drosophila. Curr Opin genet Dev 5:768-73. 48 McClintock, B. (1984). The significance of responses of the genome to challenge. Science 226: 792-801. 49 Charlesworth B (1991) Transposable elements in natural populations with a mixture of selected and neutral insertion sites. Genet Res Camb 57:127–134. 50 Holloway DM, Kazansky AB, and Spirov AV., (2012), Complexification of Gene Networks by Co-evolution of Genomes and Genomic Parasites, 4th International Conference on Evolutionary Computation Theory and Applications (ECTA 2012), Barcelona, Spain, 5-7 Oct. 2012. 51 Spirov, A., Sabirov, M, and Holloway, D.M. (2012). In silico evolution of gene co-option in pattern-forming gene networks. The Scientific World Journal, special issue on Computational Systems Biology, Article ID 560101, doi: 10.1100/2012/560101. 52 Spirov, A.V., 1996. Self-assemblage of gene networks in evolution via recruiting of new netters. In PPSN 1996, Lecture Notes in Computer Science, 1141, pp 91-100. 53 Spirov, A.V., Samsonova, M.G., 1997. Strategy of Co-evolution of Transposons and Host Genome: Application to Evolutionary Computations. In Proc. of the Third Nordic Workshop on Genetic Algorithms and their Applications, Helsinki University, pp 71-82. 54 Spirov, A.V., Kadyrov, A.S., 1998. Transposon element technique applied to GA-based John Muir’s trail test. In High-Performance Computing and Networking, pp 925-928. 55 Spirov, A.V., Kazansky, A.B., 2002. Jumping genes-mutators can raise efficacy of evolutionary search. In Proc. Genetic and Evolutionary Computation Conference, GECCO2002, Morgan Kaufmann Publishers, San Francisco, pp 561-568. 56 Spirov, A.V., Kazansky, A.B., 2002. The usage of artificial transposons for the protection of already found building blocks: the tests with royal road functions. In Proc. The 6th World Multiconference on Systemics, Cybernetics and Informatics, SCI2002, Orlando, Florida, Int. Inst. Informatics and Systemics, pp 75-80. 57 Spirov, A.V., Kazansky, A.B., Zamdborg, L., et al., 2009. Forced Evolution in Silico by Artificial Transposons and their Genetic Operators: The John Muir Ant Problem. arXiv:0910.5542v1. 58 Nawaz Ripon, K.S., Kwong, S., Man, K.F., 2007. A real-coding jumping gene genetic algorithm RJGGA for multiobjective optimization. Information Sciences, 177:632–654. 59 Tang, W.K.S., Kwong, S.T.W., Man, K.F., 2008. A Jumping Genes Paradigm: Theory, Verification and Applications. IEEE Circuits and Systems Magazine, 8:18-36. 60 Chan, T.M., Man, K.F., Kwong, S., Tang, K.S., 2008. A Jumping Gene paradigm for Evolutionary Multiobjective Optimization. IEEE Tran. on Evolutionary Computation, 12:143-159. 61 Simões, A., Costa, E., 1999. Transposition: A Biologically Inspired Mechanism to Use with Genetic Algorithms. In the Proceedings of the Fourth International Conference on Neural Networks and Genetic Algorithms ICANNGA'99, Springer-Verlag, pp 612-619. 62 Simões, A., Costa, E., 1999. Transposition versus Crossover: An Empirical Study. In Proceedings of the Genetic and Evolutionary Computation Conference GECCO'99, Orlando, Florida USA, CA: Morgan Kaufmann, pp 612-619. 63 Simões, A., Costa, E., 2000. Using Genetic Algorithms with Asexual Transposition. In Proc. of the Genetic and Evolutionary Computation Conference GECCO'00, Las Vegas, USA, CA: Morgan Kaufmann, pp. 323-330. 64 Simões, A., Costa, E., 2001. An Evolutionary Approach to the Zero/One Knapsack Problem: Testing Ideas from Biology. In International Conference on Neural Networks and Genetic Algorithms ICANNGA'01, Prague, Czech Republic, Springer, pp. 236-239. 65 Liu, R., Sheng, Z., Jiao, L., 2009. Gene transposon based clonal selection algorithm for clustering. In Proc. Genetic and Evolutionary Computation Conference, GECCO 2009, pp 1251-1258.
15
66 Charlesworth B, Lapid A, Canada D, (1992) The distribution of transposable elements within and between chromosomed in a population of Drosophila melanogaster. I. Element frequencies distribution. Genet Res, 60: 103114. 67 Edgar BA, Odell GM, Schubiger GA, (1989) Genetic switch, based on negative regulation, sharpens stripes in Drosophila embryos. Dev Genet 10: 124-142. 68 Press, W.H., Flannery, B.P., Teukolsky, S.A., and Vetterling, W.T., (1988). Numerical Recipes, Cambridge University Press, Cambridge. 69 Rübel O, Weber GH, Keränen SVE, Fowlkes CC, Luengo Hendriks CL, et al. (2006) PointCloudXplore: visual analysis of 3D gene expression data using physical views and parallel coordinates. In: Santos BC, Ertl T, Joy K, editors. Eurographics/ IEEE-VGTC symposium on visualization.
16