RESEARCH ARTICLE
C/VDdb: A multi-omics expression profiling database for a knowledge-driven approach in cardiovascular disease (CVD) Marco Fernandes1, Alisha Patel1, Holger Husi ID1,2* 1 Institute of Cardiovascular and Medical Sciences, BHF Glasgow Cardiovascular Research Centre, University of Glasgow, Glasgow, United Kingdom, 2 Division of Biomedical Sciences, Centre for Health Science, University of the Highlands and Islands, Inverness, United Kingdom
a1111111111 a1111111111 a1111111111 a1111111111 a1111111111
OPEN ACCESS Citation: Fernandes M, Patel A, Husi H (2018) C/ VDdb: A multi-omics expression profiling database for a knowledge-driven approach in cardiovascular disease (CVD). PLoS ONE 13(11): e0207371. https://doi.org/10.1371/journal.pone.0207371 Editor: Aldrin V. Gomes, University of California, Davis, UNITED STATES Received: July 6, 2018 Accepted: October 30, 2018 Published: November 12, 2018 Copyright: © 2018 Fernandes et al. This is an open access article distributed under the terms of the Creative Commons Attribution License, which permits unrestricted use, distribution, and reproduction in any medium, provided the original author and source are credited. Data Availability Statement: All data can be accessed via weblinks using the PubMed search facility (https://www.ncbi.nlm.nih.gov/pubmed) for literature-based data and the GEO data repository (https://www.ncbi.nlm.nih.gov/gds/) for GEObased dataset retrieval. Extraction of data from the literature involved manual data extraction from tables found within the publications. All links to appropriate literature sources (individual papers) are fully linked in our C/VD database noted in our Supporting Information file. The authors did not have any special access privileges.
*
[email protected]
Abstract The cardiovascular disease (C/VD) database is an integrated and clustered information resource that covers multi-omic studies (microRNA, genomics, proteomics and metabolomics) of cardiovascular-related traits with special emphasis on coronary artery disease (CAD). This resource was built by mining existing literature and public databases and thereafter manual biocuration was performed. To enable integration of omic data from distinct platforms and species, a specific ontology was applied to tie together and harmonise multilevel omic studies based on gene and protein clusters (CluSO) and mapping of orthologous genes (OMAP) across species. CAD continues to be a leading cause of death in the population worldwide, and it is generally thought to be an age-related disease. However, CAD incidence rates are now known to be highly influenced by environmental factors and interactions, in addition to genetic determinants. With the complexity of CAD aetiology, there is a difficulty in research studies to elucidate general elements compared to other cardiovascular diseases. Data from 92 studies, covering 13945 molecular entries (4353 unique molecules) is described, including data descriptors for experimental setup, study design, discovery-validation sample size and associated fold-changes of the differentially expressed molecular features (p-value17; PRO, (Log2FC)>1.5 & Log10pvalue>5 and MET, (Log2FC)>1.8 & Log10pvalue>5, and the green filled data points the ones than did not observe that condition. mRNA: Metastasis associated lung adenocarcinoma transcript 1 protein (MALAT1), RAS association domaincontaining protein 3 (RASSF3), Protein kinase C, beta type 1 (PRKCB1), Ankyrin repeat containing protein 46 (ANKRD46), TSC22-related inducible leucine zipper 4 (TSC22D2), Folate receptor alpha precursor (FOLR1), Kinectin (KTN1), Methylmalonate-semialdehyde dehydrogenase [acylating] (MMSADHA), Transcription factor 4 (TCF4), Acidic (leucine-rich) nuclear phosphoprotein 32 family member E (ANP32E). PRO: XIN actin-binding repeatcontaining protein 1 (XIRP1), Glycogenin-1 (GYG1), Synaptopodin 2-like protein (SYNPO2L), Signal peptidase complex subunit 3 (SPCS3), Spectrin repeat containing protein (CCDC197), Septin-7 (SEPT7) and Nucleosomeremodelling factor subunit BPTF (BPTF). https://doi.org/10.1371/journal.pone.0207371.g003
PLOS ONE | https://doi.org/10.1371/journal.pone.0207371 November 12, 2018
9 / 28
Cardiovascular disease profiling database construction and coronary artery disease analysis
PLOS ONE | https://doi.org/10.1371/journal.pone.0207371 November 12, 2018
10 / 28
Cardiovascular disease profiling database construction and coronary artery disease analysis
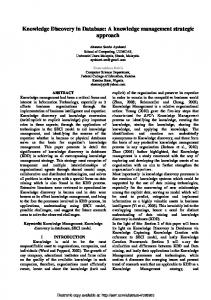
Fig 4. Principal components analysis (PCA) of the content of the C/VD database. Data input was a matrix with differential expression of each molecular entity per Omics type as variables and study ID (“Exp”) as samples. IC10 (2016) disease classification was used as categorical labels. The PCA (a) displays both the PCA scores, X-axis: PC1 (75.5%), Y-axis: PC2 (18.4%) with the confidence ellipse of 95% surrounding CVD conditions and the PCA loadings with the molecular variables hsa-miR-208b (BZJ12), hsa-miR-208a (BZJ35), hsa-miR-206 (BZ290), hsa-miR-125b-1-3p (BZQ81) and hsa-miR-376a-2-5p (BZ615) represented. Visualisation of the level of similarity between CVD conditions of the highly superimposed cluster (a) was achieved by implementing a nonmetric multi-dimensional scaling (MDS) approach in the 2D (b1) and 3D (b2) space. The MDS plot exhibits pairwise dissimilarities as a measure of the Euclidean distances among data points. Tissue/ fluid sources (blood, heart) are represented as a factor of the MDS analysis. https://doi.org/10.1371/journal.pone.0207371.g004
database based on a matrix handling differential expression of each molecular entity per Omics type as variables and study ID (“Exp”) as samples. The PCA plot shows the score of each disease case and the loadings of each variable i.e. the molecular elements on the first two principal components. The greater spatial distance among most of the disease cases that overlap in the plot and heart failure (HF) suggests that the latter can be an outlier due mostly to contribution of microRNA expression, with hsa-miR-208b (BZJ12), hsa-miR-208a (BZJ35), hsa-miR-125b-1-3p (BZQ81) and hsa-miR-376a-2-5p (BZ615) as main molecular culprits. The visualisation of the level of resemblance among many CVD disease cases of the highly overlapped cluster (Fig 4A) by a non-metric multi-dimensional scaling (MDS) method (Fig 4B1 and 4B2) made possible to pairwise compare spatial distances at 2D (Fig 4B1) and 3D (Fig 4B2) among the origin of tissue/ fluid sources, e.g. blood and heart tissue.
Case study with a C/VD subset: CAD Data sets description. We selected a subset of 21 studies from the C/VD database regarding CAD across miRNA (two studies), protein (nine studies) and metabolite (10 studies) expression detected in blood of human cohorts (Table 1). Additional description of other clinical parameters such as age, gender, and clinical history of cases and controls is available in S1 File. The frequency (%) distribution of the regulation (down, up and not regulated) across three fold-change (FC) thresholds (|FC|>1.3, 1.5 and 2.0) of the most reported (at least two times) in CAD of microRNA (MIR), protein (PRO) and metabolite (MET) is shown in Table 2. In any case of contradictory regulation, prevalence was given to any observing frequency �60%. The expression matrix handling differential expression raw values is available in S1 File. The 76 most reported molecules in CAD which includes 18 microRNAs, 16 proteins and 42 metabolites (Table 2) were analysed either by gene ontology (GO), for their biological process (BP), molecular function (MF) and cellular component (CC) and/or Kyoto encyclopedia of genes and genomes (KEGG-compounds) (Fig 5). GO cluster analysis using ClueGO (Fig 5A) showed that the most reported proteins in CAD are primarily involved in the biological regulation of cholesterol transport (negative regulation (APOC1 and APOC2)) and absorption (intestinal absorption (APOA1 and APO4)), modification of the chylomicron composition (APOB, APOC2, APOA1 and APOA4), regulation of metabolic processes regarding fatty acid biosynthesis (APOC1, positive regulation (ADIPOQ, APOA1, APOA4 and APOC2)) and cellular detoxification of superoxide radicals via peroxidase activity (APOA4, MPO, GPX3 and PRDX2). These molecules consist mostly of plasma lipoprotein particles (very-low-density (APOL1, APOC1, APOA4, APOA1, APOC2 and APOB), low-density (APOA1, APOC2 and APOB) and intermediate-density (APOB, APOC2 and APOA1)). The nine characterized proteins clustered in the network follow a trend of decreased expression so we can expect the same trend for their associated functions and biological processes described above. Additionally, ClueGO analysis of proteins reported once (S6A Fig), and their connectivity based on STRING protein-protein interactions (S6B Fig), uncovered the PPAR signalling pathway (containing ADIPOQ, FABP1 and APOA1),
PLOS ONE | https://doi.org/10.1371/journal.pone.0207371 November 12, 2018
11 / 28
Cardiovascular disease profiling database construction and coronary artery disease analysis
Table 1. Dataspace description of CAD studies, from experimental design to clinical information. Human studies and detected in blood. ICD-10[2016] (Atherosclerotic heart disease|I25.1), ICD-10_Parent[2016](Chronic ischaemic heart disease|I25), MeSH_name (Coronary Artery Disease), MeSH_parent (Coronary Disease); Illumina Human v2 MicroRNA expression beadchip (IlluHSAv2MirRNA]; Searchlight Protein Array System (Searchlight ProtArray); Agilent-028004 SurePrint G3 Human GE 8x60K Microarray (AG-G3 HSAGE8x60K); TaqMan Open Array Human MicroRNA panel (TaqMan OpenHSA), studies statistical score threshold: p-, q-value, FDR 3 months
angiographically normal
20 CHD 4 CAD discovery phase 40 CAD verification phase
UPLC-MS/MS and GC-MS
LC-QTOF/MS UHPLC-QTOF/MS
healthy
6 CAD 354
LC-QTOF-MS
non-significant CAD
miRNA-array [IlluHSAv2MirRNA] miRNA-array [TaqMan OpenHSA]
insignificant CAD healthy
Searchlight ProtArray nanoLC-MS/MS MALDI-TOF/TOF ELISA
506 CAD validation phase
https://doi.org/10.1371/journal.pone.0207371.t001
extracellular matrix (ECM)-receptor interaction (ITGB3, SPP1, CD44 and VTN) activation of the complement and proteolytic coagulation cascades (FGA, FGG, KNG1 and SERPIND1) clusters and highlighted the importance of the statins pathway with the cluster (APOC2, LCAT, APOB, APOA4, APOC, APOA1, ADIPOQ and FABP1). Similarly, compound analysis using the Kyoto encyclopedia of genes and genomes (KEGGcompounds) in ClueGO (Fig 5B) yielded the processes of biosynthesis of unsaturated fatty acids (hexadecanoic acid, (8Z,11Z,14Z)-icosatrienoic acid, alpha-linolenic acid, docosahexaenoic acid and icosanoic acid), steroid hormone biosynthesis (pregnenolone sulfate, cortisol and DHEA sulfate) and central carbon metabolism (L-tyrosine, L-histidine, L-valine, L-arginine and glycine) with child elements as biosynthesis of amino acids, ABC transporters, aminoacyl-tRNA biosynthesis and involved in protein digestion and absorption. Most of the metabolites, nine out of thirteen were found decreased in expression (exception for L-valine, L-arginine, cortisol and DHEA sulfate) so one can expect the same trend for their associated biological and metabolic processes. Following the rationale that microRNAs exert post-transcriptional regulation upon mRNA/gene targets, thereby inversely regulated miR-target pairs can contribute to either an increased or decreased expression of the target. Therefore, based on the network cluster (Fig 5C) that connects microRNAs-targets via miRanda target prediction (using the CluePedia 1.5.0 app) to biological processes and molecular functions and observing the regulation trend of microRNAs in Table 2, we can verify that 10 out of 13 microRNAs displayed in the network are decreased in expression (exception for miR-579, let-7c and miR-943), thus one can expect
PLOS ONE | https://doi.org/10.1371/journal.pone.0207371 November 12, 2018
12 / 28
Cardiovascular disease profiling database construction and coronary artery disease analysis
Table 2. Most reported molecular entities in CAD. Overall reported p-value 1.3 Name
DOWN
UP
Reported
|FC|>1.5 NR
DOWN
UP
Tag
|FC|>2.0 NR
DOWN
UP
NR
hsa-mir-144
50
0
50
0
0
100
0
0
100
2
hsa-miR-505-3p
50
0
50
0
0
100
0
0
100
2
hsa-let-7c
0
50
50
0
50
50
0
50
50
2
hsa-mir-1303
0
50
50
0
50
50
0
50
50
2
hsa-mir-1305
0
50
50
0
50
50
0
50
50
2
hsa-mir-943
0
50
50
0
50
50
0
50
50
2
MIR
hsa-miR-579-3p
0
50
50
0
50
50
0
50
50
2
hsa-miR-10a-5p
50
50
0
50
0
50
50
0
50
2
hsa-mir-362
50
0
50
50
0
50
50
0
50
2
hsa-mir-20a
50
0
50
50
0
50
50
0
50
2
hsa-mir-576
50
50
0
50
0
50
50
0
50
2
hsa-miR-106b-5p
100
0
0
50
0
50
50
0
50
2
hsa-miR-517a-3p
100
0
0
50
0
50
50
0
50
2
hsa-mir-636
50
0
50
50
0
50
50
0
50
2
hsa-mir-661
50
0
50
50
0
50
50
0
50
2
hsa-mir-132
50
50
0
50
0
50
50
0
50
2
hsa-miR-21-5p
50
0
50
50
0
50
50
0
50
2
hsa-miR-1255b-5p
50
0
50
50
0
50
50
0
50
2
APOB
28.6
0
71
14.3
0
86
0
0
100
7 TP
APOA4, ApoA-IV, APOA-IV
66.7
0
33
16.7
0
83
16.7
0
83
6 TP
0
80
20
0
80
20
0
60
40
5 CS
APCS, PTX2
TMSB4X, TB4X, THYB4
80
0
20
60
0
40
40
0
60
5 DIS
ADIPOQ, ACDC, ACRP30
60
0
40
0
0
100
0
0
100
5 CS
APOA1
80
0
20
60
0
40
0
0
100
5 TP
PRDX2, NKEFB, TDPX1 APOC2, APC2 VTN
0
0
100
0
0
100
0
0
100
4 ENZ
33.3
33
33
33.3
33
33
0
0
100
3 TP 3 CS
0
67
33
0
0
100
0
0
100
GPX3, GPXP
33.3
0
67
33.3
0
67
33.3
0
67
APOC1, APOC1B
33.3
0
67
33.3
0
67
33.3
0
67
3 TP
0
100
0
0
100
0
0
50
50
2 CS
ACTG1, ACTG
3 ENZ
ALB, GIG20, GIG42
0
0
100
0
0
100
0
0
100
2 TP
AMBP, ITIL, HCP
0
100
0
0
50
50
0
0
100
2 INH 2 TP
APOL1, APOL
50
0
50
50
0
50
0
0
100
MPO
50
50
0
50
0
50
50
0
50
PRO
2 ENZ (Continued )
PLOS ONE | https://doi.org/10.1371/journal.pone.0207371 November 12, 2018
13 / 28
Cardiovascular disease profiling database construction and coronary artery disease analysis
Table 2. (Continued) Frequency (%) regulation |FC|>1.3 Name
DOWN
UP
Reported
|FC|>1.5 NR
DOWN
UP
Tag
|FC|>2.0 NR
DOWN
UP
NR
LysoPC(18:2(9Z,12Z))
75
25
0
0
25
75
0
25
75
4
LysoPC(22:6(4Z,7Z,10Z,13Z,16Z,19Z))
50
25
25
25
25
50
0
25
75
4
LysoPC(18:1(9Z))
75
25
0
25
25
50
0
25
75
4
LysoPE(0:0/18:2(9Z,12Z))
75
25
0
0
25
75
0
25
75
4
LysoPC(18:3(9Z,12Z,15Z))
75
0
25
25
0
75
0
0
100
4
LysoPC(14:0/0:0)
75
0
25
25
0
75
25
0
75
4
LysoPC(18:0)
75
0
25
50
0
50
25
0
75
4
100
0
0
50
0
50
25
0
75
4
LysoPE(16:0/0:0)
50
0
50
0
0
100
0
0
100
4
LysoPC(20:4(5Z,8Z,11Z,14Z))
25
0
75
0
0
100
0
0
100
4
LysoPC(18:4(6Z,9Z,12Z,15Z))
75
25
0
0
25
75
0
25
75
4
66.7
33
0
33.3
33
33
0
33
67
3
LysoPC(16:1(9Z)/0:0)
LysoPC(15:0) Phytosphingosine
66.7
33
0
66.7
0
33
33.3
0
67
3
Palmitic acid
66.7
33
0
33.3
0
67
33.3
0
67
3
LysoPE(0:0/18:0)
33.3
0
67
0
0
100
0
0
100
3
0
33
67
0
0
100
0
0
100
3 2
LysoPE(20:4(5Z,8Z,11Z,14Z)/0:0) L-tyrosine
50
50
0
0
0
100
0
0
100
Dehydroepiandrosterone sulfate (DHEA)
50
50
0
0
50
50
0
0
100
2
L-arginine
50
50
0
0
50
50
0
50
50
2
LysoPE(18:2(9Z,12Z)/0:0)
50
50
0
0
50
50
0
50
50
2
Alpha-linolenic acid (ALA)
50
50
0
50
0
50
50
0
50
2
100
0
0
100
0
0
0
0
100
2
0
100
0
0
50
50
0
50
50
2
100
0
0
100
0
0
50
0
50
2
PC(16:0/0:0)[rac]
0
0
100
0
0
100
0
0
100
2
PE(21:0/0:0)
0
0
100
0
0
100
0
0
100
2
N-Palmitoylethanolamide (PEA) Cer(d18:0/16:0) Pregnenolone sulfate
LysoPC(22:5(7Z,10Z,13Z,16Z,19Z)) L-valine LysoPE(18:1(9Z)/0:0)
50
0
50
0
0
100
0
0
100
2
0
50
50
0
0
100
0
0
100
2 2
100
0
0
0
0
100
0
0
100
0
0
100
0
0
100
0
0
100
2
LysoPE(0:0/20:1(11Z))
50
0
50
0
0
100
0
0
100
2
2-Hydroxybutyric acid
0
50
50
0
0
100
0
0
100
2
L-Acetylcarnitine (ALCAR or ALC)
0
50
50
0
0
100
0
0
100
2
50
0
50
0
0
100
0
0
100
2
LysoPE(18:0/0:0)
Glycine LysoPE(0:0/22:5(4Z,7Z,10Z,13Z,16Z))
50
0
50
0
0
100
0
0
100
2
L-histidine
50
0
50
0
0
100
0
0
100
2
LysoPC(22:5(4Z,7Z,10Z,13Z,16Z))
50
50
0
0
0
100
0
0
100
2
0
50
50
0
50
50
0
50
50
2
Docosahexaenoic acid (DHA)
50
0
50
50
0
50
50
0
50
2
8,11,14-Eicosatrienoic acid (DGLA)
50
0
50
50
0
50
50
0
50
2
Icosanoic acid (eicosanoic acid)
50
50
0
50
0
50
50
0
50
2
1,7-dimethylxanthine (paraxanthine)
50
50
0
50
0
50
50
0
50
2
Cortisol
MET
https://doi.org/10.1371/journal.pone.0207371.t002
that their targets would be increased in expression, so as their associated biological process. Specifically, as seen with miR-661, miR-20a-5p and miR-106b-5p that have a greater number
PLOS ONE | https://doi.org/10.1371/journal.pone.0207371 November 12, 2018
14 / 28
Cardiovascular disease profiling database construction and coronary artery disease analysis
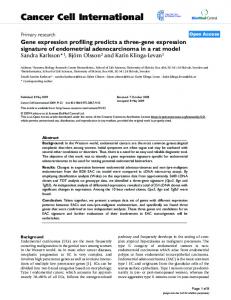
Fig 5. Exploratory analysis of CAD using the most reported molecular entities. A: Gene ontology (GO) analysis of the proteomics data sets. Biological process (BP), molecular function (MF) and cell component (CC). Node size of GO/pathway terms corresponds to the number of matched genes/proteins. B: compound analysis using KEGG pathway maps. C: miRNA analysis of the respective gene target(s) using miRanda predictions. miRNA-targets were then converged onto GO terms. In A: apolipoprotein A-I (APOA1), adiponectin (ADIPOQ), apolipoprotein C-I (APOC1), apolipoprotein B-100 (APOB), apolipoprotein A-IV (APOA4), myeloperoxidase (MPO), peroxiredoxin-2 (PRDX2), glutathione peroxidase 3 (GPX3), apolipoprotein C-II (APOC2), and apolipoprotein L1 (APOL1). In B: hexadecanoic acid (palmitic acid), (8Z,11Z,14Z)-icosatrienoic acid, alpha-linolenic acid (ALA), docosahexaenoic acid (DHA), icosanoic acid (eicosanoic acid), DHEA sulfate (dehydroepiandrosterone sulfate), pregnenolone sulfate (3beta-Hydroxypregn-5-en-20-one sulfate). In C: phosphatidylinositol 4,5-bisphosphate 3-kinase catalytic subunit delta isoform (PIK3CD), acetyl-CoA acetyltransferase, mitochondrial WD repeat domain phosphoinositide-interacting protein 4 (WDR45), sperm acrosome membrane-associated protein 4 (SPACA4), sarcosine dehydrogenase, mitochondrial (SARDH), peroxisomal N(1)-acetyl-spermine/spermidine oxidase (PAOX), fibroblast growth factor receptor 2 (FGFR2), 2-amino-3-ketobutyrate coenzyme A ligase, mitochondrial (GCAT), acetyl-CoA acetyltransferase, mitochondrial (ACAT1), LIM and senescent cell antigen-likecontaining domain protein 1 (LIMS1), lymphocyte antigen 6H (LY6H), phosphatidylinositol 4,5-bisphosphate 3-kinase catalytic subunit delta isoform (PIK3CD), urokinase plasminogen activator surface receptor (PLAUR), coiled-coil domain-containing protein 40 (CCDC40), nectin-1 (NECTIN1), PR domain zinc finger protein 14 (PRDM14), transcription factor SOX-17 (SOX17), cadherin-24 (CDH24), sodium/hydrogen exchanger 1 (SLC9A1), ADP-ribosyl cyclase/cyclic ADP-ribose hydrolase 2 (BST1), and tumor necrosis factor receptor superfamily member 10A (TNFRSF10A). https://doi.org/10.1371/journal.pone.0207371.g005
of targets and follow a down-regulation trend, their targets are involved in protein lipidation, C-acetyltransferase activity, adherens junction organization and cellular biogenic amine catabolic process for the first described microRNA and additionally the PI3-kinase activity and inner cell mass cell differentiation for the two latter described microRNAs (Fig 5C). Additional, search of potential affected KEGG pathways in mirPath v3.0 yield the fatty acid biosynthesis pathway (KEGG map, hsa00061), with up-regulated microRNAs, miR-1303 and miR1305 targeting FASN.
PLOS ONE | https://doi.org/10.1371/journal.pone.0207371 November 12, 2018
15 / 28
Cardiovascular disease profiling database construction and coronary artery disease analysis
Interactome analysis and network enrichment We established a global interactome network (Fig 6) starting with the most reported proteins in CAD, making associations based on protein-protein interactions using STRING app. Afterwards, as a gap-filling approach, the least reported proteins (S1 File) were added, as well as the highest scored gene associations from the DisGeNET database (S1 File). Furthermore, we incorporated metabolic associations providing the linkage of gene-enzyme-reaction-metabolite by merging the former network with a metabolic network built in MetScape (S7 Fig), and described by ClueGO analysis (S8 and S9 Figs). Later, we kept only the most reported and regulated microRNAs (miRNAs), providing their association with gene targets present in the network via CluePedia. The possible occurrence of other regulatory elements in the recently developed network such as transcription factors (TF’s) was ensured by the use of CyTargetLinker and GeneMANIA. This resulted in a densely interconnected network (Fig 6). This network of 136 entries (expanded full network contains 176 molecular entities, S10 Fig), including molecules known to be associated with the query-molecules, consists of a sub-expressed apolipoprotein-cluster (containing APOC1, APOB, APOA4, APOA1, APOC2 and APOL1) and LCAT, a main driver of the extracellular metabolism of lipoproteins, involvement of the complement and coagulation cascades (FGA, FGG, SERPIND1, KNG1 and VTN), suggesting inflammation being activated in the original source tissue, and processes including extracellular matrix receptor interaction (ITGB3, SPP1, CD44 and VTN), biosynthesis of unsaturated fatty acids (hexadecanoic acid, (8Z,11Z,14Z)-icosatrienoic acid, alpha-linolenic acid, docosahexaenoic acid, docosapentaenoic acid, icosanoic acid, arachidate and oleate), steroid hormone biosynthesis (pregnenolone sulfate, cortisol, corticosterone, 11-dehydrocorticosterone and DHEA sulfate), amino acid metabolism (L-arginine, L-histidine, glycine and L-alanine) transport (ALB, APCS), cellular detoxification of oxygen species (PRDX2, MPO and GPX3) and actin cytoskeleton (CFL1, ITGAD, ITGB3, ACTG1, TMSB4X). Inter-linking molecules suggest an involvement of transcriptional elements such as ATF2, PPARG, PPARA and EGFR, which are modulators of genes involved in DNA damage, cell proliferation, anti-apoptosis, glucose and lipid metabolic processes. Additionally, keeping only microRNAs highly expressed and inversely correlated with targets, yielded regulatory clusters driven by miR-1305 (directly targeting APOA1 and PPARA), miR-let-7c (directly targeting OLFM4, and resulting query-molecules S100A9 and MT-COX2/COX2) and miR-1303 (targeting both resulting query-molecules IL6ST and FASN). Analysis of the condensed network of direct interactions between the 136 (or 176 proteins, full network, S10 Fig) proteins shows the apolipoprotein-cluster containing APOC1, APOB, APOA4, APOA1, APOC2 and APOL1, also associated with ALB and LCAT, more than three interactions between IL6, Il10, RETN, CRP, and ADIPOQ and also between FABP1 and the apolipoprotein-cluster hub APOA1. The latter’s suggests that the peroxisome proliferator-activated receptor (PPAR) signalling pathway is perturbed in CAD through an association with APOA1, FABP1 (PPARA), ADIPOQ and RETN (PPARG) (Fig 6). Additional, manual queries in the C/VD database (human, CAD or atherosclerosis, detected in blood, gene expression studies, FC>1.5) looking for regulation trends of network molecules with absent regulation, resulted in decreased levels of PPARG, MT-CO2/COX2, and FASN, confirming the general trend of the PPAR signalling pathway to be inactivated/supressed/blunted. Data mining of the DisGeNET database by associated disease clustering having as input the 16 proteins from Table 2 showed association of MPO, APOA1, APOB and ADIPOQ with myeloperoxidase deficiency, hypertensive disease, hypercholesterolemia, hyperlipidemia and hypoalphalipoproteinemia. In a similar approach to mine pathway entries in the KEGG
PLOS ONE | https://doi.org/10.1371/journal.pone.0207371 November 12, 2018
16 / 28
Cardiovascular disease profiling database construction and coronary artery disease analysis
Fig 6. CAD interactome. Network representation of microRNAs as node triangles, proteins/genes as circles, enzymes displayed as round rectangles, compounds as hexagons, and reactions shaped as diamonds, labels colour coded as irreversible/directed: orange, reversible/bidirected: purple. Enrichment using protein-protein physical interactions is derived from STRING with an established minimum confidence score of 0.70. Gene-enzyme-reaction-compound associations were established using MetScape 3.1.3 and KEGG. MicroRNA-targets associations were derived using miRanda and TarBase. Differential expression is represented as a colour gradation from blue (decreased expression) to red (increased expression). Node size is proportional to the number of molecules reported within data sets. Some compounds and microRNAs of the network were removed (based on fold-change criteria) to reduce the complexity of the figure and thereby enhance visualisation. Full network figure is available in S10 Fig. https://doi.org/10.1371/journal.pone.0207371.g006
database, the common denominator was found as hypertrophic cardiomyopathy (HCM, KEGG entry hsa05410) containing the cluster IL6, ITGB3 and ACTG1 (Table 3), linking it to the ECM-receptor interaction, renin-angiotensin system JASK-STAT signalling pathway and TGFbeta-signalling pathway.
Discussion The C/VD database handles multi-omics and clinical data retrieved from published experimental studies in literature and by mining NCBI Gene Expression Omnibus (GEO) [29] resources across multi-species and tissue/fluid sources in cardiovascular disease. Systems-level integration requires not only large-scale data, but mostly comprehensive data at all molecular levels, thereby owning a resource able to summon all of these elements altogether on a simple, comparative and clustered platform is of prime importance. Moreover, as C/VD is part of the Pan-omics Analysis Database (PADB, www.padb.org) framework, its stability over-time and regular update is ensured, which is a real problem that many databases face after publication.
PLOS ONE | https://doi.org/10.1371/journal.pone.0207371 November 12, 2018
17 / 28
Cardiovascular disease profiling database construction and coronary artery disease analysis
Table 3. Over-representation and pathway topology analysis using KEGG pathways terms. The analysis is based on the molecular elements that constitute the interactome of CAD. Topology analysis is based on degree centrality, which measures the number of links that connects to a node within a pathway. Regulation trend (Trend) is based on differential expression of either � compounds, or �� gene\proteins, or ��� both. Down-regulation (#), up-regulation ("), contradictory regulation or not applicable (NA). General pathway association (class): fatty acids (FA), amino acids (AA), aminoacylation of transfer RNAs (AAcylation), signalling (SIG), energy metabolism (EMET), vitamin 5 as precursor (Vit5), disease (DIS), immune system (IMM), antioxidants (AntiOx), hormonal (HOR), and cytoskeleton (Cytosk). Gene-centric or metabolite-centric analysis (|). Pathway
Total Hits P.Value
Topology Gene\compound
Biosynthesis of unsaturated fatty acids|hsa01040
22
8
1.34E-07
0.38
[Hexadecanoic acid, (9Z)-Octadecenoic acid, Linoleate, (8Z,11Z,14Z)FA Icosatrienoic acid, Icosanoic acid, (9Z,12Z,15Z)-Octadecatrienoic acid, (4Z,7Z,10Z,13Z,16Z,19Z)-Docosahexaenoic acid, (7Z,10Z,13Z,16Z,19Z)Docosa-7,10,13,16,19-pentaenoic acid, Icosadienoic acid]
Class
Trend #�
Cysteine and methionine metabolism|hsa00270
34
6
6.16E-06
0.13
[LDHAL6A, IL4I1, GSS, LDHA, LDHB, LDHC]
AA
NA
Aminoacyl-tRNA biosynthesis| hsa00970
46
8
6.17E-05
0.18
[Glycine, L-Alanine, L-Arginine, L-Phenylalanine, L-Tyrosine, L-Histidine, L-Valine, L-Threonine]
AAcylation #�
Pyruvate metabolism|hsa00620
41
5
2.42E-04
0.35
[LDHAL6A, LDHA, LDHB, LDHC, LDHAL6B]
EMET
NA
PPAR signaling pathway| hsa03320
64
6
2.47E-04
1.13
[SLC27A2, FABP1, APOA1, APOC3, PPARA, ADIPOQ]
SIG
#��
Phenylalanine metabolism| hsa00360
17|11 3|3
1.58E-03| 4.31E-03
1.20|0.70
[DDC, IL4I1, PAH], [L-Phenylalanine, L-Tyrosine, 2-Phenylacetamide]
AA
NA
Phenylalanine, tyrosine and tryptophan biosynthesis| hsa00400
5|4
2|3
1.91E-03| 1.22E-04
2.33|2.67
[IL4I1, PAH], [L-Phenylalanine, L-Tyrosine, 3-(4-Hydroxyphenyl) pyruvate]
AA
NA
Glycolysis / Gluconeogenesis| hsa00010
65
5
2.06E-03
0.06
[LDHAL6A, LDHA, LDHB, LDHC, LDHAL6B]
EMET
NA
Pantothenate and CoA biosynthesis|hsa00770
18
4
2.06E-03
0.41
[beta-Alanine, 3-Methyl-2-oxobutanoic acid, L-Valine, Acyl-carrier protein]
Vit5
NA
Toll-like receptor signaling pathway|hsa04620
97
4
2.26E-03
0.41
[TIRAP, LY96, IL6, MYD88]
SIG
NA
Fatty acid biosynthesis| hsa00061
6|43
2|4
2.83E-03| 4.64E-02
3.42|0.24
[FASN, OLAH], [Palmitoyl-CoA, Acyl-carrier protein, Hexadecanoic acid, (9Z)-Octadecenoic acid]
FA
#�
Fatty acid elongation|hsa00062
23
3
3.88E-03
0.03
[FASN, OLAH, ACOT2, ACOT4]
FA
NA
Hypertrophic cardiomyopathy (HCM)|hsa05410
25
3
4.94E-03
0.88
[IL6, ITGB3, ACTG1]
DIS
"��
Histidine metabolism|hsa00340 26|16 2|3
5.52E-03| 1.31E-02
0.93|0.67
[HDC, CNDP1], [L-Histidine, Carnosine, Histamine]
AA
#�
Complement and coagulation cascades|hsa04610
67
4
1.42E-02
0.11
[FGA, SERPIND1, KNG1, VTN]
IMM
NA
Valine, leucine and isoleucine degradation|hsa00280
44
3
2.35E-02
0.17
[IL4I1, BCAT1, BCAT2]
AA
NA
Valine, leucine and isoleucine biosynthesis|hsa00290
8
2
2.52E-02
0.29
[2-Oxobutanoate, 3-Methyl-2-oxobutanoic acid]
AA
NA
Glutathione metabolism| hsa00480
46|26 3|5
2.64E-02| 1.09E-03
0.77|0.70
[GPX3, ANPEP, GSS], [Glycine, Glutathione, Glutathione disulfide, gamma-L-Glutamyl-L-cysteine, S-Substituted L-cysteine]
AntiOx
#���
beta-Alanine metabolism| hsa00410
21
3
2.77E-02
0.85
[beta-Alanine, L-Histidine, Carnosine]
AA
#�
Steroid hormone biosynthesis| hsa00140
81
7
3.53E-02
0.32099
[DHEA, DHEA sulfate, pregnenolone sulfate, corticosterone, 11-Dehydrocorticosterone, cortisol, pregnenolone]
HOR
NA
Regulation of actin cytoskeleton|hsa04810
182
5
4.20E-02
0.4
[CFL1, ITGAD, ITGB3, ACTG1, TMSB4X]
Cytosk
#��
Arginine and proline metabolism|hsa00330
56|45 3|4
4.37E-02| 1.29E-02
0.54|0.45
[GATM, NOS3, CNDP1], [L-Arginine, Nitric oxide, Guanidinoacetate, N(omega)-Hydroxyarginine]
AA
NA
https://doi.org/10.1371/journal.pone.0207371.t003
Databases covering cardiovascular disease molecular data exist, in the vast majority only covering single-omics derived data, with prevalence for gene-array data sourced from GEO, furthermore many are either offline or their domain redirects to other unrelated webpages.
PLOS ONE | https://doi.org/10.1371/journal.pone.0207371 November 12, 2018
18 / 28
Cardiovascular disease profiling database construction and coronary artery disease analysis
CardioGenBase [61] displays gene-array data sourced from literature and GEO and its currently offline (verified on 05/07/2018), another database comprising literature-based candidate CAD genes, CADgene, [62] and its database live status is currently offline (verified on 05/07/ 2018, redirects to another unrelated web-page), likewise, In-Cardiome [63] deals with ownprivate and literature-based gene expression data, as well with clinical associations and drugs; Chemogenomics [64] is a literature-based database aiming to explore more extensively the pharmacological side in cardiovascular disease handling protein targets and small ligands, and is currently online (verified on 05/07/2018), but requires registration; COPaKB [65] mimics The Human Protein Atlas database [66] with a subset of data regarding cardiovascular disease and also GEO data, and its live status is online (verified on 05/07/2018). The generated interactome in coronary disease (CAD) based on initial meta-analysis and further systems-level integrative analysis of Omics studies covering circulatory levels of protein, metabolite and microRNA differential expression spotted disturbed profiles in lipid metabolism, in particular down-regulation of the unsaturated fatty acids (FA) biosynthesis, down-regulation of cholesterol binding and transport ability shown by the apolipoprotein containing cluster, phosphatidylcholine-sterol acyltransferase (LCAT) and (FABP1), the involvement of the proliferator-activated receptor (PPAR) signalling pathway, with particular emphasis on the generalised trend for down-regulation of the peroxisome proliferator-activated receptor gamma (PPARG), fatty acid synthase (FASN) and their enzyme product, hexadecanoic acid (palmitic acid). This is in synergy with putative post-transcriptional regulation of miR-1305 on PPARA and APOA1, a main apolipoprotein cluster network hub, and dual regulation of miR-1303 and miR-1305 of FASN. On the other hand, indication of up-regulation of molecular elements involved in the extracellular matrix (ECM)-receptor interaction, inflammation being activated in the original source tissue and cardiac hypertrophy. Peroxisome proliferator-activated receptors (PPARs) alpha, beta/delta and gamma are ligand activated transcription factors that share a substantial homology, 60% to 80%, in their ligand and DNA-binding domains [67], despite playing different roles in the modulation of energy metabolism [68]. The three PPARs isoforms are expressed in the heart, including vasculature of endothelial [69, 70] and smooth muscle cells [71, 72], but their roles in the cardiovascular system and outcomes in disease are still not well established due to major inter-study variability [73]. The activation or repression of the expression of PPARs gene targets is modulated by transactivation or transrepression mechanisms [74], in which binding of ligands to PPAR leads to the establishment of heterodimers with the nuclear retinoid receptor (RXR), followed by translocation of PPAR-RXR-heterodimer-complex to the nucleus, with subsequent assembling of co-activator (e.g. PPARGC1A) complexes [75] and binding to specific PPAR response elements (PPREs) in the promotor region of target genes to induce their expression [70, 76]. In contrast, in the absence of ligands, the PPAR-RXR-heterodimer-complex recruits co-repressors (e.g. NCOR1 and NCOR2) that repress gene expression in a DNA-binding-independent manner. When a ligand is present and binds, PPAR-RXR induces dissociation of the co-repressors complex and subsequent release of the co-repressor elements [70, 76, 77]. PPARs are implicated in a plethora of cardiovascular disorders such as cardiac hypertrophy, atherosclerosis and heart failure, and as well in conditions that pose a risk factor, such as diabetes mellitus, obesity, hypertension and dyslipidemia [78]. Activation of PPARA by binding of fibric acid derivatives (fibrates) results in augmented levels of high-density lipoprotein (HDL) cholesterol, diminished levels of free fatty acids (FFA), triglycerides, apolipoprotein C-III (APOC3) [71], and reduced inflammatory response via inhibition of NF-kappaB and transcription factor AP-1 (AP1/JUN) [79, 80]. In the liver, PPARA is involved in the degradation of fatty acids (FA) through the induction of numerous genes coding to enzymes participating in mitochondrial and peroxisomal fatty acid (FA)
PLOS ONE | https://doi.org/10.1371/journal.pone.0207371 November 12, 2018
19 / 28
Cardiovascular disease profiling database construction and coronary artery disease analysis
oxidation [81]. Furthermore, PPARA regulates gluconeogenesis [82], biotransformation [83] and cholesterol metabolism processes [83]. Natural occurring PPARA ligands comprise prostaglandins, leukotrienes, eicosapentaenoic acid and docosahexaenoic acid [84]. Many synthetic PPARA ligands were developed for the management of dyslipidaemia, covering several fibrate drug agonists as gemfibrozil, clofibrate, fenofibrate and bezafibrate [85]. PPARG activation often leads to processes associated with augmented insulin sensitivity, and perturbance of pancreatic beta-cell function [86], in adipocyte tissue PPARG enables fatty acid (FA) storage by inducing adipocyte differentiation [87], and up-regulates expression of the solute carrier family 2, facilitated glucose transporter member 4 (GLUT4/ SLC2A4) and phosphatidyl-3-kinase (PI3K) [88, 89]. Moreover, PPARG gene targets are associated with adipocyte differentiation, lipid storage and glucose metabolism, including lipoprotein lipase (LPL), platelet glycoprotein 4 (CD36), cytosolic phosphoenolpyruvate carboxykinase (PCK1), aquaporin-7 (AQP7) and adiponectin (ADIPOQ) [90]. Many unsaturated fatty acids bind to PPARG, including linoleic acid (linoleate) and arachidonic acid [89], and several eicosanoids [82]. PPARG is a known regulator of glucose metabolism, thereby its synthetic ligands includes many members of the antidiabetic thiazolidinedione (TZD) drug class, glitazones and telmisartan, an antagonist of the type-1 angiotensin II receptor (AGTR1/AT1) used in the treatment of hypertension [91]. Additionally, monocytes and macrophages can produce PPARG ligands, capable to induce an anti-inflammatory response and potentiate inflammatory pro-resolving actions towards repair and return to homeostasis [92]. Post-transcriptional regulators such as hsa-miR-1303, shown up-regulated profile when human umbilical vein endothelial cells (HUVECs) were exposed to estradiol [93], also a down-regulation signature of this microRNA when human-induced pluripotent stem cellderived cardiomyocytes were exposed to doxorubicin [94]. Furthermore, hsa-miR-1305 levels in circulating monocytes was found to be increased after acute exercise as a stress signal in healthy volunteers [95], and hsa-let-7c associated with cardiac hypertrophy [96], and the mature sequence hsa-let-7c-5p appears to be associated with hyperglycemia in patients with coronary heart disease (CHD) [97]. Most patients with CAD undertake treatment for clinical management of other CAD risk factors, such as control of low-density lipoprotein (LDL) cholesterol levels, triglycerides and blood pressure, and therefore it is likely that the additional treatment can contribute to the global interactome profile highlighted above. Thus, we should empathise the potential role of statins (3-hydroxy-methylglutaryl coenzyme A, HMG-CoA reductase inhibitors), a group of drugs that are widely applied to reduce the level of blood low-density lipoprotein (LDL) cholesterol and triglycerides [98], and also found to increase the expression of PPARGC1A [99], a co-activator of PPARG. Other agonists as fibrates drugs are able to induce a diminished activity of LCAT in plasma [100]. The CAD showcase scenario presented here to demonstrate the utility of the C/VD database has some limitations as it only used data sets screening circulatory molecules in human cohorts, thereby potential disease mechanisms, disclosed in experimental studies using celllines and animal models mimicking CAD and as well processes mediated in specific tissuetypes could not be fully perceived. Moreover, we selected only data sets dealing with the clinical description of CAD, leaving out early events perceived in conditions such as atherosclerosis and late diseases such as myocardial infarction, which for a molecular perspective can pose an incomplete view over all the involved molecular events undergoing this disease, thus leading to a partial description of CAD.
PLOS ONE | https://doi.org/10.1371/journal.pone.0207371 November 12, 2018
20 / 28
Cardiovascular disease profiling database construction and coronary artery disease analysis
Conclusions and future perspectives The C/VD database can assist either on the development of novel hypotheses in a data-driven manner or be a source of literature-based knowledge in the cardiovascular research field. In the CAD showcase, using a combinatorial systems-biology approach based on integration of data from circulatory molecular expression profiles covering microRNAs, protein and metabolite, we provide insights into the biological aspects, including summary descriptions by gene ontology (GO) and pathway terminology, covering mechanistic aspects through recreation of protein-protein interactions (PPI’s), metabolic reactions, and providing regulatory elements exerted by transcriptional factors (TF’s) and microRNAs post-transcriptional regulation. In CAD a global disturbed profile in lipid metabolism, including biosynthesis of fatty acids (FA), with blunted ability for cholesterol binding and transport, as well as the involvement of the proliferator-activated receptor (PPAR) signalling pathway, with PPAR isoform alpha (PPARA) being potentially post-transcriptionally regulated by miR-1305 and resulting sub-expression of PPARA target genes, APOA1 and FABP1. Furthermore, indication of disrupted biological processes with distinct increase in expression of molecular elements involved in activation of inflammation, extracellular matrix (ECM)-receptor interaction, and cardiac hypertrophy could be shown. We foresee regular database updates, populating the C/VD database with more experimental studies since the cardiovascular research field, particularly large-scale untargeted approaches, screening body-accessible fluids are currently in high demand.
Supporting information S1 Fig. Index page of the tissue/source list of the C/VD database. The fields of disease, species, number of studies and number of molecules per each tissue/fluid (blood, heart, aorta, urine) source are described. (TIF) S2 Fig. Index page for the omic studies detected in blood tissue/source. The fields of species, component, number of molecules, disease, and PMID/DOI are described per study. (TIF) S3 Fig. Structure of the C/VD database at the study page-view. First headers enclose the main bibliometric data associated with a research article. The second and third headers are with respect to the description of the sample itself and several steps in their processing till reach molecule identification. The fourth header corresponds to the incoming molecules from the previous step. It lists all the molecules identified in the study with the associated statistical scores, fold-change and regulation. (TIF) S4 Fig. View of the of a specific molecule entry in C/VD database. In the first header is displayed the linkage to external databases. Following it we have represented the associated function and classification and as well our own type of tag for functional classification (derived from PADB). The third header corresponds to the number of occurrences of the molecule across all the studies, disease conditions, species, and tissue/fluid source. (TIF) S5 Fig. Demographics page-view. Clinical data (demographics page view) is also represented in the C/VD database and is linked with the study page and vice-versa. (TIF)
PLOS ONE | https://doi.org/10.1371/journal.pone.0207371 November 12, 2018
21 / 28
Cardiovascular disease profiling database construction and coronary artery disease analysis
S6 Fig. Exploratory analysis of CAD using all reported proteins from the many proteomics data sets. A: Gene ontology (GO) analysis. B: STRING protein-protein interactions with a minimum confidence score of 0.70. The light blue demarked oval in B denotes proteins from the hypertrophic cardiomyopathy (HCM) and ECM-receptor interactions ClueGO derived cluster. WikiPathways (WP), biological process (BP), molecular function (MF) and cell component (CC). (TIF) S7 Fig. Visualisation of gene-enzyme-reaction-compound associations through MetScape. Matched compounds and gene nodes are pink colour filled when derived from the C/VD database and grey when from DisGeNET regarding coronary artery disease (CAD) association. (TIF) S8 Fig. Composite image of a MetScape enriched network (main cluster) followed by pathway association in ClueGO (KEGG compounds and pathway terms). Most significant enriched node terms are displayed darker. Colour filled compounds and proteins/genes are from CAD datasets (exception for NOS3 that is derived from DisGeNET). To improve network visualisation some ontology terms were removed from the figure, such as protein digestion and absorption: blue stars; biosynthesis of amino acids: orange stars; central carbon metabolism in cancer: green stars. (TIF) S9 Fig. Composite figure representing MetScape enriched network (remaining clusters) followed by pathway association in ClueGO (KEGG compounds and GO/pathway terms). Most significant enriched node terms are displayed darker. Colour filled compounds and proteins/genes are from CAD datasets (exception for ACE that is derived from DisGeNET). To improve network visualisation some ontology terms were removed from the figure, such as pyruvate metabolism, glucagon signaling pathway, and glycolysis/gluconeogenesis that have a grey start annotation. (TIF) S10 Fig. Full network representation of coronary artery disease (CAD) interactome. Network representation of microRNAs as node triangles, proteins/genes as circles, enzymes displayed as round rectangles, compounds as hexagons, and reactions shaped as diamonds, labels colour coded as irreversible/directed: orange, reversible/bidirected: purple. Enrichment using protein-protein physical interactions is derived from STRING with an established minimum confidence score of 0.70. Gene-enzyme-reaction-compound associations were established using MetScape 3.1.3 and KEGG. MicroRNA-targets associations were derived using miRanda and TarBase. Differential expression is represented as a colour gradation from blue (decreased expression) to red (increased expression). Node size is proportional to the number of molecules reported within data sets. (TIF) S1 File. Supplementary material. (DOCX)
Author Contributions Conceptualization: Holger Husi. Data curation: Marco Fernandes, Alisha Patel. Formal analysis: Marco Fernandes, Alisha Patel.
PLOS ONE | https://doi.org/10.1371/journal.pone.0207371 November 12, 2018
22 / 28
Cardiovascular disease profiling database construction and coronary artery disease analysis
Funding acquisition: Holger Husi. Investigation: Marco Fernandes, Alisha Patel, Holger Husi. Methodology: Marco Fernandes, Alisha Patel, Holger Husi. Project administration: Holger Husi. Resources: Marco Fernandes, Alisha Patel. Software: Holger Husi. Supervision: Holger Husi. Validation: Marco Fernandes, Alisha Patel. Visualization: Marco Fernandes, Alisha Patel. Writing – original draft: Marco Fernandes, Alisha Patel. Writing – review & editing: Marco Fernandes, Alisha Patel, Holger Husi.
References 1.
Roth GA, Johnson C, Abajobir A, Abd-Allah F, Abera SF, Abyu G, et al. Global, Regional, and National Burden of Cardiovascular Diseases for 10 Causes, 1990 to 2015. Journal of the American College of Cardiology. 2017; 70(1):1–25. Epub 2017/05/22. https://doi.org/10.1016/j.jacc.2017.04.052 PMID: 28527533; PubMed Central PMCID: PMCPmc5491406.
2.
Lusis AJ. Atherosclerosis. Nature. 2000; 407(6801):233–41. Epub 2000/09/23. https://doi.org/10. 1038/35025203 PMID: 11001066; PubMed Central PMCID: PMCPmc2826222.
3.
Libby P, Ridker PM, Maseri A. Inflammation and atherosclerosis. Circulation. 2002; 105(9):1135–43. Epub 2002/03/06. PMID: 11877368.
4.
Libby P, Theroux P. Pathophysiology of coronary artery disease. Circulation. 2005; 111(25):3481–8. Epub 2005/06/29. https://doi.org/10.1161/CIRCULATIONAHA.105.537878 PMID: 15983262.
5.
Khera AV, Kathiresan S. Genetics of coronary artery disease: discovery, biology and clinical translation. Nature reviews Genetics. 2017; 18(6):331–44. Epub 2017/03/14. https://doi.org/10.1038/nrg. 2016.160 PMID: 28286336; PubMed Central PMCID: PMCPmc5935119.
6.
Kuller L, Borhani N, Furberg C, Gardin J, Manolio T, O’Leary D, et al. Prevalence of subclinical atherosclerosis and cardiovascular disease and association with risk factors in the Cardiovascular Health Study. American journal of epidemiology. 1994; 139(12):1164–79. Epub 1994/06/15. PMID: 8209875.
7.
Gistera A, Hansson GK. The immunology of atherosclerosis. Nature reviews Nephrology. 2017; 13 (6):368–80. Epub 2017/04/11. https://doi.org/10.1038/nrneph.2017.51 PMID: 28392564.
8.
Baldassarre D, Veglia F, Hamsten A, Humphries SE, Rauramaa R, de Faire U, et al. Progression of carotid intima-media thickness as predictor of vascular events: results from the IMPROVE study. Arteriosclerosis, thrombosis, and vascular biology. 2013; 33(9):2273–9. Epub 2013/07/05. https://doi.org/ 10.1161/ATVBAHA.113.301844 PMID: 23825364.
9.
Marenberg ME, Risch N, Berkman LF, Floderus B, de Faire U. Genetic susceptibility to death from coronary heart disease in a study of twins. The New England journal of medicine. 1994; 330(15):1041–6. Epub 1994/04/14. https://doi.org/10.1056/NEJM199404143301503 PMID: 8127331.
10.
Zdravkovic S, Wienke A, Pedersen NL, Marenberg ME, Yashin AI, De Faire U. Heritability of death from coronary heart disease: a 36-year follow-up of 20 966 Swedish twins. Journal of internal medicine. 2002; 252(3):247–54. Epub 2002/09/25. PMID: 12270005.
11.
Won HH, Natarajan P, Dobbyn A, Jordan DM, Roussos P, Lage K, et al. Disproportionate Contributions of Select Genomic Compartments and Cell Types to Genetic Risk for Coronary Artery Disease. PLoS genetics. 2015; 11(10):e1005622. Epub 2015/10/29. https://doi.org/10.1371/journal.pgen. 1005622 PMID: 26509271; PubMed Central PMCID: PMCPmc4625039.
12.
Wilkins E, Wilson L, Wickramasinghe K, Bhatnagar P, Leal J, Luengo-Fernandez R, et al. European cardiovascular disease statistics 2017. European Heart Network: Brussels, Belgium. 2017.
13.
Humayun Q, Mirza S. Priority actions for the non-communicable disease crisis. Lancet (London, England). 2011; 378(9791):565; author reply -6. Epub 2011/08/16. https://doi.org/10.1016/s01406736(11)61282-8 PMID: 21840449.
PLOS ONE | https://doi.org/10.1371/journal.pone.0207371 November 12, 2018
23 / 28
Cardiovascular disease profiling database construction and coronary artery disease analysis
14.
Iso H. Lifestyle and cardiovascular disease in Japan. Journal of atherosclerosis and thrombosis. 2011; 18(2):83–8. Epub 2011/02/11. PMID: 21307610.
15.
Benjamin EJ, Blaha MJ, Chiuve SE, Cushman M, Das SR, Deo R, et al. Heart Disease and Stroke Statistics-2017 Update: A Report From the American Heart Association. Circulation. 2017; 135(10):e146– e603. Epub 2017/01/27. https://doi.org/10.1161/CIR.0000000000000485 PMID: 28122885; PubMed Central PMCID: PMCPmc5408160.
16.
Zeller T, Blankenberg S. Blood-based gene expression tests: promises and limitations. Circulation Cardiovascular genetics. 2013; 6(2):139–40. Epub 2013/04/18. https://doi.org/10.1161/ CIRCGENETICS.113.000149 PMID: 23591038.
17.
Rupaimoole R, Slack FJ. MicroRNA therapeutics: towards a new era for the management of cancer and other diseases. Nature reviews Drug discovery. 2017; 16(3):203–22. Epub 2017/02/18. https:// doi.org/10.1038/nrd.2016.246 PMID: 28209991.
18.
Bartel DP. MicroRNAs: genomics, biogenesis, mechanism, and function. Cell. 2004; 116(2):281–97. Epub 2004/01/28. PMID: 14744438.
19.
Vidigal JA, Ventura A. The biological functions of miRNAs: lessons from in vivo studies. Trends in cell biology. 2015; 25(3):137–47. Epub 2014/12/09. https://doi.org/10.1016/j.tcb.2014.11.004 PMID: 25484347; PubMed Central PMCID: PMCPmc4344861.
20.
Yates JR, Ruse CI, Nakorchevsky A. Proteomics by mass spectrometry: approaches, advances, and applications. Annual review of biomedical engineering. 2009; 11:49–79. Epub 2009/04/30. https://doi. org/10.1146/annurev-bioeng-061008-124934 PMID: 19400705.
21.
Pedrotty DM, Morley MP, Cappola TP. Transcriptomic biomarkers of cardiovascular disease. Progress in cardiovascular diseases. 2012; 55(1):64–9. Epub 2012/07/25. https://doi.org/10.1016/j.pcad.2012. 06.003 PMID: 22824111; PubMed Central PMCID: PMCPmc4131429.
22.
Hrdlickova R, Toloue M, Tian B. RNA-Seq methods for transcriptome analysis. Wiley interdisciplinary reviews RNA. 2017; 8(1). Epub 2016/05/21. https://doi.org/10.1002/wrna.1364 PMID: 27198714; PubMed Central PMCID: PMCPmc5717752.
23.
Lam HY, Clark MJ, Chen R, Chen R, Natsoulis G, O’Huallachain M, et al. Performance comparison of whole-genome sequencing platforms. Nature biotechnology. 2011; 30(1):78–82. Epub 2011/12/20. https://doi.org/10.1038/nbt.2065 PMID: 22178993; PubMed Central PMCID: PMCPmc4076012.
24.
Cox J, Mann M. Quantitative, high-resolution proteomics for data-driven systems biology. Annual review of biochemistry. 2011; 80:273–99. Epub 2011/05/10. https://doi.org/10.1146/annurevbiochem-061308-093216 PMID: 21548781.
25.
Larance M, Lamond AI. Multidimensional proteomics for cell biology. Nature reviews Molecular cell biology. 2015; 16(5):269–80. Epub 2015/04/11. https://doi.org/10.1038/nrm3970 PMID: 25857810.
26.
DeBerardinis RJ, Thompson CB. Cellular metabolism and disease: what do metabolic outliers teach us? Cell. 2012; 148(6):1132–44. Epub 2012/03/20. https://doi.org/10.1016/j.cell.2012.02.032 PMID: 22424225; PubMed Central PMCID: PMCPmc3337773.
27.
Lee SJ, Trostel A, Adhya S. Metabolite changes signal genetic regulatory mechanisms for robust cell behavior. mBio. 2014; 5(1):e00972–13. Epub 2014/01/30. https://doi.org/10.1128/mBio.00972-13 PMID: 24473130; PubMed Central PMCID: PMCPmc3903281.
28.
Metallo CM, Vander Heiden MG. Understanding metabolic regulation and its influence on cell physiology. Molecular cell. 2013; 49(3):388–98. Epub 2013/02/12. https://doi.org/10.1016/j.molcel.2013.01. 018 PMID: 23395269; PubMed Central PMCID: PMCPmc3569837.
29.
Edgar R, Domrachev M, Lash AE. Gene Expression Omnibus: NCBI gene expression and hybridization array data repository. Nucleic acids research. 2002; 30(1):207–10. Epub 2001/12/26. PMID: 11752295; PubMed Central PMCID: PMCPmc99122.
30.
Parkinson H, Kapushesky M, Kolesnikov N, Rustici G, Shojatalab M, Abeygunawardena N, et al. ArrayExpress update—from an archive of functional genomics experiments to the atlas of gene expression. Nucleic acids research. 2009; 37(Database issue):D868–72. Epub 2008/11/19. https:// doi.org/10.1093/nar/gkn889 PMID: 19015125; PubMed Central PMCID: PMCPmc2686529.
31.
Fernandes M, Husi H. Establishment of a integrative multi-omics expression database CKDdb in the context of chronic kidney disease (CKD). Scientific reports. 2017; 7:40367. Epub 2017/01/13. https:// doi.org/10.1038/srep40367 PMID: 28079125; PubMed Central PMCID: PMCPmc5227717.
32.
Apweiler R, Bairoch A, Wu CH, Barker WC, Boeckmann B, Ferro S, et al. UniProt: the Universal Protein knowledgebase. Nucleic acids research. 2004; 32(Database issue):D115–9. https://doi.org/10. 1093/nar/gkh131 PMID: 14681372; PubMed Central PMCID: PMCPMC308865.
33.
Degtyarenko K, de Matos P, Ennis M, Hastings J, Zbinden M, McNaught A, et al. ChEBI: a database and ontology for chemical entities of biological interest. Nucleic acids research. 2008; 36(Database
PLOS ONE | https://doi.org/10.1371/journal.pone.0207371 November 12, 2018
24 / 28
Cardiovascular disease profiling database construction and coronary artery disease analysis
issue):D344–50. https://doi.org/10.1093/nar/gkm791 PubMed Central PMCID: PMCPMC2238832. PMID: 17932057 34.
Geer LY, Marchler-Bauer A, Geer RC, Han L, He J, He S, et al. The NCBI BioSystems database. Nucleic acids research. 2010; 38(Database issue):D492–6. https://doi.org/10.1093/nar/gkp858 PMID: 19854944; PubMed Central PMCID: PMCPMC2808896.
35.
Kozomara A, Griffiths-Jones S. miRBase: annotating high confidence microRNAs using deep sequencing data. Nucleic acids research. 2014; 42(Database issue):D68–73. https://doi.org/10.1093/ nar/gkt1181 PMID: 24275495; PubMed Central PMCID: PMCPMC3965103.
36.
Zerbino DR, Achuthan P, Akanni W, Amode MR, Barrell D, Bhai J, et al. Ensembl 2018. Nucleic acids research. 2018; 46(D1):D754–D61. https://doi.org/10.1093/nar/gkx1098 PMID: 29155950; PubMed Central PMCID: PMCPMC5753206.
37.
Hamosh A, Scott AF, Amberger J, Bocchini C, Valle D, McKusick VA. Online Mendelian Inheritance in Man (OMIM), a knowledgebase of human genes and genetic disorders. Nucleic acids research. 2002; 30(1):52–5. PMID: 11752252; PubMed Central PMCID: PMCPMC99152.
38.
Datatables Jardine A. (table plug-in for jquery). Poslednı´ čtenı´. 2012; 20:12.
39.
Chaffer J, Swedberg K. Jquery reference guide: a comprehensive exploration of the popular javascript library: Packt Publishing Ltd; 2010.
40.
Group P. PHP Hypertext Preprocessor (2008). URL http://wwwphpnet. 2007.
41.
Fisher RA. 224A: Answer to Question 14 on Combining independent tests of significance. 1948.
42.
Stouffer S. Such. man EA, DeVinney LC. Star SA, & Williams RM Jr (1949b) The American soldier: Adjustment during army life. 1949; 1.
43.
Rikke BA, Wynes MW, Rozeboom LM, Baron AE, Hirsch FR. Independent validation test of the votecounting strategy used to rank biomarkers from published studies. Biomarkers in medicine. 2015; 9 (8):751–61. Epub 2015/08/01. https://doi.org/10.2217/BMM.15.39 PMID: 26223535; PubMed Central PMCID: PMCPmc4770796.
44.
Clarke K, Gorley R. PRIMER v6: User Manual PRIMER-E. Plymouth, UK. 2006.
45.
Kanehisa M, Furumichi M, Tanabe M, Sato Y, Morishima K. KEGG: new perspectives on genomes, pathways, diseases and drugs. Nucleic acids research. 2017; 45(D1):D353–d61. Epub 2016/12/03. https://doi.org/10.1093/nar/gkw1092 PMID: 27899662; PubMed Central PMCID: PMCPmc5210567.
46.
Kelder T, van Iersel MP, Hanspers K, Kutmon M, Conklin BR, Evelo CT, et al. WikiPathways: building research communities on biological pathways. Nucleic acids research. 2012; 40(Database issue): D1301–7. Epub 2011/11/19. https://doi.org/10.1093/nar/gkr1074 PMID: 22096230; PubMed Central PMCID: PMCPmc3245032.
47.
Bindea G, Mlecnik B, Hackl H, Charoentong P, Tosolini M, Kirilovsky A, et al. ClueGO: a Cytoscape plug-in to decipher functionally grouped gene ontology and pathway annotation networks. Bioinformatics (Oxford, England). 2009; 25(8):1091–3. Epub 2009/02/25. https://doi.org/10.1093/bioinformatics/ btp101 PMID: 19237447; PubMed Central PMCID: PMCPmc2666812.
48.
Shannon P, Markiel A, Ozier O, Baliga NS, Wang JT, Ramage D, et al. Cytoscape: a software environment for integrated models of biomolecular interaction networks. Genome Res. 2003; 13(11):2498– 504. https://doi.org/10.1101/gr.1239303 PMID: 14597658; PubMed Central PMCID: PMCPMC403769.
49.
Betel D, Koppal A, Agius P, Sander C, Leslie C. Comprehensive modeling of microRNA targets predicts functional non-conserved and non-canonical sites. Genome Biol. 2010; 11(8):R90. https://doi. org/10.1186/gb-2010-11-8-r90 PMID: 20799968; PubMed Central PMCID: PMCPMC2945792.
50.
Chou CH, Chang NW, Shrestha S, Hsu SD, Lin YL, Lee WH, et al. miRTarBase 2016: updates to the experimentally validated miRNA-target interactions database. Nucleic acids research. 2016; 44(D1): D239–47. https://doi.org/10.1093/nar/gkv1258 PMID: 26590260; PubMed Central PMCID: PMCPMC4702890.
51.
Bindea G, Galon J, Mlecnik B. CluePedia Cytoscape plugin: pathway insights using integrated experimental and in silico data. Bioinformatics (Oxford, England). 2013; 29(5):661–3. Epub 2013/01/18. https://doi.org/10.1093/bioinformatics/btt019 PMID: 23325622; PubMed Central PMCID: PMCPmc3582273.
52.
Vlachos IS, Zagganas K, Paraskevopoulou MD, Georgakilas G, Karagkouni D, Vergoulis T, et al. DIANA-miRPath v3.0: deciphering microRNA function with experimental support. Nucleic acids research. 2015; 43(W1):W460–6. Epub 2015/05/16. https://doi.org/10.1093/nar/gkv403 PMID: 25977294; PubMed Central PMCID: PMCPmc4489228.
53.
Kutmon M, Kelder T, Mandaviya P, Evelo CT, Coort SL. CyTargetLinker: a cytoscape app to integrate regulatory interactions in network analysis. PloS one. 2013; 8(12):e82160. Epub 2013/12/18. https://
PLOS ONE | https://doi.org/10.1371/journal.pone.0207371 November 12, 2018
25 / 28
Cardiovascular disease profiling database construction and coronary artery disease analysis
doi.org/10.1371/journal.pone.0082160 PMID: 24340000; PubMed Central PMCID: PMCPmc3855388. 54.
Zuberi K, Franz M, Rodriguez H, Montojo J, Lopes CT, Bader GD, et al. GeneMANIA prediction server 2013 update. Nucleic acids research. 2013; 41(Web Server issue):W115–22. Epub 2013/06/26. https://doi.org/10.1093/nar/gkt533 PMID: 23794635; PubMed Central PMCID: PMCPmc3692113.
55.
Szklarczyk D, Morris JH, Cook H, Kuhn M, Wyder S, Simonovic M, et al. The STRING database in 2017: quality-controlled protein-protein association networks, made broadly accessible. Nucleic acids research. 2017; 45(D1):D362–d8. Epub 2016/12/08. https://doi.org/10.1093/nar/gkw937 PMID: 27924014; PubMed Central PMCID: PMCPmc5210637.
56.
Karnovsky A, Weymouth T, Hull T, Tarcea VG, Scardoni G, Laudanna C, et al. Metscape 2 bioinformatics tool for the analysis and visualization of metabolomics and gene expression data. Bioinformatics (Oxford, England). 2012; 28(3):373–80. Epub 2011/12/03. https://doi.org/10.1093/bioinformatics/ btr661 PMID: 22135418; PubMed Central PMCID: PMCPmc3268237.
57.
Placzek S, Schomburg I, Chang A, Jeske L, Ulbrich M, Tillack J, et al. BRENDA in 2017: new perspectives and new tools in BRENDA. Nucleic acids research. 2017; 45(D1):D380–d8. Epub 2016/12/08. https://doi.org/10.1093/nar/gkw952 PMID: 27924025; PubMed Central PMCID: PMCPmc5210646.
58.
Pinero J, Queralt-Rosinach N, Bravo A, Deu-Pons J, Bauer-Mehren A, Baron M, et al. DisGeNET: a discovery platform for the dynamical exploration of human diseases and their genes. Database: the journal of biological databases and curation. 2015; 2015:bav028. Epub 2015/04/17. https://doi.org/10. 1093/database/bav028 PMID: 25877637; PubMed Central PMCID: PMCPmc4397996.
59.
Xia J, Wishart DS. Using MetaboAnalyst 3.0 for Comprehensive Metabolomics Data Analysis. Current protocols in bioinformatics. 2016; 55:14.0.1–.0.91. Epub 2016/09/08. https://doi.org/10.1002/cpbi.11 PMID: 27603023.
60.
Tennekes M, de Jonge E. tabplot: Tableplot, a Visualization of Large Datasets. R package version 1.3–1. 2017.
61.
V A, Nayar PG, Murugesan R, Mary B, P D, Ahmed SS. CardioGenBase: A Literature Based MultiOmics Database for Major Cardiovascular Diseases. PloS one. 2015; 10(12):e0143188. Epub 2015/ 12/02. https://doi.org/10.1371/journal.pone.0143188 PMID: 26624015; PubMed Central PMCID: PMCPmc4666633.
62.
Liu H, Liu W, Liao Y, Cheng L, Liu Q, Ren X, et al. CADgene: a comprehensive database for coronary artery disease genes. Nucleic acids research. 2011; 39(Database issue):D991–6. Epub 2010/11/04. https://doi.org/10.1093/nar/gkq1106 PMID: 21045063; PubMed Central PMCID: PMCPmc3013698.
63.
Sharma A, Deshpande V, Ghatge M, Vangala RK. In-Cardiome: integrated knowledgebase for coronary artery disease enabling translational research. Database: the journal of biological databases and curation. 2017; 2017. Epub 2017/12/09. https://doi.org/10.1093/database/bax077 PMID: 29220465; PubMed Central PMCID: PMCPmc5737197.
64.
Zhang H, Ma S, Feng Z, Wang D, Li C, Cao Y, et al. Cardiovascular Disease Chemogenomics Knowledgebase-guided Target Identification and Drug Synergy Mechanism Study of an Herbal Formula. Scientific reports. 2016; 6:33963. Epub 2016/09/30. https://doi.org/10.1038/srep33963 PMID: 27678063; PubMed Central PMCID: PMCPmc5039409.
65.
Zong NC, Li H, Li H, Lam MP, Jimenez RC, Kim CS, et al. Integration of cardiac proteome biology and medicine by a specialized knowledgebase. Circulation research. 2013; 113(9):1043–53. Epub 2013/ 08/24. https://doi.org/10.1161/CIRCRESAHA.113.301151 PMID: 23965338; PubMed Central PMCID: PMCPmc4076475.
66.
Ponten F, Jirstrom K, Uhlen M. The Human Protein Atlas—a tool for pathology. The Journal of pathology. 2008; 216(4):387–93. Epub 2008/10/15. https://doi.org/10.1002/path.2440 PMID: 18853439.
67.
Marx N, Duez H, Fruchart JC, Staels B. Peroxisome proliferator-activated receptors and atherogenesis: regulators of gene expression in vascular cells. Circulation research. 2004; 94(9):1168–78. Epub 2004/05/15. https://doi.org/10.1161/01.RES.0000127122.22685.0A PMID: 15142970.
68.
Bookout AL, Jeong Y, Downes M, Yu RT, Evans RM, Mangelsdorf DJ. Anatomical profiling of nuclear receptor expression reveals a hierarchical transcriptional network. Cell. 2006; 126(4):789–99. Epub 2006/08/23. https://doi.org/10.1016/j.cell.2006.06.049 PMID: 16923397.
69.
Grau R, Punzon C, Fresno M, Iniguez MA. Peroxisome-proliferator-activated receptor alpha agonists inhibit cyclo-oxygenase 2 and vascular endothelial growth factor transcriptional activation in human colorectal carcinoma cells via inhibition of activator protein-1. The Biochemical journal. 2006; 395 (1):81–8. Epub 2005/12/14. https://doi.org/10.1042/BJ20050964 PMID: 16343055; PubMed Central PMCID: PMCPmc1409694.
70.
Delerive P, Martin-Nizard F, Chinetti G, Trottein F, Fruchart JC, Najib J, et al. Peroxisome proliferatoractivated receptor activators inhibit thrombin-induced endothelin-1 production in human vascular
PLOS ONE | https://doi.org/10.1371/journal.pone.0207371 November 12, 2018
26 / 28
Cardiovascular disease profiling database construction and coronary artery disease analysis
endothelial cells by inhibiting the activator protein-1 signaling pathway. Circulation research. 1999; 85 (5):394–402. Epub 1999/09/04. PMID: 10473669. 71.
Staels B, Dallongeville J, Auwerx J, Schoonjans K, Leitersdorf E, Fruchart JC. Mechanism of action of fibrates on lipid and lipoprotein metabolism. Circulation. 1998; 98(19):2088–93. Epub 1998/11/10. PMID: 9808609.
72.
Marx N, Schonbeck U, Lazar MA, Libby P, Plutzky J. Peroxisome proliferator-activated receptor gamma activators inhibit gene expression and migration in human vascular smooth muscle cells. Circulation research. 1998; 83(11):1097–103. Epub 1998/12/01. PMID: 9831704; PubMed Central PMCID: PMCPmc4231720.
73.
Lee WS, Kim J. Peroxisome Proliferator-Activated Receptors and the Heart: Lessons from the Past and Future Directions. PPAR research. 2015; 2015:271983. Epub 2015/11/21. https://doi.org/10. 1155/2015/271983 PMID: 26587015; PubMed Central PMCID: PMCPmc4637490.
74.
Oyekan A. PPARs and their effects on the cardiovascular system. Clinical and experimental hypertension (New York, NY: 1993). 2011; 33(5):287–93. Epub 2011/07/05. https://doi.org/10.3109/10641963. 2010.531845 PMID: 21721973.
75.
Spiegelman BM. PPAR-gamma: adipogenic regulator and thiazolidinedione receptor. Diabetes. 1998; 47(4):507–14. Epub 1998/05/06. PMID: 9568680.
76.
Ricote M, Li AC, Willson TM, Kelly CJ, Glass CK. The peroxisome proliferator-activated receptorgamma is a negative regulator of macrophage activation. Nature. 1998; 391(6662):79–82. Epub 1998/ 01/09. https://doi.org/10.1038/34178 PMID: 9422508.
77.
Blanquart C, Mansouri R, Paumelle R, Fruchart JC, Staels B, Glineur C. The protein kinase C signaling pathway regulates a molecular switch between transactivation and transrepression activity of the peroxisome proliferator-activated receptor alpha. Molecular endocrinology (Baltimore, Md). 2004; 18 (8):1906–18. Epub 2004/05/08. https://doi.org/10.1210/me.2003-0327 PMID: 15131257.
78.
Chandra M, Miriyala S, Panchatcharam M. PPARγ and its role in cardiovascular diseases. PPAR research. 2017; 2017.
79.
Delerive P, De Bosscher K, Besnard S, Vanden Berghe W, Peters JM, Gonzalez FJ, et al. Peroxisome proliferator-activated receptor alpha negatively regulates the vascular inflammatory gene response by negative cross-talk with transcription factors NF-kappaB and AP-1. The Journal of biological chemistry. 1999; 274(45):32048–54. Epub 1999/11/05. PMID: 10542237.
80.
Delerive P, Gervois P, Fruchart JC, Staels B. Induction of IkappaBalpha expression as a mechanism contributing to the anti-inflammatory activities of peroxisome proliferator-activated receptor-alpha activators. The Journal of biological chemistry. 2000; 275(47):36703–7. Epub 2000/09/12. https://doi.org/ 10.1074/jbc.M004045200 PMID: 10980195.
81.
Mandard S, Muller M, Kersten S. Peroxisome proliferator-activated receptor alpha target genes. Cellular and molecular life sciences: CMLS. 2004; 61(4):393–416. Epub 2004/03/05. https://doi.org/10. 1007/s00018-003-3216-3 PMID: 14999402.
82.
Patsouris D, Mandard S, Voshol PJ, Escher P, Tan NS, Havekes LM, et al. PPARalpha governs glycerol metabolism. The Journal of clinical investigation. 2004; 114(1):94–103. Epub 2004/07/03. https:// doi.org/10.1172/JCI20468 PMID: 15232616; PubMed Central PMCID: PMCPmc437964.
83.
Barbier O, Villeneuve L, Bocher V, Fontaine C, Torra IP, Duhem C, et al. The UDP-glucuronosyltransferase 1A9 enzyme is a peroxisome proliferator-activated receptor alpha and gamma target gene. The Journal of biological chemistry. 2003; 278(16):13975–83. Epub 2003/02/13. https://doi.org/10.1074/ jbc.M300749200 PMID: 12582161.
84.
Forman BM, Chen J, Evans RM. Hypolipidemic drugs, polyunsaturated fatty acids, and eicosanoids are ligands for peroxisome proliferator-activated receptors alpha and delta. Proceedings of the National Academy of Sciences of the United States of America. 1997; 94(9):4312–7. Epub 1997/04/ 29. PMID: 9113986; PubMed Central PMCID: PMCPmc20719.
85.
Remick J, Weintraub H, Setton R, Offenbacher J, Fisher E, Schwartzbard A. Fibrate therapy: an update. Cardiology in review. 2008; 16(3):129–41. Epub 2008/04/17. https://doi.org/10.1097/CRD. 0b013e31816b43d3 PMID: 18414184.
86.
Bell DS. Beta-cell rejuvenation with thiazolidinediones. The American journal of medicine. 2003; 115 Suppl 8A:20s–3s. Epub 2003/12/18. PMID: 14678861.
87.
Chawla A, Schwarz EJ, Dimaculangan DD, Lazar MA. Peroxisome proliferator-activated receptor (PPAR) gamma: adipose-predominant expression and induction early in adipocyte differentiation. Endocrinology. 1994; 135(2):798–800. Epub 1994/08/01. https://doi.org/10.1210/endo.135.2. 8033830 PMID: 8033830.
88.
Yki-Jarvinen H. Thiazolidinediones. The New England journal of medicine. 2004; 351(11):1106–18. Epub 2004/09/10. https://doi.org/10.1056/NEJMra041001 PMID: 15356308.
PLOS ONE | https://doi.org/10.1371/journal.pone.0207371 November 12, 2018
27 / 28
Cardiovascular disease profiling database construction and coronary artery disease analysis
89.
Al-Khalili L, Forsgren M, Kannisto K, Zierath JR, Lonnqvist F, Krook A. Enhanced insulin-stimulated glycogen synthesis in response to insulin, metformin or rosiglitazone is associated with increased mRNA expression of GLUT4 and peroxisomal proliferator activator receptor gamma co-activator 1. Diabetologia. 2005; 48(6):1173–9. Epub 2005/05/03. https://doi.org/10.1007/s00125-005-1741-3 PMID: 15864539.
90.
Lehrke M, Lazar MA. The many faces of PPARgamma. Cell. 2005; 123(6):993–9. Epub 2005/12/20. https://doi.org/10.1016/j.cell.2005.11.026 PMID: 16360030.
91.
Kurtz TW, Pravenec M. Antidiabetic mechanisms of angiotensin-converting enzyme inhibitors and angiotensin II receptor antagonists: beyond the renin-angiotensin system. Journal of hypertension. 2004; 22(12):2253–61. Epub 2004/12/23. PMID: 15614015.
92.
Croasdell A, Duffney PF, Kim N, Lacy SH, Sime PJ, Phipps RP. PPARγ and the innate immune system mediate the resolution of inflammation. PPAR research. 2015; 2015.
93.
Vidal-Gomez X, Perez-Cremades D, Mompeon A, Dantas AP, Novella S, Hermenegildo C. MicroRNA as Crucial Regulators of Gene Expression in Estradiol-Treated Human Endothelial Cells. Cellular physiology and biochemistry: international journal of experimental cellular physiology, biochemistry, and pharmacology. 2018; 45(5):1878–92. Epub 2018/03/07. https://doi.org/10.1159/000487910 PMID: 29510375.
94.
Chaudhari U, Nemade H, Gaspar JA, Hescheler J, Hengstler JG, Sachinidis A. MicroRNAs as early toxicity signatures of doxorubicin in human-induced pluripotent stem cell-derived cardiomyocytes. Archives of toxicology. 2016; 90(12):3087–98. Epub 2016/02/05. https://doi.org/10.1007/s00204-0161668-0 PMID: 26842497; PubMed Central PMCID: PMCPmc5104806.
95.
Radom-Aizik S, Zaldivar FP Jr., Haddad F, Cooper DM. Impact of brief exercise on circulating monocyte gene and microRNA expression: implications for atherosclerotic vascular disease. Brain, behavior, and immunity. 2014; 39:121–9. Epub 2014/01/16. https://doi.org/10.1016/j.bbi.2014.01.003 PMID: 24423463; PubMed Central PMCID: PMCPmc4101903.
96.
Sayed D, Hong C, Chen IY, Lypowy J, Abdellatif M. MicroRNAs play an essential role in the development of cardiac hypertrophy. Circulation research. 2007; 100(3):416–24. Epub 2007/01/20. https://doi. org/10.1161/01.RES.0000257913.42552.23 PMID: 17234972.
97.
Jiang Y, Liu N, Xue B, Hou J, Lin C, Ren J, et al. Circulating MicroRNA Profiles Differ between Hyperglycemia and Euglycemia in Coronary Heart Disease Patients. BioMed research international. 2017; 2017:9192575. Epub 2017/12/08. https://doi.org/10.1155/2017/9192575 PMID: 29214180; PubMed Central PMCID: PMCPmc5682890.
98.
Istvan ES, Deisenhofer J. Structural mechanism for statin inhibition of HMG-CoA reductase. Science (New York, NY). 2001; 292(5519):1160–4. Epub 2001/05/12. https://doi.org/10.1126/science. 1059344 PMID: 11349148.
99.
Bouitbir J, Charles AL, Echaniz-Laguna A, Kindo M, Daussin F, Auwerx J, et al. Opposite effects of statins on mitochondria of cardiac and skeletal muscles: a ’mitohormesis’ mechanism involving reactive oxygen species and PGC-1. European heart journal. 2012; 33(11):1397–407. Epub 2011/07/22. https://doi.org/10.1093/eurheartj/ehr224 PMID: 21775390; PubMed Central PMCID: PMCPmc3365271.
100.
Staels B, van Tol A, Skretting G, Auwerx J. Lecithin:cholesterol acyltransferase gene expression is regulated in a tissue-selective manner by fibrates. Journal of lipid research. 1992; 33(5):727–35. Epub 1992/05/01. PMID: 1619364.
PLOS ONE | https://doi.org/10.1371/journal.pone.0207371 November 12, 2018
28 / 28