Video. Features. Extraction. K-means. Clustering. IVSM. Visual. Dictionary step ..... [5] D.K. Park, Y.S. Jeon and C.S. Won, âEfficient use of local edge histogram.
Video Shots Key-Frames Indexing and Retrieval Through Pattern Analysis and Fusion Techniques Rachid Benmokhtar and Benoit Huet
Sid-Ahmed Berrani and Patrick Lechat
Institut Eur´ecom - D´epartement Multim´edia 2229, route des crˆetes 06904 Sophia-Antipolis - France (Rachid.Benmokhtar, Benoit.Huet)@eurecom.fr
Orange-France Telecom R&D 4, rue du Clos Courtel 35512 Cesson - S´evign´e Cedex (Sidahmed.Berrani, Patrick.Lechat)@orange-ftgroup.com
Abstract— This paper proposes an automatic semantic video content indexing and retrieval system based on fusing various low level visual and shape descriptors. Extracted features from region and sub-image blocks segmentation of video shots key-frames are described via IVSM signature (Image Vector Space Model) in order to have a compact and efficient description of the content. Static feature fusion based on averaging and concatenation are introduced to obtain effective signatures. Support Vector Machines (SVM) and neurals network (NNs) are employed to perform classification. The task of the classifiers is to detect the video semantic content. Then, classifiers outputs are fused using neural network based on evidence theory (NN-ET) in order to provide a decision on the content of each shot. The experimental results are conducted in the framework of soccer video feature extraction task1 .
Keywords: Feature fusion, classification, classifier fusion, neural network, evidence theory, CBIR. I. I NTRODUCTION With the development of the internet, multimedia information such as images and videos, have become the major sources on the internet. An efficient image and video retrieval system is highly desired to narrow down the well know semantic gap between the visual features and the richness of humain semantics. To respond to the increase in audiovisual information, various methods for indexing, classification and fusion have emerged. The need to analyse the content has appeared to facilitate understanding and contribute to a better automatic video content indexing and retrieval. The retrieval of complex semantic concepts requires the analysis of many features per modalities. The task consisting of combining of all these different parameters is far from being trivial. The fusion mechanism can take place at different levels of the classification process. Generally, it is either applied on signatures (feature fusion) or on classifiers outputs (classifier fusion). This paper presents our research conducted toward a semantic video content indexing and retrieval system. It aims at doing tasks such as the high level feature detection task of TrecVid but limited as far as this paper is concerned with the application domain of soccer game analysis. It starts with a description of our automatic system architecture. We 1 The work presented here is funded by Orange-France Telecom R&D under CRE 46134752.
HSVreg
SVM
svm 2 svm 3
SVM
Features Extraction K-means Clustering Region Segmentation
RGBreg
svm 4
NN
nn 2
NN
nn 3
NN
nn 4
IVSM Visual Dictionary
Gaborreg
Video
SVM
Features Fusion step
SVM NN
svm1 nn1
merged feature
HSVblock Features Extraction
RGBblock Block Segmentation
K-means Clustering
Gaborblock IVSM Visual Dictionary
EHDblock
Features Extraction step
Fig. 1.
Neural Network Based on Evidence Theory NN-ET
SVM SVM SVM SVM
svm 5 svm 6
svm 7 svm 8
NN
nn 5 nn 6
NN
nn 7
NN
nn8
NN
Semantic Concept detection
Classifica tion step
Fusion step
General framework of the application.
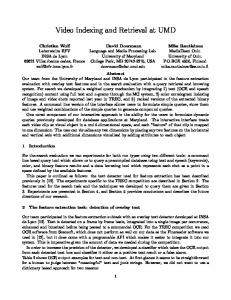
distinguish four steps: features extraction, features fusion, classification and fusion. The overall processing chain of our system is presented in figure 1. The feature extraction step consists in creating a set of low level descriptors (based on color, texture and shape). The static feature fusion step is achieved based on two distinct approaches: Average and concatenation. Both are descripted, implemented and evaluated with the objective of obtaining effective signature for each keyframe. The classification step is used to estimate the video semantic content. Both Support Vector Machine (SVMs) and Neural Networks (NNs) are employed. In the final stage of our system, fusion of classifier outputs is performed thanks to a neural network based on evidence theory (NN-ET). The experimental results presented in this paper are conducted in the application domain of soccer game videos. The aim is to automatically detect game actions and views (Such as center view, left goal, side view, player close-up, etc...) from video analysis. This study reports the efficiency of fusion mechanisms (Before and post classification) and shows the improvement provided by our proposed scheme. Finally, we conclude with a summary of the most important results provided by this study along with some possible extensions of this work.
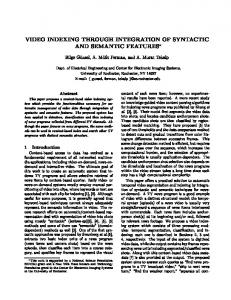
II. S YSTEM A RCHITECTURE This section describes the workflow of the semantic feature extraction process that aims at detecting the presence of semantic classes in soccer game videos, such as:”zoom on player, zoom on public, game stop, goal camera, center view . . . ”. Key-frames of soccer video shots are segmented using two techniques, region and block segmentation. The first technique, segments image into homogeneous regions thanks to the graph-based image segmentation algorithm described in [1]. The algorithm is fast and provides visually acceptable segmentation. An illustration of the segmentation results is provided in figure 2.
Fig. 2. Exemple of segmentation key-frames illustrating three semantic concepts (close-up action, left view, center view).
Second technique divide the image (576x720 pixels) into 6x6 non-overlapping sub-images as shown in figure 3. This allows extracting the maximum of information from contours using this dimension. We obtain 36 representative blocks of 96x120 pixels each. Then, color, texture and edges are extracted for each region and block.
Image (576x720 pixels) (0,0)
(0,1)
(0,2)
(0,3)
(0,4)
(0,5)
(1,0)
(1,1)
(1,2)
(1,3)
(1,4)
(1,5)
(2,0)
(2,1)
(2,2)
(2,3)
(2,4)
(2,5)
(3,0)
(3,1)
(3,2)
(3,3)
(3,4)
(3,5)
(4,0)
(4,1)
(4,2)
(4,3)
(4,4)
(4,5)
(5,0)
(5,1)
(5,2)
(5,3)
(5,4)
(5,5)
vector of the visual keywords in the key-frames is build and this vector is called the IVSM signature (Image Vector Space Model) of the key-frame. Finally, SVMs and NNs are used to obtain the first level classification which outputs will then be fused by the neural network based on evidence theory (NN-ET) [2]. A. Low level features extraction For the study presented in this paper we distinguish three types of features: visual (color, texture) and edges. 1) Color descriptor: A color is represented by three dimentionnal vector corresponding to a position in a color space. This leaves us to select the color space and the quantization steps. We chose the Hue-Saturation-Value (HSV) and redgreen-blue (RGB) spaces. HSV is considered more suitable since it separates the color components (HS) from the luminance component (V) and it is less sensitive to illumination changes. In order to capture the local information in a way that reflects the human perception of the content, color features are extracted on regions and blocks of segmented key-frames [3]. Then, to have reasonable computation complexity and storage requirements, region and block features are quantized and keyframes are represented by a count vector of quantization vectors using 128 bins. Finally, we obtain four color descriptors (RGBreg ,HSVreg ,RGBblock ,HSVblock ). 2) Texture descriptor: The texture of a region is modelled by the energies of the output to 24 Gabor filters. The filters of Gabor have the particularity to make a filtering close to that realized by our visual perception system. They are sensitive in both orientation and frequency. Furthermore, the Gabor advantage is optimal resolution in frequency and in space. A two dimentional Gabor function g(x, y) and its Fourier transform in polar coordinate G(f, θ) can be written as: � � � 2 � 1 x y2 (x + y) 1 , exp + 2 + 2πj g(x, y) = 2πσx σy 2 σx2 σy λ (1) where σ, the standard deviation of the Gaussian function, determines the size of the receptive field. λ is the wavelength of the complex sinusoid. 2π λ determines the preferred spatial frequency of the receptive field function.
Sub-image (96x120 pixels)
G(f, θ) = exp
Fig. 3.
Partition of image space on sub-images.
The obtained vectors over the complete database are clustered to find the N most representative elements. The clustering algorithm used in our experiments is the well-known k-means. Representative elements are then used as visual keywords to describe key-frames video content. Then, the occurrence
−(f − fs )2 2Sf2s
! exp
−(θ − θr )2 2Sθ2r
! (2)
where f denote the radial frequency and θ denotes orientations (angular directions) of the 2D Gabor function in the spatial frequency domain. Center frequency of octave bandwidth fs = 34 (max(f ) − min(f ))2s . The radial index s ∈ {0, 1, 2, 3, 4} and angular index r ∈ {0, 1, 2, 3, 4, 5}. Sfs and Sθr are the standard deviations of the Gabor function in radial and angular directions respectively [4]. After applying Gabor filters on the image with different orientations at different scales, we obtain an array of magnitudes,
These magnitudes represent the energy content at different scales and orientations of the image. We use in our system 24 Gabor filters, 4 scales and 6 orientations, to capture the texture characteristics in frequency and direction. The texture feature vector is composed of the output energy of each filter. 3) Edge histogram descriptor: Edges in the image are considered as an important feature to represent the image content. Human eyes are known to be sensitive to edge features for image perception. In MPEG-7, there is a descriptor for edge distribution in the image [5]. It consists only of the local edge distribution in the image. To localize edge distribution to a certain area of the image, we divide the image space into 6x6 non-overlapping subimages as shown in figure 3. Then, for each sub-image, we generate an edge histogram. Four directional edges (0◦ , 45◦ , 90◦ , 135◦ ) are detected in addition to non-directional ones. B. Quantization This operation consists in gathering regions and sub-image blocks having a similar content with respect to low-level features. The objective is then to have a compact representation of the content without sacrificing the accuracy. For this purpose, the k-means algorithm is used with the Euclidian distance. We call visual terms the representative regions or blocks obtained from the clustering and visual dictionary the set of visual terms. The number of visual terms used in our experiments is 50. For each region and block of a frame, its closest visual term is identified and the corresponding index is stored discarding original features. C. Static feature fusion 1) Concatenation of features: In the first fusion strategy, all descriptors (RGBreg , HSVreg , Gaborreg , RGBblock , HSVblock , Gaborblock , EHDblock ) are merged into a unique vector, that is called merged fusion(Dmerged ) as follow : Dmerged = [RGBreg |HSVreg |...|EHDblock ]
(3)
All descriptors must have more or less the same numerical values to avoid scale effects. 2) Average of features: This approach builds an average of the different descriptors. It requires no compilation of data, these last ones undergo only a simple normalization before being added. It is interesting to give a weight or confidence level to each of the descriptors. This method is usually used, in particular in the automatic video concepts detection of the TrecVid project [6], where we observe the good contribution of the fusion operators as Min and average. D. Classification The classification consists in assigning classes to video keyframes given the description of its content. It is an important step for video indexing systems since it allows completing
the visual description of the content with class information. Unfortunately, many different cues are implied in the classification process. The visual content is extremely rich in semantic classes, but only limited data is available to build classification models. We decided to conduct the classification on individual features in order to have enough training data with respect to input vector dimension. Allwein et al [7] showed that it was possible to transform a multi-classes classification problem into several binary classification problems. They propose the one-against-all method, which consists in building a system of binary classification for each class. Every binary system classifies samples in a class or in the other (i.e. all the remaining classes). In our work, this method is adopted using the SVM and neural network (MLP) classification. 1) Support Vector Machines (SVMs): SVMs are probably the most popular machine learning techniques nowadays. They have shown very good generalization performance on many pattern classification problems. They allow a non linear separation of classes with very good generalization capability. They have been first introduced by Vapnik [8] for the text recognition task. The decision function for sample x in linear separation of classes is: f (x) = wx + b =
X
αi xi x + b
(4)
i
where w is a normal vector of a hyperplane. {xi }, i = 1, ..., l are the support vectors and {αi }, i = 1, ..., l are the corresponding weights. The main idea is similar to the concept of a neuron: separate classes with a hyperplane. However, samples are indirectly mapped into a high dimensional space thanks to a kernel function that respects the Mercer’s condition [9]. This allows leading the classification in a new space where samples are assumed to be linearly separable: f (x) =
X
K(xi , x) + b
(5)
i
We use the implementation SVMLight detailed in [10]. The selected kernel (Table I), denoted K(.), is a radial basis function which normalization parameter σ is chosen depending on the performance obtained on a validation set. The radial basis kernel is chosen for his good classification results comparing to polynomial and sigmoidal kernels [11]. 2) Neurals Network (NNs): Multi-Layer perceptron (MLP) networks trained by back propagation are among the most popular and versatile forms of neural network classifiers. In the work presented here, a multilayer perceptron networks with a single hidden layer and sigmoid activation function [12] is employed. The number of neurons contained in the hidden layer is empirically calculated. A description of the feature vectors presented to the input layer is given in section II-A.
K1 (x, y) = exp
Gaussian RBF
� −||x−y||2 � σ
Polynomial
K2 (x, y) = ((x.y) + θ)d
Sigmoidal
K3 (x, y) = tanh (k(x.y) + θ) K4 (x, y) = √
Inv. multiquadric
1 ||x−y||2 +c2
2) Layer L2 : Computes the belief masses mi (Equ. 7) associated to each prototype. It is composed of N modules of M + 1 units each (Equ. 8). The units of module i are connected to neuron i of the previous layer. Knowing that each image can belong to only one class (annotation clauses), we write : �
TABLE I C OMMON K ERNEL F UNCTIONS : G AUSSIAN RBF (σ ∈ R ), POLYNOMIAL
mi ({wq }) = αi uiq φ(di ) PM mi ({Ω}) = 1 − q=1 mi ({wq })
(7)
( DEGREE OF A POLYNOMIAL d ∈ N , θ ∈ R), SIGMOIDAL (k, θ ∈ R) AND INVERSE MULTIQUADRIC
(c ∈ R+ ) KERNEL FUNCTIONS ARE AMONG THE
hence,
MOST COMMON ONES .
mi = (mi ({w1 }), ..., mi ({wM +1 })) = (ui1 si , ..., uiM si , 1 − si ) E. Classifiers Fusion : Neural Network based on Evidence Theory (NN-ET) Classifier fusion is a necessary step to efficiently classify the video semantic content from multiple cues. For this aim, an improved version of RBF neural network based on evidence theory witch we call NN-ET is used [2]: One input layer Linput , two hidden layers L2 and L3 and one output layer L3 = Loutput (figure 4). Each layer L1 to L3 corresponds to one step of the procedure described in following: s1
μ
1
Normalized output
O1
Classifier 1
si
ui,q
μi
mi
OM
Classifier i
Classifier L
sN
Plausibility
μN
m L2
L3
N Y
X
m(A) = (m1 ⊕ ... ⊕ mN ) =
�
Pq = Oq + OM +1
OM+1
uN,q N
Lin
3) Layer L3 : The Dempster-Shafer combination rule combines N different mass functions in one single mass. It is given by the following conjunctive combination:
T ... T B
N =A
mi (Bi )
i=1
(9) The N mass function mi are composed of N modules of M + 1 units. The activation vector of modules i is → defined as µi .
1
m
Pi, j
Classifier 2
where uiq is the membership degree to each class wq , q classe index q = {1, ..., M }
B1
u1,q
(8)
Lout
Fig. 4. Neural Network based on Evidence Theory (NN-ET) classifier fusion structure
1) Layer L1 : contains N units (prototypes). It is identical to the RBF network input layer with an exponential activation function φ and d a distance computed using training data. α ∈ [0, 1] is a weakening parameter associated to prototype i, where � = 0 at the initialization stage [2]: i i i s = α φ(d ) i φ(d ) = exp (−γ i (di )2 ) (6) αi = 1 i 1+exp (−� ) where γ i is a positive parameter defining the receptive field size of prototype i = {1, ..., N }.
Ti T µi = k=1 mk = µi−1 mi µ1 = m1
(10)
The activation vectors for i = {2, ..., N } can be recursively computed using the following formula: i i−1 i−1 i−1 µj = µj mij + µj miM +1 + µM +1 mij
(11)
i µiM +1 = µi−1 M +1 mM +1
4) Ouput Layer: We build the normalized output O defined as: PN
i i=1 µj Oj = PN P M +1 i=1
j=1
µij
(12)
The different parameters (∆u, ∆γ, ∆α, ∆P , ∆s) can be determined by gradient descent of output error for a given input pattern x (more explanations see [2]). Finally, we compute the maximum of Pq (i.e the plausibility of each class wq ) as follow: Pq = Oq + OM +1
(13)
III. E XPERIMENTS
•
Experiments have been conducted on videos of soccer games. About 64 minutes of video (2256 key-frames of 576x720 pixels) have been used to train the feature extraction system and the remaining 32 minutes (1129 key-frames) have been used for evaluation purpose. The training set is divided into two subsets in order to train both classifiers and subsequently determine through learning the fusion parameters. Detection performance was measured using the standard precision and recall metrics. We are interested by the precision to have a measure of the ability of a system to present only relevant key-frames. Note, that if the total number of key-frames found for which a feature was true exceeded the maximum result size (50), average precision (AV) was calculated by dividing the summed precisions by 50 rather than by the the total number of true key-frames. Precision =
number of relevent key-frames retrieved total number of key-frames retrieved
(14)
The feature extraction task consists in retrieving keyframes expressing one of the following eleven semantic concepts. Table II provides some insight about the composition in terms of our selected semantic concepts for the soccer game video. It should be noted that some representative key-frames could not be assigned to a single category or did not fit any of the eleven categories. They have been assigned to the semantic class ”others”. Id 1 2 3 4 5 6 7 8 9 10 11
Concepts close-up action game stop goal camera lateral camera center view rear view right view left view zoom on public zoom on player aerial view others
test 200 81 5 50 217 13 21 144 139 156 15 75
train 617 76 13 92 507 6 142 208 94 246 15 238
total 817 157 18 142 724 19 163 352 233 402 30 313
TABLE II KEY- FRAMES DISTRIBUTION OF THE VIDEO KEY- FRAMES IN THE VARIOUS SETS BY SEMANTIC CONCEPTS .
•
NN-ET(SVMs): NN-ET fuses the outputs of the various SVMs (svm2 , ..., svm8 ); NN-ET(NNs+SVMs): NN-ET fuses both NNs and SVMs outputs (nn2 , ..., nn8 , svm2 , ..., svm8 );
T HE RELATIVE QUANTITY OF EVERY
CLASS IS CLARIFIED TO GIVE AN IDEA OF THE LOWER BORDER OF THE PERFORMANCES TO BE OBTAINED
We first present the effect of classifier fusion on concept detection results. The results obtained with the different feature fusion scheme will follow. A. Classifier Fusion We have experimented with the three following system configurations for classifier fusion: • NN-ET(NNs): NN-ET fuses the outputs of the various Neural Networks (nn2 , ..., nn8 );
Fig. 5. Comparison of NN-ET fusion results using neurals network (NNs), SVMs and (NNs+SVMs) outputs without features fusion step. (Concepts numbers: 1 to 11, 12: Mean Average Precision (MAP))
Figure 5 shows average precision results for the three distinct experiences. It can be seen that our proposed approach NN-ET(NNs+SVMs) improves the average precision for the concepts 1 (close-up), 3 (lateral camera), 7 (right view), 9 (zoom on player) and 11 (aerial view), and average precision decreases for concept 6 (rear view). The average precision AP ∈ [2, 96%], for exemple the semantic concepts (3:lateral camera, 7:right view) obtain (96%, 91%) respectivly. This is can be explained by the low number of positive samples in the test set (see Table II). Here, almost all positive samples are retrieved in the 50 first Kframes returned by our system. For semantic concept (6:rear view), the system obtains AP = 2%, which can be explained for two reasons: The first is the low number of positive samples in the training set and the second is due to the strong correlation between the global concepts (5,6,7,8). On average, the MAP oscillates around 36%, which represents a good performance considering the annotation complexity of the images under consideration. B. Feature Fusion Figure 6 shows the variation of average precision results using static feature fusion (Concatenation (Conc) and Mean (AVR)). We have performed the following five experiments: • •
NN-ET(Conc): NN-ET fuses the NN and SVM outputs via concatenation features fusion (nn1 , svm1 ); NN-ET(AVR): NN-ET fuses the NN and SVM outputs via average features fusion (nn1 , svm1 );
•
•
•
NN-ET(NNs+SVMs+Conc): NN-ET fuses all outputs with the concatenation classifier outputs (nn1 , ...nn8 , svm1 , ..., svm8 ); NN-ET(NNs+SVMs+AVR): NN-ET fuses all outputs and average classifier outputs (nn1 , ...nn8 , svm1 , ..., svm8 ); NN-ET(All): NN-ET fuses all NNs and SVMs outputs.
Fig. 6. Comparison of NN-ET fusion results using static feature fusion (AVR: average, Conc: concatenation). (Concepts numbers: 1 to 11, 12: Mean Average Precision (MAP)) .
We notice that the NN-ET(Conc) does not provide the same level of performance as NN-ET(AVR). However, for 7 semantic concepts (1, 2, 3, 4, 5, 7, 11) the static feature fusion based on average obtains much better scores and provides 3% improvement on average. In the case where we introduce NNs and SVMs outputs, we observe the decrease of performance using NNET(NNs+ SVMs+Conc), for all concepts compared to NNET( NNs+SVMs+AVR ) for which the mean average precision is 39%. Thus, the static fusion by averaging was able for some concepts to be a good contribution of information for a better final decision-making by the NN-ET, contrary to the information given by the static fusion by concatenation, which has degraded the grip of decision NN-ET(All). Comparing figure 5 and 6, we notice that the static feature fusion improves the concept 3 (lateral camera). The average precision increase from 96% to 100%. This can be explained per the order of key-frames returned by our system. Here, our system using static fusion returns in the first time all positives samples of this concept, contrary to the system without static fusion where it returns the positives samples but in a different ranking. Generally, the system provides good results and improves all concepts. IV. C ONCLUSION In this paper, we have presented an automatic semantic video content indexing and retrieval system. The reported
system employs visual and edges features with a static feature fusion in order to obtain a compact and effective representation, followed by SVMs and NNs based classification to solve the challenging task of video content classification. Finally, NN-ET method is used for combining classifiers. The experiments show that the features fusion via simple average operator is beneficial for our system. It is possible to obtain an improvement of 3% using this simple approach alone. Thus, a more detailed study and the use of a dynamic features fusion using probability or evidence theory is going to be undertaken. We have started to investigate the effect of the addition of many other features (dominant color, motion features, lines detection, DCT coefficients,...) to see their influence on our system. This would allow us to evaluate how the different approaches are able to deal with potentially irrelevant data. In parallel, we have initiated a program of work about ontology study between the classes. Indeed, the concepts are not remotely expressed and a strong correlation exists between certain semantic concepts as center, rear, left, right views. A first difficulty in the elaboration of an ontology [13] describing the existing relations between the concepts. A second difficulty which is of particular interest to us, is in the exploitation of this semantic information on our classification or fusion system. R EFERENCES [1] P. Felzenszwalb and D. Huttenlocher, “Efficiently computing a good segmentation,” Conference on Computer Vision and Pattern Recognition, pp. 98–104, USA, 1998. [2] R. Benmokhtar and B. Huet,“Neural network combining classifier based on Dempster-Shafer theory for semantic indexing in video content,”International MultiMedia Modeling Conference, vol. 4351, pp. 196– 205, Singapore, 2007. [3] C. Carson, M. Thomas, and S. Belongie, “Blobworld: A system for region-based image indexing and retrieval,” International Conference on Visual Information Systems, The Netherlands, 1999. [4] P. Kruizinga, N. Petkov and S. Grigorescu, “Comparison of texture features based on Gabor filters,”International Conference on Image Analysis and Processing, vol. 4351, pp. 142–147, Italy, 1999. [5] D.K. Park, Y.S. Jeon and C.S. Won, “Efficient use of local edge histogram descriptor,”ACM Workshops on Multimedia, pp. 51–54, USA, 2000. [6] M. Rautiainen and T. Seppanen,“Comparison of visual features and fusion techniques in automatic detection of concepts from news video,” IEEE International Conference on Multimedia & Expo, The Netherlands, 2005. [7] E. Allwein, R. Schapire, and Y. Singer, “Reducing multiclass to binary : A unifying approach for margin classifiers.” Journal of Machine Learning Research, vol. 1, pp. 113–141, 2000. [8] V. Vapnik, The nature of statistical learning theory. Springer, 1995. [9] N. Cristianini and J. Shawe-Taylor, An Introduction to Support Vector Machines. Cambridge University Press, ch. Kernel-Induced Feature Spaces, 2000. [10] T. Joachims, Advances in Kernel Methods - Support Vector Learning. MIT Press, 1999. [11] F. Souvannavong, B. Merialdo, and B. Huet, “Latent semantic analysis for an effective region based video shot retrieval system,” International Workshop on Multimedia Information Retrieval, USA, 2004. [12] G. Cybenko, “Approximations by superposition of a sigmoidal function,” Mathematics of Control, Signal and Systems, vol. 2, pp. 303–314,1989. [13] N. Fridman Noy and D.L. McGuinness,“Ontology development 101: A guide to creating your first ontology,”Technical report, Stanford Knowledge Systems Laboratory Technical Report KSL-01-05, 2001.