Recent Advances in Industrial and Manufacturing Technologies
Virtual Instrument Technology for Testing of Experimental Electronic Devices and Amplifier Circuits CAROL ZOLLER*, REMUS DOBRA*, DRAGOS PASCULESCU * * Department of Electrical and Power Systems, University of Petrosani * Address University str., no. 20, Petrosani ROMANIA
[email protected] [email protected] [email protected] Abstract: - In this work it is presented some ways of performing electronic laboratory measurements by means of a data acquisition boards and computer use and for that it was designed and realized an automatic testing system of electronic components and circuits, meaning a virtual measuring instrument. Two types of technologies are presented, the first one refers to a classical instrument for measurement and displaying the semiconductor devices characteristics, like: bipolar transistor, field-effect transistor, diode, Zener diode, resistance, thermistor, and so on; and the second one refers to a sweep-frequency generator (Vobler) apparatus that can be used for displaying of the frequency characteristics (or amplitude-frequency characteristics) for some circuits of radiofrequency amplifier type. The virtual instrument is obtaining using adequate interfaces, a data acquisition board and by the means of HP VEE visual programming language.
Key-Words: - Characteriscope, wobbuloscope, frequency characteristic, electronic devices characteristic, virtual instrumentation. The representation of the signal characteristics as well the transfer functions under shape for frequency dependence (amplitude-frequency).
1 Introduction This paper describes some ways to realize laboratory electronics measurements using the automatic systems (hardware and software required to acquisition monitoring end data compiling) as well the electronics equipment’s testing by the computer (PC). In the laboratory was performed some measurements, testing operations and activities in order to follow the behavior for specialized circuits using the computer (PC), as: The measure of specifically parameters and size of the electronic circuits and devices in stationary state, with memorizing and data compiling (processing) obtained from measurements, as well their presentation into comfortable shape for interpretation (diagrams, graphics and tables). So it can measure the voltages, frequencies, and electrical phases difference Graphics representation, on the PC display for the adjustable mode for different sizes or for some dependencies between different circuit parameters like frequency, temperature and so on; The spectral analysis of signals for determine the distortions (specially for high frequencies);
ISBN: 978-1-61804-186-9
1.1 Instrument technology used for amplifier circuits testing A sweep-frequency generator (SFG) is a complex apparatus that is a combination of: a wobbuloscope, an oscilloscope and a marking generator and is primarily used for measuring the responses of amplifiers, filters, and electrical components over various frequency bands.
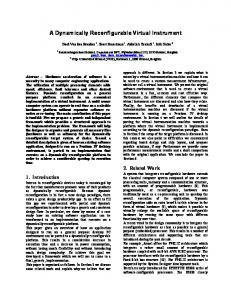
Figure 1. Vobler operating principle schematic Using a SFG it can be displayed the amplitudefrequency characteristics of filters, selective amplifiers, channel selectors, power VHF RF circuits, etc. Oy axis displayed on the lure of the
268
Recent Advances in Industrial and Manufacturing Technologies
feature corresponding amplitude (measured in volts or units relative dB) and the OX axis is calibrated in frequency. The sweep-frequency process means an automatic cyclical variation of a sinusoidal radiofrequency voltage, around a central frequency, f0. At the output the sweep-frequency generator results a sinusoidal voltage with constant amplitude, whose frequency varies for example, the rate of 50 Hz. The frequency deviation should be as straight and is obtained by means of a saw-tooth voltage with a frequency of 50 Hz. The amplitude of the RF signal has to be constant throughout sweep-frequency domain. Level is around 50-100 mV effective and can be adjusted by means of a continuous or stepped attenuator over a wide range, generally in between 0 ... 60 dB. Based on the those above it can be said that a vobler has the following specific commands: an output level attenuator, for standard non-symmetrical impedances (50-75Hz), a switch that allows the choice of sweep-frequency domain, a button which sets the central frequency and another button that allows to change the center frequency of the output RF signal.
a) The command circuit: Voltage/current step generator; The collector alimentation ensemble. b) The measure circuit: Horizontal amplifier (AH); Vertical amplifier (AV). c) The display circuit: Cathode ray tube (CRT). The apparatus display gives information about the behavior of testing devices in current-voltage or voltage-current relation. The voltage steps generator and generator with E(t) voltage are synchronize and maintaining constant for 10ms the applied step like in figure 3.
Figure 3. Time diagrams of the synchronized signals UBE and E(t) On the apparatus display the information is structured on horizontal axis in voltage and on vertical axis in current. One voltage supply E (t) creates through load resistance one current IC. The rectifier supplies the transistor collector with rectified half-wave voltage or double alternation E(t), through an adjustable resistor Rs, whose role is to limit the maximum power dissipation per device tested.
1.1 Instrument technology used for electronic devices testing Raising the static characteristics of electronic devices using oscilloscopes has become a very common technique, very efficient and quick. Specialized machines were built, namely “characteristics tracer” which use the sweep method consisting in application of a control time-varying signal, on the studied electronic device, aiming to obtain the response signal.
2 Virtual instrumentation dynamic measurements
Virtual instrumentation is hardware and software technologies used in order to create flexible and sophisticated instruments for control and monitoring different applications. Virtual instrumentation made possible decrease in price of both instruments presented in the first part of the paper instrument. As the virtual instrument depends very little on dedicated hardware, a customer could now use his own computer, while an instrument manufactures could supply only what the user could not get in the general market. A virtual instrument consists of a computer equipped with powerful application software, as Agilent HPVEE as we have used in this applications, cost-effective hardware such as PC plug-in boards, and driver software, which together outperform the functions of traditional instruments for test and automation. Virtual instruments
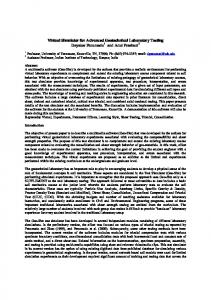
Figure 2. The block scheme for classical characteriscope The block diagram of such a device is shown in figure 2, with the visualization conditions for Ic = f (UCE, IBE), with the current (or voltage) of the base as input parameter. In accordance with his electrical construction, the characteriscope can be divided in three functional ensembles:
ISBN: 978-1-61804-186-9
for
269
Recent Advances in Industrial and Manufacturing Technologies
represent a fundamental shift from traditional hardware instrumentation systems to softwaresystems that exploit the computing power, productivity, display and connectivity capabilities of modern-day computers.
well are establish the display size and sample rate (131072 points respective 5kHz).
2.1 Virtual instrumentation for dynamic measurements of electronic circuits The automation testing system for specializing circuit destined to data acquisition and measurement-using PC has the common structure like in figure 4.
Figure 5. Developed virtual instrument for measuring the linear variable voltage generator and the preamplifier answer The voltage-frequency converter supply the preamplifier with square (sine) signal, and in ideal mode, the signal applied to the amplifier input have to be send at its output as the supplied power to be higher than the absorbed power from the signal power, but the signal wave to be the same. The last conditions determine the amplifier fidelity and the high fidelity amplifier respects this condition, which is called HI-FI. At the output of the linear variable voltage generator is placed one transistor for arriving only the positive side of signal on the acquisition board, and from his collector the output signal of the linear variable voltage generator goes in acquisition plate for to be triggered. To run the program you can click the “Arm Singleshot” instrument on the panel. After running the program, the selected information is displayed on screen.
Figure 4. The block scheme for characteristic measurement of an audio-frequency amplifier Figure 4 shows the block scheme for measure some audio-frequency amplifier characteristics, and the base element is the linear variable voltage generator (G.V.L.V.), which was identified bipolar circuit and at achieves delays or free waves through monitored loading and discharge at the external capacity. The linear variable voltage generator supply a frequency converter V/f (voltage-frequency) and its output obtain a signal, which has frequency direct proportional with voltage given by the linear variable voltage generator. In the above scheme the linear variable voltage generator fulfills the role as astable circuit or relaxation oscillator. The virtual developed instrument for measuring the output voltage of the linear variable voltage generator and preamplifier characteristic answer is presented in figure 5. In the first half of the figure 5 as shown the variation of output voltage of the linear variable voltage generator because of monitored loading and discharge at the external capacity, and is given information about of the voltage amplitude and the signal frequency. In the second half of the figure 5 as shown the preamplifier characteristic answer and for to realize the frequency characteristic, the frequency of input voltage applied is varies and the amplitude is kept to a constant value equal with amplitude. In preliminary the selection is made for the trigger level, pre-trigger, trigger channel, trigger modes as
ISBN: 978-1-61804-186-9
Figure 6. The graphical program, for measuring the preamplifier characteristic answer
270
Recent Advances in Industrial and Manufacturing Technologies
The graphical program, using a data acquisition board, for measuring the output voltage of the linear variable voltage generator U1(t) and preamplifier characteristic answer U2(t), and can be seen also the U2(U1) correlation or U2(f). AD Config instrument is used for configuration of Data Acquisition Board to virtual oscilloscope of tested amplifier. Using the XY Trance display object, the program plot the graphical correlation between U2 and U1, U2 being the consequence of output voltage from linear variable voltage generator. To run the program you can click the Start instrument on the panel. After running the program, the output voltage of the linear variable voltage generator (U1), and preamplifier answer (U2) is displayed on screen.
amplitude is kept to a constant value equal with amplitude like in picture 7, 8. The pass-band of amplifier is determined by the frequency characteristic. To run the program the Start instrument on the panel must be clicked. After running the program, the output voltage of the linear variable voltage generator (U1), and preamplifier answer (U2) is displayed on screen, as well the amplitudefrequency characteristic of magnetic preamplifier U2(f).
2.2 Virtual instrumentation for dynamic measurements of electronic devices Figure 9 shows the electrical scheme for measuring the electronic devices characteristics, and the base element is the steps voltage generator (S.V.G.) or current steps generator. The generator can be programmed for different the number of steps voltage, with polarization negative or positive and with certain amplitude of current or step voltage. RC - is a variable resistance, which can be imposing at certain value by the operator. RE - is the emitter resistance. The data acquisition board is receiving the information through three adequate channels via the electronic device terminations. It includes the possibility of the addition (or subtraction) of a DC voltage (or a current), the signal generator speed to obtain the response characteristics of the devices tested with different offset values of the test parameters. Speed generator voltage or current, can be set in terms of the number of steps by the operator.
Figure 7. The Fourier analyzer and frequency characteristic response of the tested amplifier Define the frequency characteristic (or amplitudefrequency characteristic) amplifier the graphics representation of the output voltage amplitude variation independence with the sinusoidal input voltage frequency.
Figure 9. Electrical scheme for electronic devices characteristics measurement The figure 10 is presenting the program for measuring the family characteristics of the bipolar transistor. Y1 is the correlation between the current IC and the voltage UCE. On the virtual instrument display the device information is structured axis "x axis" in to voltage, and the "Y axis" in to current. The devices that are to be tested shall be fixed in relation to the terminals
Figure 8. The Fourier analyzer and frequency characteristic response of the tested amplifier In order to realize the frequency characteristic, the frequency of input voltage applied varies and the ISBN: 978-1-61804-186-9
271
Recent Advances in Industrial and Manufacturing Technologies
B, C, E in accordance with the specific terminal device.
The input and output data of the tested transistor are shown in the figure 11, the change in the value of either lead to changes in the other three. Because of that in the diagram appear families of static characteristics of input, output and transfer. In figure 12, is presented a diode characteristic and in order to do this type o measurement the tested diode device must be place in the characteriscope capsule: the anode is connected to the collector and the cathode to emitter. Voltage at the diode begins to conduct is called opening voltage and as it can be seen in the below figure this voltage is around 0.6 V, resulting that the electronic device is a silicon diodes. The most common function of this type of diode is to allow an electric current to pass in one direction (called the diode's forward direction), while blocking current in the opposite direction (the reverse direction).
Figure 10. Graphical program of the virtual characteriscope The collector resistance (RC) is a variable resistor which the operator may impose a certain value in order to obtain the desired load current. Maximum current obtained trough RC is automatically limited so that maximum power dissipation per collectoremitter resistance does not exceed an amount required by the operator. Emitter resistance is a lowvalue resistor. This measuring virtual instrument is designed to allow characteristic analysis of semiconductor devices by viewing them, being able to analyze the characteristics of bipolar transistors, field effect transistors, diodes, Zener diodes, tunnel diodes, varicap diodes, the thyristor etc. Using this virtual characteriscope it can view some so-called inputoutput characteristics of the semiconductor devices with two terminals through three terminals.
Figure 12. Graphical interface of the virtual instrument for diode characteristic measurement In figure 13 is presented a virtual measurement of a thermistor device. A thermistor is a type of resistor whose resistance varies significantly with temperature.
Figure 13. Graphical interface of the virtual instrument for thermistor characteristic measurement
Figure 11. Graphical interface of the virtual instrument for bipolar transistor characteristic measurement ISBN: 978-1-61804-186-9
272
Recent Advances in Industrial and Manufacturing Technologies
The unique characteristic of thermistor where the body temperature increases as current passes through it can be seen by considering the power levels in the thermistor. This is the "self-heat" mode, and it is indicated by the inflection of the graph at higher power levels. The current voltage characteristic measurements were performed using a virtual measuring tester composed of data acquisition board, an adequate designed interface and the VPVEE software installed on the PC.
International Test Conference, 1999, pp. 757– 762. [2] T. Kuyel, Linearity Testing Issues of Analog to Digital Converters, Proc. International Test Conference, 1999, pp. 747–756. [3] F. Azais, S. Bernard, Y. Bertrand, M. Comte and M. Renovell, Correlation Between Static and Dynamic Parameters of A-to-D Converters: In the View of a Unique Test Procedure, Journal of electronic testing: Theory and Applications 20, 375–387, 2004 [4] Viranjay M. Srivastava, Application of VEE Pro Software for Measurement of MOS Device Parameters using C-V curve, International Journal of Computer Applications, 2010 [5] Viranjay M. Srivastava, Capacitance-Voltage Measurement for Characterization of a MetalGate MOS Process, International Journal of Recent Trends in Engineering (IJRTE), vol. 1, no. 4, May 2009, India, 4-7. [6] Popa, Mircea Ionel, Raul, Virtual Instrumentation Application for System Identification, Instrumentation and Measurement Technology Conference, Proceedings of the IEEE, p.p. 842 – 846, April 2006. [7] Jianqiang Liu, Xingqi Fu, Xingcheng Zhang, Jianye Song, The development and application of virtual instrument technology in the experimental teaching, Education Management, Education Theory and Education Application Advances in Intelligent and Soft Computing Volume 109, 2012, pp 589-594 [8] Cohen, B.S., Aldridge, A.J., West, W, The frequency characteristics of telephone systems and audio-frequency apparatus, and their measurement, IEEE Journal, Volume: 64, Issue: 358. [9] Y. Labrou, T. Finin, and Y. Peng, Agent Communication Languages: The Current Landscape, IEEE Intelligent Systems 14 No. 2 (March 1999): 45-52. [10] *** Datatranslation DT 300 User‘s Manual, Data Translation, Inc., 100 Locke Drive, Marlboro, MA 01752-1192 USA. [11] *** Traceur des caractėristiques des semiconductores – characteriscope Z TR4805 datasheet
4 Conclusion This work presented a virtual instrument technology for testing of experimental electronic devices and amplifier circuits, because knowing the electronic devices and circuits characteristics is important in two aspects: in order to do an attunement for obtaining the filter response characteristics, and to check characteristic response of circuits containing passive or active power filters, because the quality appreciation of the electrical circuits is done based on its electrical characteristics. We presented a block diagram for measuring the characteristics of audio frequency amplifiers, which consists of a linear variable voltage generator (GTLV) that provides linear signal amplitude that varies with time and can be programmed to provide the speed parameters scavenging. The signal provided by the variable voltage generator is applied to a linear voltage-frequency converter (V / f). The signal U2(t) at the output tested amplifier enter in to the data acquisition board and so the signal is rectified and averaged - the phenomenon which is called the detection process. In these circumstances the computer display shows the frequency characteristic of that amplifier. From the shape of the circuit type result the investigated characteristics, i.e. passive circuit can identify that acts as a low pass, band pass, band stop or high pass filter. We presented the block diagram of the automatic testing system of electronic components, namely a virtual characteriscope and the computer screen provides information about the behavior of the analyzed devices in the current-voltage relationship. The tested device is fixed in relation to the terminals B, C, E in accordance with the device terminals.
References: [1] Hg N. Csizmadia and A.J.E.M. Janssen, Estimating the Integral Non-Linearity of ADConverters via the Frequency Domain, in Proc. ISBN: 978-1-61804-186-9
273