capable of hosting additional virtual network requests, resulting in higher ... to offer network virtualization services that call for embedding virtual networks in data ...
Virtual Network Embeddings in Data Center Networks Soroush Haeri and Ljiljana Trajkovi´c Simon Fraser University Vancouver, British Columbia, Canada Email: {shaeri, ljilja}@sfu.ca Abstract—Network virtualization enables coexistence of multiple virtual networks on a shared infrastructure without requiring unified protocols, applications, and control and management planes. Recent approaches such as Software Defined Networking have enabled cloud service providers to offer virtualized network services that require embedding virtual network requests in data centers. In this paper, we employ R-Vine, D-Vine, and Global Resource Capacity (GRC) algorithms to perform a series of virtual network embeddings on BCube and Fat-Tree substrate networks. We compare these two data center network topologies to determine the topology that is better suited for virtual network embeddings. Simulation results show that the Fat-Tree network is capable of hosting additional virtual network requests, resulting in higher substrate node and link utilization.
I.
I NTRODUCTION
Network virtualization was proposed to address the inability of the current Internet architecture to support emerging applications [1]. Since its inception, network virtualization has been well-received as an enabling technology for cloud computing [2] and one of the components of the future Internet architecture [3]. The virtualized network model divides the role of an Internet Service Provider (ISP) into two independent entities: Infrastructure Providers (InPs) and a Service Providers (SPs). The InPs manage the physical infrastructure while the SPs aggregate resources from multiple InPs into multiple Virtual Networks to provide end-to-end services [1]. In the virtualized network architecture, an InP owns and operates a substrate network consisting of physical nodes and links that are interconnected in an arbitrary topology. Combinations of the substrate network nodes and links are used to embed various virtualized networks. Virtual networks that are embedded in a substrate network are isolated thus enabling end-to-end service provisioning without requiring unified protocols, applications, and control and management planes. Virtual Network Embedding (VNE) algorithms assign substrate resources to virtual network elements. It is one of the main challenges in network virtualization. VNE may be reduced to the multiway separator problem, which is N Phard [4]. Various algorithms have been proposed to find profitable virtual network embeddings given arbitrary substrate and virtual network topologies [4]–[6]. Their performance has been evaluated using synthetic network topologies that model ISP networks. These algorithms were designed without assumptions regarding topologies of substrate and virtual networks. Therefore, they may be applied to any arbitrary substrate and virtual networks. Assuming a specific substrate or virtual
topology may simplify the algorithms and the embedding process. A study that considered the impact of common ISP topologies (Ladder, Star, and Hub-and-Spoke) revealed that topological features significantly affect quality of the VNE solution [7]. Software Defined Networking (SDN) has recently enabled cloud providers such as the Amazon Web Services (AWS) [8] to offer network virtualization services that call for embedding virtual networks in data centers. Data center networks have predefined topologies and, therefore, topology-specific embedding algorithms have been proposed [9], [10]. In this paper, we consider two proposed BCube [11] and Fat-Tree [12] topologies to identify the preferred choice for VNE. We employ three general purpose VNE algorithms: RVine [4], D-Vine [4], and Global Resource Capacity (GRC) [5]. A number of virtual network embeddings is then performed on a BCube and a Fat-Tree substrate networks. We compare Virtual Network Request (VNR) acceptance ratios, revenue to cost ratios, and substrate resource utilizations. The remainder of this paper is organized as follows. In Section II, we introduce the VNE problem and its objectives and describe metrics for measuring VNE performance. Data center topologies are introduced in Section III. In Section IV, we present the simulation results. We conclude with Section V. II. s
s
s
T HE VNE P ROBLEM
Let G (N , E ) denote the substrate network graph, where N s = {ns1 , ns2 , . . . , nsj } is the set of j substrate nodes (vertices) and E s = {es1 , es2 , . . . , esk } is the set of k substrate edges (links). Let the ith VNR be denoted by a triplet Ψi (GΨi , ω Ψi , ξ Ψi ), where GΨi (N Ψi , E Ψi ) is the virtual netΨi Ψi Ψi i work graph with N Ψi = {nΨ = 1 , n2 , . . . , n` } and E Ψi Ψi Ψi {e1 , e2 , . . . , em } denoting the set of ` virtual nodes and m virtual edges, respectively. Furthermore, ω Ψi is the VNR arrival time and ξ Ψi is its life-time according to distributions Ω and Ξ, respectively. We assume that a substrate node ns ∈ N s possesses resources such as residual CPU capacity C(ns ) while a VNR node nΨi ∈ N Ψi requires a CPU capacity C(nΨi ). Similarly, a substrate edge es ∈ E s possesses a set of properties such as its residual bandwidth B(es ) and a virtual edge eΨi ∈ E Ψi is constrained by a set of requirements such as bandwidth B(eΨi ). We assume that substrate nodes possess residual CPU capacities C(ns ) while virtual nodes require a CPU capacity C(nΨi ). The only substrate link resource is the residual bandwidth B(es ) while virtual links have bandwidth requirements B(eΨi ) [4].
A. Objective of VNE Most proposed VNE algorithms have the objective to maximize the profit of InPs [4]–[6], [13]. The three main contributing factors to the generated profit are embedding revenue, cost, and the VNR acceptance ratio. Revenue: InPs generate revenue by embedding VNRs. The revenue generated by embedding a VNR Ψi may be calculated as a weighted sum of VNR resource requirements: X X R(GΨi ) = wc C(nΨi ) + wb B(eΨi ), (1) nΨi ∈N Ψi
Cost: For embedding a VNR Ψi , the InP incurs a cost based on the resources it allocates. This cost is calculated as: X X X Ψi (2) C(GΨi ) = fees , C(nΨi ) + eΨi ∈E Ψi es ∈E s
Ψi
where fees denotes the total bandwidth of the substrate edge es that is allocated for the virtual edge eΨi [4]. Unlike the revenue, the cost depends on the embedding configuration. Hence, if a VNR Ψi is accepted, C(GΨi ) values depend on the embedding configuration within the substrate network. Acceptance Ratio: In a given time interval τ , the ratio of the number of accepted VNRs |Ψa (τ )| to the total number of received VNRs |Ψ(τ )| defines the acceptance ratio or the probability of accepting a VNR: pτa =
BCube(0,2)
BCube(0,3)
BCube(0,4)
POD 1
POD 2
POD 3
POD 4
eΨi ∈E Ψi
where wc and wb are the weights for CPU and bandwidth requirements, respectively [13]. Note that the generated revenue is not a function of the embedding configuration. Hence, if a VNR Ψi is accepted, R(GΨi ) yields a constant value regardless of the embedding configuration within the substrate network.
nΨi ∈N Ψi
BCube(0,1)
|Ψa (τ )| . |Ψ(τ )|
(3)
B. VNE Algorithms Mixed integer programming has been employed to solve the VNE problem. The R-Vine and D-Vine algorithms use a rounding-based approach to obtain a linear programming relaxation of the relevant mixed integer program [4]. Their objective is to minimize the cost of accommodating the Virtual Network Requests (VNRs). Node-ranking-based algorithms are among the most recent approaches to solve the VNE problem [5], [6], [13]. This family of algorithms computes a score/rank for substrate and virtual nodes based on various heuristics. Then, using the computed rank, a large-to-large and small-to-small [6] mapping scheme is employed to map the virtual nodes to substrate nodes. The Global Resource Capacity (GRC) [5] is one of the recent node-ranking-based algorithms that outperforms earlier similar proposals. VNE problem may be divided into virtual node mapping (VNoM) and virtual link mapping (VLiM) subproblems [14]. In this paper, we employ coordinated two-stage algorithms, which first solve VNoM while considering the virtual link requirements. For a given VNR, a viable node mapping that is achieved by solving the VNoM problem is then used as the input to a VLiM solver. VLiM solvers are either based on the shortest path (k-shortest path, Breadth-First Search, or
Switch
Host
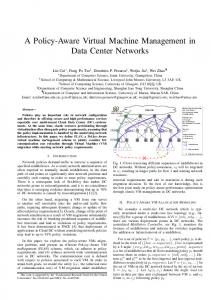
Fig. 1. Two examples of data center topologies: BCube(2, 4) (top) and Fat-Tree4 (bottom).
Dijkstra) or the Multicommodity Flow (MCF) algorithms. The MCF algorithm enables path splitting where a flow may be divided into multiple flows with lower capacity, which may be routed through various paths. The shortest-path algorithms are more strict than the MCF algorithm. Therefore, VNE algorithms that utilize MCF often achieve higher acceptance ratio. R-Vine and D-Vine algorithms employ MCF to identify the link mappings while GRC employs the shortest-path algorithm. III.
DATA C ENTER N ETWORK T OPOLOGIES
Various data center network topologies that have been proposed [11], [12], [15] are often designed to be scalable for a large number of servers and to have fault tolerance against various disruptions such as link or server rack failures. Data center networks should provide high network capacity to support services with high bandwidth requirements [15]. They consist of hosts, switches, and links. Hosts are used for virtual node embeddings while switches are used only for traffic forwarding. A BCube [11] topology BCube(k, n) consists of k levels and n hosts in level-0. This topology is recursively structured. BCube level-0 consists of n hosts connected to an n-port switch. Switches are not directly connected to each other and hosts perform packet forwarding functions. The BCube(2, 4) network topology is shown in Fig. 1 (top). Fat-Tree topology is a Clos architecture initially proposed to interconnect processors of parallel supercomputers [16]. It has been recently used for data center networks [12]. A Fat-Treek topology is constructed using (k/2)2 + k 2 k-port switches and supports k 3 /4 hosts. The Fat-Tree4 is shown in Fig. 1 (bottom). IV.
S IMULATION R ESULTS
We developed a discrete event simulator VNE-Sim and implemented R-Vine [4], D-Vine [4], and GRC [5] algorithms. We consider four performance measures: acceptance ratio (3), revenue (1) to cost (2) ratio, and substrate node and link utilizations. The implemented R-Vine and D-Vine algorithms are
modified to ignore node coordinates, which are inconsequential in data center networks. The Fast Network Simulation Setup [17] is used to generate the BCube and Fat-Tree substrate topologies. The BCube topology is a two-level (k = 2) topology with 4 hosts per BCube level-0 (n = 4). It consists of 64 hosts, 48 switches, and 192 link. The Fat-Tree substrate network graphs is generated using 6-port switches (k = 6). It consists of 54 hosts, 45 switches, and 162 links. The selected BCube and Fat-Tree topologies have comparable number of hosts, switches, and links. The VNR graphs are generated using the Boston University Representative Topology Generator [18]. Connections between the nodes in VNR graphs are generated based on the Waxman algorithm [19] with the parameter α = 0.5 and the exponential parameter β = 0.2 [20]. The number of nodes is uniformly distributed between 3 and 10 [4]. Each virtual node is connected to a maximum of 3 virtual nodes. The CPU capacity of each substrate host and the available bandwidth of each substrate link are initially set to 100 units. In our implementation, the substrate network switches have no CPU capacity because they are not used for VNEs. The CPU requirement of a virtual node is uniformly distributed between 2 and 20 units [4] while the bandwidth requirement of a virtual link is uniformly distributed between 1 and 10 units. The bandwidth values are chosen to resemble a substrate network with 10 Gbps links and virtual networks with 100 Mbps to 1 Gbps links. The VNRs arrival rate and life-time distribution parameters are selected based on the size of the substrate network [4], [5]. We assume that the VNRs arrive according to a Poisson distribution with a mean arrival rate of λ requests per unit time. Life-time of VNRs is exponentially distributed with a mean 1/µ yielding to a VNR traffic of λ/µ Erlangs. We assume 1/µ = 1, 000 in simulation scenarios. The VNR arrival rates are varied between 1 and 8 requests per 100 time units generating traffic loads of 10, 20, 30, 40, 50, 60, 70, and 80 Erlangs, respectively [5]. Duration of each simulation scenario is 50,000 time units [4]–[6]. Average VNR processing times of GRC, R-Vine, and DVine algorithms in the BCube simulation scenarios were 0.04 s, 2.82 s, and 2.8 s, respectively. In the Fat-Tree scenarios, the processing times of algorithms were 0.03 s, 2.12 s, and 2.13 s. Performance of the VNE algorithms using the BCube and Fat-Tree substrate network topologies is shown in Fig. 2 (left column) and Fig. 2 (right column), respectively. Simulation results show that the Fat-Tree topology results in up to 10% higher acceptance ratios as the VNR traffic load increases. This yields up to 20% higher node and up to 10% higher link utilizations. The revenue to cost ratios are slightly lower than in the case of the BCube topology. A desirable VNE should achieve high acceptance ratio, substrate node and link utilizations, and revenue to cost ratio. In BCube topologies, hosts perform traffic forwarding functions while in Fat-Tree topologies, traffic forwarding is only performed by switches. This introduces additional traffic over the links that are connected to the hosts. These links are important for the virtual network embeddings especially those that require multiple connections to other virtual nodes. Therefore, performing traffic forwarding using only the core
switches instead of the hosts potentially leads to higher VNR acceptance ratios. The considered Fat-Tree topology has higher switch to host ratio (0.84) compared to the BCube topology (0.75). This provides additional paths between the hosts, which, in turn, may result in higher acceptance ratios. We simulated data center topologies that are much smaller than the currently deployed data center networks because of the memory requirements and simulation time. Larger data center topologies possess the same structure as those employed in simulations. The size and the structure of the requested virtual network topologies also affect scalability and performance of the algorithms. However, in this study, we did not evaluate the effects of topology size on performance of VNE algorithms. V.
C ONCLUSION
In this paper, we compared the BCube(2, 4) and FatTree6 network topologies for virtual network embedding. We employed R-Vine, D-Vine, and Global Resource Capacity algorithms to perform the virtual network embeddings. The simulation results indicate that the Fat-Tree topology is capable of accepting additional number of virtual network requests even though the topology is composed of slightly fewer number of hosts, switches, and links. As a result, it achieves higher substrate node and link utilization. R EFERENCES [1]
[2]
[3] [4]
[5]
[6]
[7]
[8] [9]
[10]
[11]
[12]
N. Feamster, L. Gao, and J. Rexford, “How to lease the Internet in your spare time,” Comput. Commun. Rev., vol. 37, no. 1, pp. 61–64, Jan. 2007. F. Baroncelli, B. Martini, and P. Castoldi, “Network virtualization for cloud computing,” Annals of Telecommunications, vol. 65, no. 11, pp. 713–721, July 2010. M. Chowdhury and R. Boutaba, “A survey of network virtualization,” Computer Networks, vol. 54, no. 5, pp. 862–876, Apr. 2010. M. Chowdhury, M. R. Rahman, and R. Boutaba, “ViNEYard: Virtual network embedding algorithms with coordinated node and link mapping,” IEEE/ACM Trans. Netw., vol. 20, no. 1, pp. 206–219, Feb. 2012. L. Gong, Y. Wen, Z. Zhu, and T. Lee, “Toward profit-seeking virtual network embedding algorithm via global resource capacity,” in Proc. IEEE INFOCOM, Toronto, ON, Canada, Apr. 2014, pp. 1–9. X. Cheng, S. Su, Z. Zhang, H. Wang, F. Yang, Y. Luo, and J. Wang, “Virtual network embedding through topology-aware node ranking,” Comput. Commun. Rev., vol. 41, pp. 38–47, Apr. 2011. M. C. Luizelli, L. R. Bays, L. S. Buriol, M. P. Barcellos, and L. P. Gaspary, “Characterizing the impact of network substrate topologies on virtual network embedding,” in Proc. 9th Int. Conf. Netw. and Service Manag. (CNSM 2013), Zurich, Switzerland, Oct. 2013, pp. 42–50. (2015, Sept.) Amazon Web Services. [Online]. Available: https://aws.amazon.com. C. Guo, G. Lu, H. J. Wang, S. Yang, C. Kong, P. Sun, W. Wu, and Y. Zhang, “SecondNet: a data center network virtualization architecture with bandwidth guarantees,” in Proc. ACM CoNEXT 2010, Philadelphia, PA, USA, Dec. 2010, p. 15. H. Ballani, P. Costa, T. Karagiannis, and A. Rowstron, “Towards predictable datacenter networks,” ACM SIGCOMM Comput. Commun. Rev., vol. 41, no. 4, pp. 242–253, Oct. 2011. C. Guo, G. Lu, D. Li, H. Wu, X. Zhang, Y. Shi, C. Tian, Y. Zhang, and S. Lu, “BCube: A high performance, server-centric network architecture for modular data centers,” ACM SIGCOMM Comput. Commun. Rev., vol. 39, no. 4, pp. 63–74, Oct. 2009. M. Al-Fares, A. Loukissas, and A. Vahdat, “A scalable, commodity data center network architecture,” ACM SIGCOMM Comput. Commun. Rev., vol. 38, no. 4, pp. 63–74, Oct. 2008.
1 GRC
GRC
R-Vine
R-Vine
D-Vine 0.8
0.6
Acceptance ratio pa
Acceptance ratio pa
1
0.4
D-Vine 0.8
0.6
0.4 10
20
30
40 50 Traffic load (Erlang)
60
70
80
10
0.44
20
30
40 50 Traffic load (Erlang)
60
70
80
0.44 GRC Revenue to cost ratio
Revenue to cost ratio
R-Vine 0.42
0.4 GRC
D-Vine 0.42
0.4
R-Vine D-Vine 0.38
0.38 10
20
30
40 50 Traffic load (Erlang)
60
70
80
10
GRC
R-Vine
R-Vine
D-Vine 40
20
0
40 50 Traffic load (Erlang)
60
70
80
D-Vine 40
20
0 10
20
30
40 50 Traffic load (Erlang)
60
70
80
10
60
20
30
40 50 Traffic load (Erlang)
60
70
80
30
40 50 Traffic load (Erlang)
60
70
80
60 GRC
GRC
R-Vine
R-Vine
Average link utilization (%)
Average link utilization (%)
30
60 GRC Average node utilization (%)
Average node utilization (%)
60
20
D-Vine 40
20
0
D-Vine 40
20
0 10
20
30
40 50 Traffic load (Erlang)
60
70
80
10
20
Fig. 2. Performance of the algorithms using BCube(2, 4) (left column) and Fat-Tree6 (right column) substrate network topologies. Shown are acceptance ratio, revenue to cost ratio, and average node and link utilizations as functions of VNR traffic load. [13]
S. Zhang, Y. Qian, J. Wu, and S. Lu, “An opportunistic resource sharing and topology-aware mapping framework for virtual networks,” in Proc. IEEE INFOCOM, Orlando, FL, USA, Mar. 2012, pp. 2408–2416.
[14]
A. Fischer, J. F. Botero, M. T. Beck, H. de Meer, and X. Hesselbach, “Virtual network embedding: a survey,” IEEE Communications Surveys & Tutorials, vol. 15, no. 4, pp. 1888–1906, 2013.
[15]
C. Guo, H. Wu, K. Tan, L. Shi, Y. Zhang, and S. Lu, “DCell: a scalable and fault-tolerant network structure for data centers,” ACM SIGCOMM Comput. Commun. Rev., vol. 38, no. 4, pp. 75–86, Oct. 2008.
[16]
C. E. Leiserson, “Fat-Trees: universal networks for hardware-efficient supercomputing.” IEEE Trans. Comput., vol. 30, no. 10, pp. 892–901, Oct. 1985.
[17]
L. Saino, C. Cocora, and G. Pavlou, “A toolchain for simplifying network simulation setup,” in Proc. 6th Int. ICST Conf. Simulation Tools and Techniques, Cannes, France, Mar. 2013, pp. 82–91. [18] (2015, July) Boston university representative internet topology generator. [Online]. Available: http://www.cs.bu.edu/brite/. [19] B. M. Waxman, “Routing of multipoint connections,” IEEE J. Sel. Areas Commun., vol. 6, no. 9, pp. 1617–1622, Dec. 1988. [20] E. W. Zegura, K. L. Calvert, and M. J. Donahoo, “A quantitative comparison of graph-based models for Internet topology,” IIEEE/ACM Trans. Netw., vol. 5, no. 6, pp. 770–783, Dec. 1997.