TeraGrid 2007, Madison WI
VisPort: Web-Based Access to Community-Specific Visualization Functionality M. Pauline Baker, Randy Heiland, Edward Bachta, and Manirupa Das Abstract. The VisPort visualization portal is an experiment in providing Web-based access to visualization functionality from any place and at any time. VisPort adopts a service-oriented architecture to encapsulate visualization functionality and to support remote access. Users employ browser-based client applications to choose data and services, set parameters, and launch visualization jobs. Visualization products – typically images or movies – are viewed in the user’s standard Web browser. VisPort emphasizes visualization solutions customized for specific application communities. Finally, VisPort relies heavily on XML, and introduces the notion of visualization informatics – the formalization and specialization of information related to the process and products of visualization. Index Terms. Visualization informatics, visualization provenance, visualization metadata, remote visualization, interaction history, Web services.
___________________ ____________________
1
INTRODUCTION
Visualization has become an indispensable tool for many researchers in computational science. Numerous visualization tools have been developed for the desktop, offering a spectrum of visual representations for observed data and simulation output and accommodating a variety of file formats. Several tools have been developed with an emphasis on high-performance computing, utilizing distributed and parallel visualization algorithms and rendering schemes, such as ParaView [1], VisIt [2] and EnSight Gold [3]. As data sets have become larger and larger, high-performance computing centers have installed large-scale, special-purpose visualization engines at their sites. In similar spirit, but on a smaller scale, individual research teams and academic departments have installed their own clusters, outfitted for visualization work. In both cases, users have expressed needs for utilizing these resources from afar. The TeraGrid community has responded by producing tools supporting remote access, including the TeraGrid visualization portal TGViz [4] at Argonne National Labs (ANL) and the VisEnable system [5] at Texas Advanced Computing Center (TACC). 2
2.1
Service-Oriented Architecture
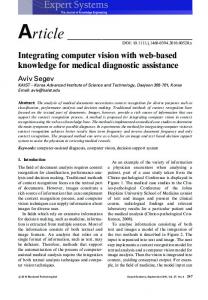
As shown in Figure 1, VisPort consists of (a) one or more service engines hosting visualization applications, (b) Webbased client applications, and (c) a server that acts as the entry point to the system, serving up the user interface applications and keeping records of user activity.
VISPORT
The VisPort visualization portal is an experiment in providing Web-based access to visualization functionality from any place and at any time [6]. VisPort adopts a service-oriented architecture to encapsulate visualization functionality and to support remote access. Users employ a browser-based client application to interact with the system, to set parameters and launch visualization jobs. Visualization
• • • • •
products – typically images or movies – are viewed in the user’s standard Web browser. VisPort seeks to provide visualization capability that is customized for specific communities, because customization is closely linked to ease of use. VisPort currently includes functionality that evolved from our collaborations with the Terascale Supernova Initiative (TSI, a SciDAC Phase 1 program), the Inverse Ocean Modeling group (IOM, an NSF ITR project), and the Linked Environments for Atmospheric Discovery (LEAD, also funded by NSF). Finally, VisPort introduces the notion of visualization informatics – the formalization and specialization of information related to the process and products of visualization.
M. Pauline Baker,
[email protected]. Randy Heiland,
[email protected]. Edward Bachta,
[email protected]. Manirupa Das,
[email protected]. All authors at Pervasive Technology Labs at Indiana University, IUPUI (Indiana University Purdue University Indianapolis)
Fig. 1. VisPort components. VisPort users access VisPort functionality through Web-based client interfaces.
VisPort services for data manipulation, analysis, and visualization generate output products and save them to the local file system of the machine hosting the service. A service might produce an alternate form of the data itself, but service products are more commonly of graphical form – imagery, movies, or geometry. VisPort’s services are wrapped as SOAP-based Web services. The current VisPort
TeraGrid 2007, Madison WI implementation includes two flavors of services: (1) C++ services, running on Windows and using .NET to host the service, and (2) Python services, running on Linux and using ZSI [7] and Twisted [8] to support Web services and hosting. All of the current VisPort visualization services rely on VTK [9] for visualization algorithms to convert data to graphical form. Services are written to accept a collection of input parameters and to output graphics, which might be one or more images, movies, and/or geometry sets. During the course of completing a job, a service saves its output products as files on the local file system. When a service is finished executing a SOAP request, a SOAP response message is sent back to the client to signify completion of the task. Once visualization functionality is encapsulated and wrapped as a Web service, clients can be written using any of the languages or tools that can issue SOAP requests. Because of its large installed base, cross-platform availability, support for SOAP-based Web services, rich feature set, and easy-to-use authoring environment, we chose Adobe’s Macromedia Flash for the current set of VisPort client applications. The user interface, shown in Figure 2, consists of an overall framework that supports browsing through data sets, exploring the services available for various data sets, reviewing the list of jobs that have been launched, and viewing visualization products from the current or previous user sessions. Also, in response to user choice about services to apply to a particular data set, the client application loads customized interface panels for manipulating the service parameters and sending a request to a service for activity. An example of a service interface panel is shown in Figure 3.
2.1.1 TeraGrid Connection VisPort includes a mechanism to make use of highperformance resources, especially Indiana University’s Big Red machine (512 IBM JS21 Blades, each with two dual-core PowerPC 970 processors and 8GB of memory, connected by PCI-X Myrinet 2000). Selected VisPort services, running on Globus-enabled hosts, act as a proxy and delegate their visualization tasks to companion visualization applications executing on Big Red. In this case, the proxy service handles the task of retrieving TeraGrid user credentials from the NCSA MyProxy Server. The proxy service forwards these credentials to Big Red as part of launching the job. The proxy service also retrieves the visualization application’s output products from Big Red and copies them to the proxy’s local file system, making these products available to the rest of the system.
Figure 3. A VisPort service panel. VisPort emphasizes simple user interfaces, customized for our applications researchers.
2.2
Figure 2. The VisPort interface. VisPort’s user interface, written in Macromedia Flash, supports browsing through data sets, services, jobs, products, and sessions.
Community-Specific Visualizations
It is not surprising that many of the most meaningful and effective visualizations result from longer-term partnerships between applications researchers and visualization specialists. Partnership participants each contribute unique and critical expertise and knowledge. As depicted in Figure 4, introductory conversations about the science, the data, and the questions under study are followed by an iterative cycle of generating and sharing custom visualizations, getting feedback, and modifying representations. Over time, visualizations that are especially effective for the particular application community are identified, refined and optimized. A significant step forward in the partnership occurs when these visualization techniques are embedded into scripts or tools for subsequent use by the applications researcher.
Baker et al., VisPort providing simple user interfaces makes visualization functionality accessible for new users of computational science techniques. Making visualization easy to use is one component of broadening participation for the HPC and TeraGrid communities. 2.3
Fig. 4. VisPort collaboration model. VisPort supports the collaborative partnership between application researchers and visualization specialists, and facilitates iterative development of visualizations customized for particular application communities.
It is also not surprising that end-users find customdesigned visualization tools easier to use than generalpurpose tools. General-purpose tools derive their power by providing enough options to handle a wide variety of data types, analysis tasks, and representations. But this often results in a complex user interface, where a great many choices must be made and parameters set before accomplishing the data analysis task. Custom-designed tools, on the other hand, can provide more limited, but targeted, functionality with much simpler user interfaces. VisPort is structured to emphasize community-specific and easy-to-use visualization. Users are registered as members of a particular community, and entry to the system is through a community-specific portal. During a VisPort session, a user has access to all the datasets that have been registered with VisPort for that community. The underlying service-based architecture is well-suited to developing a community-specific visualization portal. The service architecture encourages a clean separation between service functionality and the client user application. General-purpose back-end engines can be coupled with very simple, tailored user interfaces. 2.2.1 Custom Visualizations and TeraGrid Custom visualization solutions are especially important for high-performance computing. Almost by definition, HPC data sets are large. More important, HPC applications are cutting-edge computational science, perhaps generating simulation output at physical scales we have not dealt with before, or tackling multi-physics problems where traditional general-purpose visualization techniques might not apply. Additionally, HPC applications involve new levels of data complexity, such as in data assimilation applications involving real-time data observations and running simulations. While traditional visualization techniques are obviously still quite useful for these problems, the pioneering nature of HPC and TeraGrid computational science demands that attention also be given to advancing new custom approaches to data analysis and visualization. VisPort can also play a useful role in educating the next generations of TeraGrid users. VisPort’s emphasis on
Visualization Informatics
Recently, substantial effort has been directed towards defining metadata to describe observed data and simulation output. With XML as a supporting technology, these efforts have led to a large number of community-specific formalizations for describing data. There has been far less attention given to defining metadata related specifically to visualization, at either the process or product level. In VisPort, we introduce the notion of visualization informatics – the formalization and specialization of information related to the process and product of visualization. VisPort relies heavily on an underlying XML schema as a shared information base for the various components of the system. The VisPort schema introduces elements that (1) describe data at levels of abstraction that go beyond file formats, files, and runs; (2) describe the output products of visualization algorithms; and (3) capture the interaction history of a user with a visualization session. VisPort’s emphasis on visualization informatics is similar in spirit to some aspects of the more complete and formal visualization model reported in [10] and [11]. This body of work offers formal models of the visualization exploration process, to support encapsulation, sharing, and analysis of visual explorations. Strategies for recording and analyzing information about data visualization sessions are also the topic in [12], where the focus is on capturing details about user interaction related to the knowledge discovery process, along with user-defined annotations of those details. Finally, VisTrails [13] concentrates on formalizing the visualization pipeline itself, and separating the pipeline from instances of execution, with special emphasis on reusing and optimizing visualization pipelines. 2.3.1 VisPort Data Description Schema Application scientists and visualization specialists have been aided for the last 2 decades by the existence of standardized data file formats such as HDF and NetCDF. However, these are file formats; higher levels of data organization are still left up to computational researchers, who make different choices about storing variables and timesteps in single or multiple files. The VisPort information schema introduces data description techniques for describing simulation output, independent of file format and storage strategy (currently limited to gridded data, but extensible to other forms). Further, the schema accommodates output from multiple same-grid simulation runs, treating (for example) an ensemble study of several runs as a collection of related, same-structure simulation outputs. In this case, run number is simply a higher-level dimension of the data space. As shown below, the VisPort information schema includes tags to describe coordinates and to combine coordinates to define grid shapes. Additional attributes and/or sub-elements of the Coordinates tag are available to
TeraGrid 2007, Madison WI specify more detail about a coordinate, including its label, units of measurement, data type, and spacing information (regular or rectilinear) – these details are omitted here for simplicity. The simulation variables populating the computational grid are described by Variable tags. Variables can be described as scalars, or as components of a named vector field. Note that these tags are designed to describe a data set in abstract terms, with no reference to file format or storage strategy. Mapping from the abstract dataset description to the file system is handled in the Location tag. The Location tag includes an explicit specification of file format, as well as a template string for file locations. The Location element’s children supply information about how substitutions should be made into the file location string to generate the name of a specific file. For example, the XML fragment below describes simulation output from an ensemble of 36 runs, where each run computed a scalar field QRAIN and a vector field Wind on a 240 x 160 grid and saved these variables to a separate file for each of 180 timesteps.
noted above, it lets us customize the user interface elements in VisPort. Such customized interfaces are almost always easier to use and more resistant to user error. Further, the data description exists separate from the data itself. This means that user interface design and development activities can proceed in advance of data availability, or with languages and tools (such as Flash) that might not be suited for reading scientific data, even in standard file formats. Next, the data descriptor expresses an abstract model of the data set, without regard to file format or storage strategy. Data manipulation, analysis, and visualization services can be built to this abstract data model, relying on lower-level format-specific file readers for data reading. Finally, the abstract data model accommodates multiple runs of the same simulation code, such as we might find in an ensemble study. This strategy lets us treat run number (for example) as simply another dimension. For example, a generalpurpose color-mapped slice service could be used to produce images that show QRAIN from the final time-step of every run in the 36-run ensemble. 2.3.2 Visualization Products Schema
In VisPort, a data description XML file is available for each of the data sets known to the system. On the user interface side, the data descriptor is used to customize the interface widgets. For example, a region of interest selector widget can be limited to start and end values that match the shape of the data, and drop down menus for variable selection can be limited to a list of scalar variables, or vector variables, as appropriate. On the services side, the data descriptor XML is passed as an argument to VisPort routines for data manipulation, data analysis, and/or visualization. A set of supporting data ingestion classes exists to parse the data descriptor XML, generate file paths, create the appropriate data readers, read the data, and (if requested) map the data to VTK data structures. The use of a data descriptor tailored for visualization purposes has proven useful in a number of ways. First, as
Visualization imagery is only useful if information is available about the data set depicted, the algorithms used to map data to visual form, and the settings of relevant parameters. In short, understanding a visualization product depends on knowing the provenance of the visualization – the history of its production and any subsequent modifications. In the current practice of visualization production, there is no standardized way to capture and record provenance of our products. In current practice, we tend to rely on clever file-naming schemes, or on the labeling and annotation that is embedded in the visual image, usually at the time of rendering. VisPort takes a significant step forward by insuring that provenance information is available for any visualization product. The client application and the services themselves each contribute information that is added to the provenance record. The VisPort client application captures parameter settings for visualization jobs as they are launched, recording this information according to tags defined in the VisPort information schema. Services record information about their output products in a Product Log, again conforming to the VisPort information schema for visualization products. The product schema includes tags for Images, Movies, and Geometry. An Info tag is also available to capture additional information. For example, the Color-Mapped Slice service outputs images (or movies), accompanied by an Info tag that notes the minimum and maximum values found in the data. Any number of applications could be developed for viewing VisPort visualizations. Currently, VisPort uses the session and product log XML records and an XSL transformation to produce an HTML Web page viewable in any browser. The provenance information for visualizations is included with the visualization in the page, as shown in Figure 5.
Baker et al., VisPort
Fig. 5. VisPort output. VisPort visualizations are shown with information about the data, services, methods, and parameters used in their production. Images are scaled in the browser page, with links to the full-size version.
3
SUMMARY
The VisPort framework offers an infrastructure for Webbased access to remote visualization functionality, tailored for specific application communities. Within the context of this infrastructure development, we introduce the notion of visualization informatics, including a schema to support a high-level data abstraction model for gridded data, methods for capturing the provenance of visualization products, and techniques for capturing the interaction history of a user during a visualization session. In future work, we will expand the number of services offered to support additional representations. Further, we are considering the design of services to automate transfer of data from one site to another. We are also especially interested in increasing VisPort’s reach and in working with new application communities on the use of VisPort. ACKNOWLEDGEMENTS This work is supported by an award from the National Science Foundation Division of Ocean Sciences (0341139), and by a SciDAC grant from the U.S. Department of Energy programs in High Energy Physics, Nuclear Physics, and Advanced Scientific Computing Research (DE-FC02-03ER41275). We are grateful also to our application partners, especially Doug Swesty, Eric Myra, and Tony Mezzacappa; Brian Jewett and Bob Wilhelmson; Andrew Bennett and Boon Chua.
REFERENCES [1] ParaView, www.paraview.org. [2] VisIt, www.llnl.gov/visit/.
[3] EnSight, www.ensight.com. [4] TeraGrid Visualization Gateway, Argonne National Labs, www.teragrid.org/programs/sci_gateways/projects.php. [5] D. Guzman, G. Johnson, and P. Shanmugam, "VisEnable: A User Friendly and Extensible System for Remote Visualization", TeraGrid 2006, Indianapolis IN, June 2006. [6] VisPort, vis.iu.edu/VisPort. [7] ZSI: The Zolera Soap Infrastructure, pywebsvcs.sourceforge.net/zsi.html. [8] Twisted, twistedmatrix.com/trac/. [9] The Visualization ToolKit, www.kitware.org. [10] T.J. Jankun-Kelly, Oliver Kreylos, Kwan-Liu Ma, Bernd Hamann, Kenneth I. Joy, John Shalf, and E. Wes Bethel, "Deploying Web-based Visual Exploration Tools on the Grid," IEEE Computer Graphics and Applications, vol. 23(3), pp. 44-50, 2003. [11] T. J. Jankun-Kelly, Kwan-Liu Ma, and Michael Gertz, "A Model and Framework for Visualization Exploration," IEEE Transactions on Visualization and Computer Graphics, to appear, 2007. [12] Dennis P. Groth and Benjamin W. Murphy, "Tracking User Interactions with Visualizations," in IEEE Symposium on Information Visualization, Austin TX, October 2004. [13] Louis Bavoil, Steven P. Callahan, Patricia J. Crossno, Juliana Freire, Carlos E. Scheidegger, Claudio T. Silva, and Huy T. Vo, "VisTrails: Enabling Interactive Multiple-View Visualizations," in IEEE Visualization, Minneapolis MN, October 2005.