sensors Article
Visual and Plasmon Resonance Absorption Sensor for Adenosine Triphosphate Based on the High Affinity between Phosphate and Zr(IV) Wenjing Qi 1,2, *, Zhongyuan Liu 1 , Wei Zhang 1 , Mohamed Ibrahim Halawa 1,3 and Guobao Xu 1, * 1
2 3
*
State Key Laboratory of Electroanalytical Chemistry, Changchun Institute of Applied Chemistry, Chinese Academy of Sciences, Changchun 130022, China;
[email protected] (Z.L.);
[email protected] (W.Z.);
[email protected] (M.I.H.) Chongqing Key Laboratory of Green Synthesis and Applications, College of Chemistry, Chongqing Normal University, Chongqing 401331, China Chinese Academy of Sciences, University of Chinese Academy of Sciences, No. 19A Yuquanlu, Beijing 100049, China Correspondence:
[email protected] (W.Q.);
[email protected] (G.X.); Tel.: +86-431-8526-2747 (G.X.)
Academic Editor: Huangxian Ju Received: 5 August 2016; Accepted: 29 September 2016; Published: 12 October 2016
Abstract: Zr(IV) can form phosphate and Zr(IV) (–PO3 2− –Zr4+ –) complex owing to the high affinity between Zr(IV) with phosphate. Zr(IV) can induce the aggregation of gold nanoparticles (AuNPs), while adenosine triphosphate(ATP) can prevent Zr(IV)-induced aggregation of AuNPs. Herein, a visual and plasmon resonance absorption (PRA)sensor for ATP have been developed using AuNPs based on the high affinity between Zr(IV)with ATP. AuNPs get aggregated in the presence of certain concentrations of Zr(IV). After the addition of ATP, ATP reacts with Zr(IV) and prevents AuNPs from aggregation, enabling the detection of ATP. Because of the fast interaction of ATP with Zr(IV), ATP can be detected with a detection limit of 0.5 µM within 2 min by the naked eye. Moreover, ATP can be detected by the PRA technique with higher sensitivity. The A520nm /A650nm values in PRA spectra increase linearly with the concentrations of ATP from 0.1 µM to 15 µM (r = 0.9945) with a detection limit of 28 nM. The proposed visual and PRA sensor exhibit good selectivity against adenosine, adenosine monophosphate, guanosine triphosphate, cytidine triphosphate and uridine triphosphate. The recoveries for the analysis of ATP in synthetic samples range from 95.3% to 102.0%. Therefore, the proposed novel sensor for ATP is promising for real-time or on-site detection of ATP. Keywords: gold nanoparticles; adenosine triphosphate; plasmon resonance absorption; sensor
1. Introduction Adenosine triphosphate (ATP), as cellular energy currency in living cells, is one of the most important small-molecule signaling agents [1–5]. It is an indicator for cell viability and cell injury and plays an important role in many biological processes such as the regulation of cellular metabolism and biochemical pathways in cell physiology. Intracellular ATP levels are related to many diseases, such as hypoxia, hypoglycemia, ischemia, Parkinson’s disease, and some tumors [6–8]. Moreover, the measurements of the concentrations of ATP in real samples are required for bacteria detection in food and agricultural chemistry to prevent food-borne illnesses and in the health sciences [4]. Therefore, exploring methods for sensitive and selective determination of ATP is of great importance in biochemical analysis and clinical diagnoses. Up to now, different methods have been used for the detection of ATP, such as electrochemiluminescence [9–13], electrochemistry [5,14–18], fluorescence [19–22], and localized surface plasmon resonance [1]. Most of these strategies need the Sensors 2016, 16, 1674; doi:10.3390/s16101674
www.mdpi.com/journal/sensors
Sensors 2016, 16, 1674 Sensors 2016, 16, 1674
2 of 11 2 of 11
participation of enzymes or aptamers. They usually need half an hour or even longer for the reaction [5,14–18], [19–22], and localized surfaceMeanwhile, plasmon resonance of these strategies between ATPfluorescence and its aptamer or enzymatic reaction. enzymes[1]. orMost aptamers as biochemical need the participation of enzymes or aptamers. They usually need half an hour or even longer for of reagents need some special storage methods. Both of them limit the fast response in the analysis the reaction between ATP and its aptamer or enzymatic reaction. Meanwhile, enzymes or aptamers ATP. To some extent, some sensitive and selective sensors for ATP without the need of enzymes or as biochemical reagentsavailable need some special storage methods. Both of them limit the fast response in aptamers are potentially in real-time or on-site detection. the analysis of ATP. To some extent, some sensitive and selective sensors for ATP without the need Owing to the different color changes and plasmon resonance absorption (PRA) properties between of enzymes or aptamers are potentially available in real-time or on-site detection. dispersed and aggregated AuNPs, AuNPs (mostly 13 nm AuNPs synthesized by trisodium citrate) Owing to the different color changes and plasmon resonance absorption (PRA) properties have been widely employed in developing visual and PRA chemical and biological sensors for between dispersed and aggregated AuNPs, AuNPs (mostly 13 nm AuNPs synthesized by metal ions (such as Hg(II), As(III), Cu(II)), biochemical small molecules (such as ATP, dopamine), trisodium citrate) have been widely employed in developing visual and PRA chemical and DNA and proteins [1,23–36]. The reported visual and PRA sensors for ATP usually need aptamers. biological sensors for metal ions (such as Hg(II), As(III), Cu(II)), biochemical small molecules (such Theasmain of ATP sensors relies on[1,23–36]. the changes aptamers change into asensors G-quartet ATP,principle dopamine), DNA and proteins Thethat reported visual and PRA for folding ATP structure after aptamers react with ATP. Since it usually takes a long incubation time (usually half usually need aptamers. The main principle of ATP sensors relies on the changes that aptamers an change hour) for the formation of the aptamer and ATP complex, the ATP sensors free from aptamers into a G-quartet folding structure after aptamers react with ATP. Since it usually takes a with a fast response within several good alternatives. Using AuNPs long incubation time (usually half seconds an hour) would for the be formation of the aptamer andunmodified ATP complex, the (13ATP nm),sensors Deng developed a simple and fast method for ATP detection free from aptamers based free from aptamers with a fast response within several seconds would be good 2+ -induced cross-linking on alternatives. the high adsorption affinity of ATP (13 on nm), the surface of AuNPs and Cuand Using unmodified AuNPs Deng developed a simple fast method for ATP 2+ aggregation [32].from In their report, Cuon forms a dimeric [Cuaffinity complex with ATPoftoAuNPs achieve detection free aptamers based the high adsorption of2 ATP on the surface 2 (ATP)] and Cu2+-induced cross-linking aggregationmethod [32]. In their report, Cu2+ forms dimeric [Cu2(ATP)] 2 aggregation. Liu reported a colorimetric for ATP detection freea from aptamers using complex with ATP(13 tonm) achieve Liu reported a colorimetric for ATP detection unmodified AuNPs [31].aggregation. It is a responsive disassembly of AuNPmethod aggregates triggered by the free from aptamers using unmodified AuNPs (13 nm) sensing. [31]. It is In a responsive disassembly of AuNP competitive adsorption for lighting up the colorimetric the presence of melamine, AuNPs triggered by the competitive adsorption forhas lighting the colorimetric In of thethe canaggregates form aggregates. However, since the ATP molecule higherup adsorption affinitysensing. than that presence of melamine, AuNPs can form aggregates. However, since the ATP molecule has higher melamine on the surface of AuNPs, AuNPs get dispersed on the basis of the competitive adsorption adsorption affinity than enabling that of thethe melamine on the surface after the addition of ATP, determination of ATP.of AuNPs, AuNPs get dispersed on the basis of the competitive adsorption the(–PO addition enabling the determination of ATP. 4+ 2− of ATP, Zr(IV) can form phosphate andafter Zr(IV) 3 –Zr –) owing to the high affinity between the Zr(IV) can form phosphate and Zr(IV) (–PO32−–Zr4+–) owing to the high affinity between the Zr(IV) and phosphate. This special property between Zr(IV) and phosphate has been mostly utilized in Zr(IV) and phosphate. This special property between Zr(IV) and phosphate has been mostly the immobilization of phosphopeptides and phosphate-functionalized DNA or as linkers for peptide utilized in the immobilization of phosphopeptides and phosphate-functionalized DNA or as linkers and enzyme conjugates [37–39]. Inspired by these reports, we utilize the high affinity of Zr(IV) and for peptide and enzyme conjugates[37–39]. Inspired by these reports, we utilize the high affinity of phosphate in developing a new visual sensor for ATP without the need of aptamers in this study Zr(IV) and phosphate in developing a new visual sensor for ATP without the need of aptamers in since ATP has phosphate groups. As shown in Scheme 1, Zr(IV) can make well-dispersed AuNP this study since ATP has phosphate groups. As shown in Scheme 1, Zr(IV) can make well-dispersed aggregates. ATP with ATP a phosphate has high affinity withaffinity Zr(IV) and formand phosphate and AuNP aggregates. with a group phosphate group has high withcan Zr(IV) can form 2− –Zr4+ –) with Zr(IV). As a result, the novel visual and PRA sensor for ATP is designed Zr(IV) (–PO phosphate3 and Zr(IV) (–PO32−–Zr4+–) with Zr(IV). As a result, the novel visual and PRA sensor for using on theusing basisAuNPs of dispersed aggregated states AuNPs. It states is the first investigation ATPAuNPs is designed on theand basis of dispersed andofaggregated of AuNPs. It is thefor ATP detection using the high affinity between phosphate and Zr(IV). Compared with other reports, first investigation for ATP detection using the high affinity between phosphate and Zr(IV). theCompared proposed sensor for ATP using AuNPs is sensitive, simple and fast within 2 min. More importantly, with other reports, the proposed sensor for ATP using AuNPs is sensitive, simple and thefast proposed the participation of inorganic ionsneeds Zr(IV)the without the need aptamers, within sensor 2 min. only Moreneeds importantly, the proposed sensor only participation of of inorganic which incubating timeofofaptamers, ATP withwhich its aptamer andincubating cost. It is available for real-time or on-site ionssaves Zr(IV)the without the need saves the time of ATP with its aptamer and cost. It is available for real-time or on-site detection of ATP. detection of ATP.
Scheme 1. Schematic illustration of visual and PRA sensor for ATP based on the high affinity Scheme 1. Schematic illustration of visual and PRA sensor for ATP based on the high affinity between between phosphate and Zr(IV). phosphate and Zr(IV).
Sensors 2016, 16, 1674
3 of 11
2. Materials and Methods 2.1. Materials and Reagents ATP disodium salt hydrate, adenosine, adenosine diphosphate (ADP), adenosine monophosphate (AMP), guanosine triphosphate (GTP), cytidine triphosphate (CTP) and uridinetriphosphate (UTP) were purchased from Sigma-Aldrich. Zirconium acetate (C2 H4 O4 Zr) was purchased from Aladdin (Beijing, China). Tetrachloroaurate (III) tetrahydrate (HAuCl4 ·4H2 O) and trisodium citrate (Na3 C6 H5 O7 ·2H2 O) were purchased from Sinopharm Chemical Reagent Co., Ltd. (Shanghai, China). Other chemicals were of analytical-reagent grade and used as received. All solutions were prepared with doubly distilled water. 2.2. Apparatus Plasmon resonance absorption (PRA) spectra were measured using a UNICO UV/VIS2802PC spectrophotometer. Transmission electron microscopy (TEM) images were obtained by a Hitachi H600 transmission electron microscope operated at 100 kV. AuNPs samples for TEM measurements were prepared by placing a drop of colloidal solution on carbon-coated copper grid and then dried at room temperature. A WH-3 miniature vortex mixed instrument (Shanghai Hu Xi Analysis Instrument Factory Co., Ltd, Shanghai, China) was used to mix the samples thoroughly. 2.3. The Preparation of AuNPs AuNPs were prepared similarly with our previous reports [40,41] by reducing HAuCl4 with citrate sodium, which acts as both reducing agent and stabilizer. Doubly distilled water (48 mL) and HAuCl4 (1%, 2 mL) with final concentration of 1 mM were firstly added in a flask. Then the mixture was stirred and heated to be boiling. Then trisodium citrate (5%, 1 mL) was added to the flask by keeping boiling. The solution changes from pale yellow to deep red within 3 min. After boiling for another 5 min, the solution was cooled to room temperature under magnetic stirring. At last, AuNPs was stored in a refrigerator (4 ◦ C). The approximate concentrations of AuNPs (about 13 nm) are calculated according to previous reports [40,41]. 2.4. General Procedures of ATP Detection Tris-HCl buffer solutions (pH 7.4, 100 µL), Zr(IV) (10 µM) and different concentrations of ATP were firstly pipetted into a 1.0 mL plastic tube. The mixture was vortex-mixed and kept at room temperature for 10 min. Then AuNPs (100 µL), appropriate volume of water and NaCl solutions with the final concentration of 30 mM (to control the medium ionic strength of the system) were added. The whole mixture was vortex-mixed thoroughly, kept at room temperature for another 2 min and transferred for PRA spectra measurements. 2.5. ATP Detection in Synthetic Mixture ATP (1, 5 and 10 µM) was respectively added to synthetic mixtures containing adenosine, ADP, AMP, GTP, CTP and UTP. Then tris-HCl buffer solutions (pH 7.4, 100 µL) and Zr(IV) (10 µM) were added. Then AuNPs were added and NaCl (30 mM) was added at last. The whole solutions were vortex-mixed thoroughly, kept at room temperature for another 2 min and transferred for PRA spectra measurements. 3. Results and Discussions 3.1. State of AuNPswith ATP in the Presence of Zr(IV) Figure 1 shows that the PRA spectrum of the as-prepared AuNPs has a characteristic peak at 520 nm, indicating that AuNPs are well-dispersed in no presence of 30 mM NaCl. Under the fixed ionic strength of 30 mM, AuNPs are still in the dispersed state after the addition of 10 µM ATP,
Sensors 2016, 16, 1674 Sensors Sensors 2016, 2016, 16, 16, 1674 1674
4 of 11 44 of of 11 11
which can be identified by the characteristic peak at 520 nm. It suggests that ATP can adsorb onto surface AuNPs and keep state. However, as in 1, thethe surface AuNPsin thedispersed dispersed state. However, as shown in Figure the surfaceofof ofAuNPs AuNPsand and keep keep AuNPs AuNPs ininthe the dispersed state. However, as shown shown in Figure Figure 1, the the 1, absorption peak at 520 nm decreases and a higher absorption peak at 700 nm emerges in the peak at at 700 nm emerges in in thethe theabsorption absorptionpeak peakatat520 520nm nmdecreases decreasesand anda ahigher higherabsorption absorption peak 700 nm emerges presence of μM). It AuNPs aggregated in presence of presence of Zr(IV) Zr(IV) (10 μM). It indicates indicates that AuNPs get aggregated in the the presence of Zr(IV) Zr(IV) (10 presence of Zr(IV) (10(10 µM). It indicates thatthat AuNPs getget aggregated in the presence of Zr(IV) (10(10 µM). μM). In of Zr(IV) the at nm is μM). In the the presence presence of both both(10 Zr(IV) (10 μM) and ATP (10 μM), the absorption absorption peak at 520 520 nmhigh is still still In the presence of both Zr(IV) µM)(10 andμM) ATPand (10ATP µM),(10 theμM), absorption peak atpeak 520 nm is still and high and only aa much lower absorption peak at 650 nm emerges. It suggests that ATP can high and only much lower absorption peak at 650 nm emerges. It suggests that ATP can only a much lower absorption peak at 650 nm emerges. It suggests that ATP can effectively prevent effectively Zr(IV)-induced aggregation effectively prevent prevent Zr(IV)-induced aggregation of of AuNPs. AuNPs. Zr(IV)-induced aggregation of AuNPs.
Figure 1. spectra AuNPs in different solutions. curve represents PRA spectra of Figure 1. Absorption Absorptionspectra spectraofof ofAuNPs AuNPsin indifferent different solutions. solutions. Black Black spectra of of Figure 1. Absorption Blackcurve curverepresents representsPRA PRA spectra the as-prepared AuNPs solution (no NaCl); Red curve represents PRA spectra of AuNPs with ATP the as-prepared AuNPs solution (no NaCl); Red curve represents PRA spectra of AuNPs with ATP the as-prepared AuNPs solution (no NaCl); Red curve represents PRA spectra of AuNPs with ATP (30 mM NaCl); Green curve represents PRA spectra of with Zr(IV) (30 NaCl); Blue NaCl); Green curve represents PRA spectra of AuNPs AuNPs Zr(IV) (30 mM mM NaCl); (30(30 mMmM NaCl); Green curve represents PRA spectra of AuNPs withwith Zr(IV) (30 mM NaCl); BlueBlue curve curve represents PRA spectra of AuNPs with ATP and Zr(IV) (30 mM NaCl). c(ATP): 10.0 μM; curve represents PRA of spectra of with AuNPs with and(30 Zr(IV) mM c(ATP): NaCl). c(ATP): μM; represents PRA spectra AuNPs ATP andATP Zr(IV) mM (30 NaCl). 10.0 µM;10.0 c(Zr(IV)): c(Zr(IV)): c(Zr(IV)): 10.0 10.0 μM. μM. 10.0 µM.
3.2. 3.2. Kinetic Kinetic Behavior Behavior of of PRA PRA Sensor Sensor for for ATP ATP 3.2. Kinetic Behavior of PRA Sensor for ATP Figure Figure 22 shows shows the the kinetic kinetic behavior behavior of of the the PRA PRA sensor sensor for for ATP. ATP. After After the the addition addition of of Zr(IV), Zr(IV), Figureget 2 shows the kinetic behavior ofA520nm the /A PRA sensor for ATP. After the addition of Zr(IV), AuNPs aggregated immediately. The 650nm values in the PRA spectra of AuNPsin the AuNPs get aggregated immediately. The A520nm/A650nm values in the PRA spectra of AuNPsin the AuNPs get aggregated immediately. The A520nmof/A values in the PRA spectra of AuNPsin the presence min. presence of of Zr(IV) Zr(IV) keep keep stable stable during during aa period period of 20 20650nm min. To To achieve achieve the the proposed proposed sensor sensor for for ATP, ATP, 2− 4+ presence of Zr(IV) keep stable during a period of 20 min. To achieve the proposed sensor for ATP, ATP ATP ATP is is first first added added to to react react with with Zr(IV) Zr(IV) to to form form phosphate phosphate and and Zr(IV) Zr(IV) (–PO (–PO332−–Zr –Zr4+–), –), and and then then 2− –Zr4+ –), and then AuNPs is first added to react with Zr(IV) to form phosphate and Zr(IV) (–PO AuNPs are added. Zr(IV)-induced aggregation of AuNPs is effectively prevented, enabling 3 AuNPs are added. Zr(IV)-induced aggregation of AuNPs is effectively prevented, enabling the the aredetection added. Zr(IV)-induced of AuNPs is effectively the detection of 520nm/A650nm values of AuNPs keep atprevented, stable andenabling high values from the of detection of ATP. ATP. The The A Aaggregation 520nm/A650nm values of AuNPs keep at stable and high values from the beginning (within 22 min) to min. PRA that Zr(IV)-induced aggregation of ATP. The A520nm /A650nm values AuNPs keep atindicate stable and values from the beginning (within beginning (within min) to 20 20 of min. PRA results results indicate that high Zr(IV)-induced aggregation of AuNPs AuNPs is stable and the detection of ATP is a fast process. The fast response is attributed to the fast 2 min) to 20and min.the PRA resultsof indicate Zr(IV)-induced is stable is stable detection ATP isthat a fast process. The aggregation fast responseofisAuNPs attributed to theand fastthe interaction of and [37,39].The fast response forreal-time on-site detection of ATP is a fast process. The fast response is attributed the fast interaction interaction of phosphate phosphate and Zr(IV) Zr(IV) [37,39].The fast response is istofavorable favorable forreal-timeofor orphosphate on-site detection of achieve reliable and PRA for detection, and Zr(IV) [37,39].The response is favorable forreal-time or on-site of the ATP.optimized To achieve detection of ATP. ATP. To Tofast achieve reliable and stable stable PRA signals signals for ATP ATPdetection detection, the optimized detection time is kept at 2 min. detection is PRA kept at 2 min.for ATP detection, the optimized detection time is kept at 2 min. reliable and time stable signals
Figure Kinetic behaviors sensor for ATP. Time (min): immediately, 2, 15, c(ATP, Figure 2.Kinetic Kinetic behaviors behaviors of ofofPRA PRA sensor forfor ATP. Time (min): immediately, 2, 4, 4, 8, 8, 10, 10, 15,8,20; 20;10, c(ATP, Figure 2. 2. PRA sensor ATP. Time (min): immediately, 2, 4, 15, 20; μM): 10; c(Zr(IV)): 10.0 μM. Black curve represents PRA spectra of AuNPs with Zr(IV); Red curve μM):µM): 10; c(Zr(IV)): 10.0 μM. curve curve represents PRA spectra of AuNPs with Zr(IV); curve c(ATP, 10; c(Zr(IV)): 10.0Black µM. Black represents PRA spectra of AuNPs with Red Zr(IV); Red represents PRA spectra of with and represents PRAPRA spectra of AuNPs AuNPs with Zr(IV) Zr(IV) and ATP. ATP. curve represents spectra of AuNPs with Zr(IV) and ATP.
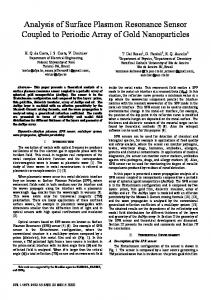
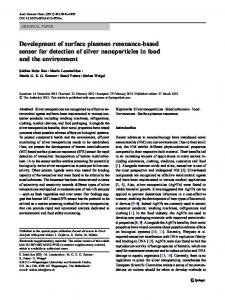
3.3. Visual Sensor for ATP Due to the unique size-dependent optical properties of AuNPs, the color of dispersed AuNPs Due to the unique size-dependent optical properties of AuNPs, the color of dispersed AuNPs is usually red and while the color of the aggregated AuNPs is purple and even blue, which depends is usually red and while the color of the aggregated AuNPs is purple and even blue, which depends on the size of the aggregated AuNPs. As shown in Figure 3, the concentrations of ATP change from on the size of the aggregated AuNPs. As shown in Figure 3, the concentrations of ATP change from 0.5 to 10.0 μM in the fixed Zr(IV) (10 μM) condition;the color changes of the AuNP system from 0.5 to 2016, 10.0 16, μM in the fixed Zr(IV) (10 μM) condition;the color changes of the AuNP system 5from Sensors 1674 of 11 blue to red happen at the same time. Though the limit of detection (LOD) of 0.5 μM appears blue to red happen at the same time. Though the limit of detection (LOD) of 0.5 μM appears relatively high, it is in accordance with that of normal colorimetric or visual detections [32,34–36,42]. relatively high, it is in accordance with that of normal colorimetric or visual detections [32,34–36,42]. Since visual detections advantages of simplicity and fast response, they are mostly applied in 3.3. Visual Sensor for ATPhave Since visual detections have advantages of simplicity and fast response, they are mostly applied in fast on-site detection. More accurate detection results can be obtained by sophisticated equipment fast on-site accurate detection results canofbe obtained sophisticated equipment to detection. the uniqueMore size-dependent optical The properties AuNPs, the by color of dispersed AuNPs is (suchDue as PRA detection as mentioned below). aggregated and dispersed state is also confirmed (such asred PRA detection ascolor mentioned below). TheAuNPs aggregated and and dispersed statewhich is alsodepends confirmed usually and while the of the aggregated is purple even blue, on by TEM measurements. As shown in Figure 4, AuNPs alone are dispersed (Figure 4A). After the by TEM measurements. As shown in Figure 4, AuNPs alone are dispersed (Figure 4A). After the the size ofofthe aggregated shown ininFigure 3, the and concentrations of ATP change 0.5 to addition ATP, AuNPs AuNPs. are still As dispersed the AuNP ATP system (Figure 4B). from However, addition ofthe ATP, AuNPs are still dispersed in the AuNP andof ATP system (Figurefrom 4B).blue However, 10.0 µM in fixed Zr(IV) (10 µM) condition;the color changes the AuNP system to AuNPs get greatly aggregated in the AuNP and Zr(IV) system(Figure 4C). AuNPs are dispersedred in AuNPs getthe greatly aggregated inthe thelimit AuNP and Zr(IV) system(Figure 4C). AuNPs are dispersed happen at same time. Though of detection 0.5 µM appears relatively high, it is in in the AuNPs, ATP and Zr(IV)ATP system (Figure 4D). (LOD) Herein,ofboth TEM and color changes confirm the AuNPs, ATP and Zr(IV)ATP system (Figure 4D). Herein, both TEM and color changes confirm accordance with thatproposed of normalvisual colorimetric detections [32,34–36,42]. Since visual detections the feasibility of the sensor or forvisual ATP using AuNPs. the feasibility of the proposed visual sensor for ATP using AuNPs. have advantages of simplicity and fast response, they are mostly applied fast on-site We also tested the mechanism of visual detection by changing the in adding orders.detection. By first We also tested the results mechanism ofobtained visual detection by changing the adding orders.detection By first More accurate detection can be by sophisticated equipment (such as adding ATP to AuNPs to enable ATP-AuNP binding, AuNPs get dispersed, and thenPRA when adding adding ATP to AuNPs to enable ATP-AuNP binding, AuNPs get dispersed, and then when adding as mentioned below). aggregated dispersed state isused also in confirmed by TEM measurements. the Zr(IV), AuNPs getThe aggregated. It and is the adding order our previous results for Zr(IV) the Zr(IV), AuNPs get aggregated. It is the adding order used in our previous results for Zr(IV) As shown ([41]). in Figure AuNPs aloneZr(IV) are dispersed (Figure 4A). After the addition of ATP, AuNPs detection By4,first adding to AuNPs to enable aggregation, then adding ATPare to detection ([41]). By AuNP first adding Zr(IV) to (Figure AuNPs4B). to However, enable aggregation, then adding ATP in to still dispersed in the and system get is greatly aggregated sequester Zr(IV), AuNPs can getATP dispersed. However, the extent ofAuNPs dispersed not better than that sequester Zr(IV), AuNPs can get dispersed. However, the extent of dispersed is not better than that the AuNPby and Zr(IV) system (Figure 4C). and AuNPs dispersed in the AuNPs, ATP and To Zr(IV)ATP achieved first adding Zr(IV) and ATP thenare adding AuNPs in the present work. achieve achieved by first adding Zr(IV) and ATP and then adding AuNPs in the present work. To achieve system (Figure 4D). Herein, both TEM and color changes confirm the feasibility of the proposed visual the great color changes of AuNPs (the maximum background: signal ratio for ATP detection), we the great color changes of AuNPs (the maximum background: signal ratio for ATP detection), we sensor for using AuNPs. achieve theATP well-dispersed of AuNPs by first adding Zr(IV) and ATP and then adding AuNPs. achieve the well-dispersed of AuNPs by first adding Zr(IV) and ATP and then adding AuNPs.
Figure 3. Photographsof ATP detection in the presence of Zr(IV). c(ATP, μM) from sample (a–d): 0, Figure 3. c(ATP, µM) from sample (a–d): 0, 0.5, Figure 3. Photographsof Photographsof ATP ATPdetection detectionininthe thepresence presenceofofZr(IV). Zr(IV). c(ATP, μM) from sample (a–d): 0, 0.5, 5.0, 10.0; c(Zr(IV)): 10.0 μM. 5.0, 10.0; c(Zr(IV)): 10.0 µM. 0.5, 5.0, 10.0; c(Zr(IV)): 10.0 μM.
Figure 4. TEMimages of AuNPs alone (A); AuNPs with ATP (B); AuNPs with Zr(IV) (C); and Figure 4. TEMimages TEMimagesofofAuNPs AuNPs alone AuNPs with (B); AuNPs with Zr(IV) (C); and Figure 4. (A);(A); AuNPs with ATP ATP (B); AuNPs with Zr(IV) and ATP (D).alone c(Zr(IV)): 10.0 μM; c(ATP): 10.0AuNPs μM. with Zr(IV) (C); and AuNPs AuNPs with Zr(IV) and ATP (D). c(Zr(IV)): 10.0 μM; c(ATP): 10.0 μM. with Zr(IV) and ATP (D). c(Zr(IV)): 10.0 µM; c(ATP): 10.0 µM.
We also tested the mechanism of visual detection by changing the adding orders. By first adding ATP to AuNPs to enable ATP-AuNP binding, AuNPs get dispersed, and then when adding the Zr(IV), AuNPs get aggregated. It is the adding order used in our previous results for Zr(IV) detection ([41]). By first adding Zr(IV) to AuNPs to enable aggregation, then adding ATP to sequester Zr(IV), AuNPs can get dispersed. However, the extent of dispersed is not better than that achieved by first adding Zr(IV) and ATP and then adding AuNPs in the present work. To achieve the great color changes of
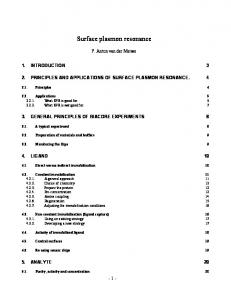
be seen that the values of A520nm/A650nm increase linearly with the concentrations of ATP from 0.1 μM to 15 μM (r = 0.9945). The LOD is 28 nM, which is much lower than that of most other reports (Table 1). The LOD is calculated on the basis of the standard deviation (SD) of the blank measurements and the slope of the calibration curve (S) (limit of detection = 3SD/S) [41,43]. The LOD is comparable to some reports; the proposed sensor for ATP using AuNPs is simple and fast within 2 min. More Sensors 2016, 16, 1674 6 of 11 importantly, the proposed sensor only needs the participation of inorganic ions of Zr(IV) without the need for aptamers, which saves the incubating time of ATP with its aptamer and cost. Therefore, the proposed sensor is background: available for real-time or for on-site ofwe ATP. AuNPs (the maximum signal ratio ATPdetection detection), achieve the well-dispersed of Thebyselectivity of Zr(IV) the proposed sensor for ATP is investigated in Figure 7. Compared with the AuNPs first adding and ATP and then adding AuNPs. values of the control sample (blank sample, nearly 1.5), the values of A520nm/A650nm of other analogues 3.4. PRACTP Sensor forUTP ATP are nearly 1.5 and the values of A520nm/A650nm of AMP are suchCharacterization as adenosine, of GTP, and nearly 1.65.5 However, the value of A520nm /A650nm of ATP concentrations is high (nearlyof 2.5). to some Figure shows absorption spectral results at different ATP. According With the increasing analytical results [44–46], change of at ±10% regarded as and a negligible error range. can be seen concentrations of ATP, the aabsorbance 650 is nm decreases the absorbance at 520Itnm increases. that the proposed method for ATP detection has good selectivity over adenosine, GTP, CTP, UTP It indicates that ATP induces AuNPs and the Zr(IV) mixture changes gradually from the aggregated and AMP within ±10% error. The high selectivity is speculated as being due to three phosphate state to the dispersed state. From the statistics of the absorption peaks in Figure 6, it can be seen that groups of of ATP bringing much stronger affinity Zr(IV)withofATP or µM the the values A520nm /A650nm increase linearly withbetween the concentrations ATPthan fromadenosine 0.1 µM to 15 other two phosphate groups (ADP) or one phosphate group’s derivatives (AMP). ATP can form (r = 0.9945). The LOD is 28 nM, which is much lower than that of most other reports (Table 1). Thea very is stable phosphate Zr(IV) 32−–Zr4+–) with Zr(IV). Besides, the high adsorption of LOD calculated on theand basis of the(–PO standard deviation (SD) of the blank measurements and the adenosine onto the surface of the AuNPs leads to high selectivity ATP over GTP, CTP and UTP slope of the calibration curve (S) (limit of detection = 3SD/S) [41,43].for The LOD is comparable to some [32,47]. The value of A 520nm/A650nm of ADP is nearly 1.70 beyond the ±10% error. It may be attributed reports; the proposed sensor for ATP using AuNPs is simple and fast within 2 min. More importantly, to the two phosphates of ADP a higher affinity for Zr(IV) than the onewithout phosphate of AMP, the proposed sensor only needshaving the participation of inorganic ions of Zr(IV) the need for but they have a weaker higher affinity than the three phosphates of ATP. It indicates the higher aptamers, which saves the incubating time of ATP with its aptamer and cost. Therefore, the proposed affinityisofavailable ADP with thanorAMP with Zr(IV). of ATP. sensor forZr(IV) real-time on-site detection
Figure 5. Absorption spectral results for ATP detection in the presence of Zr(IV). c(ATP, μM): 0, 0.1, Figure 5. Absorption spectral results for ATP detection in the presence of Zr(IV). c(ATP, µM): 0, 0.1, 0.5, 0.5, 1, 5, 10, 15; c(Zr(IV)): 10.0 μM. 1,2016, 5, 10,16, 15;1674 c(Zr(IV)): 10.0 µM. Sensors 7 of 11
Figure 6. 6. Linear Zr(IV). c(ATP, curve 1 to 7, μM): 0, Figure Linearrelationship relationshipofofATP ATPdetection detectionininthe thepresence presenceofof Zr(IV). c(ATP, curve 1 to 7, µM): 0.1,0.1, 0.5,0.5, 1, 5,1, 10, 10.0 10.0 μM. µM. The error bars bars represent the standard deviation of three 0, 5, 15; 10, c(Zr(IV)): 15; c(Zr(IV)): The error represent the standard deviation of measurements. three measurements. Table 1. Comparison of different methods for ATP detection. Methods
Materials
ECL(using aptamer) ECL(using aptamer) ECL(using aptamer)
CdSe/ZnSquantum dots Magnetic nanoparticles-CdSe/CdS quantum dots [Ru(bpy)3]2+, single-walled carbonnanohorn
Linear Range (μM) 0.018~90.7 0.01~0.8 0.005~50
LOD (nM) 6 3 1
Refs. [13] [12] [9]
Sensors Sensors 2016, 2016, 16, 16, 1674 1674
77 of of 11 11
The selectivity of the proposed sensor for ATP is investigated in Figure 7. Compared with the values of the control sample (blank sample, nearly 1.5), the values of A520nm /A650nm of other analogues such as adenosine, GTP, CTP and UTP are nearly 1.5 and the values of A520nm /A650nm of AMP are nearly 1.65. However, the value of A520nm /A650nm of ATP is high (nearly 2.5). According to some analytical results [44–46], a change of ±10% is regarded as a negligible error range. It can be seen that the proposed method for ATP detection has good selectivity over adenosine, GTP, CTP, UTP and AMP within ±10% error. The high selectivity is speculated as being due to three phosphate groups of ATP bringing much stronger affinity between Zr(IV)with ATP than adenosine or the other two phosphate groups (ADP) or one phosphate group’s derivatives (AMP). ATP can form a very stable phosphate and Zr(IV) (–PO3 2− –Zr4+ –) with Zr(IV). Besides, the high adsorption of adenosine onto the surface of the AuNPs leads to high selectivity for ATP over GTP, CTP and UTP [32,47]. The value of A520nm /A650nm of ADP is nearly 1.70 beyond the ±10% error. It may be attributed to the two phosphates of ADP having a higher affinity for Zr(IV) than the one phosphate of AMP, but they have a weaker higher affinity than6.the three phosphates ATP. It indicates higherofaffinity ADPcurve with 1Zr(IV) than0,AMP Figure Linear relationship of of ATP detection in thethe presence Zr(IV). of c(ATP, to 7, μM): with 0.1, Zr(IV). 0.5, 1, 5, 10, 15; c(Zr(IV)): 10.0 μM. The error bars represent the standard deviation of three measurements. Table 1. Comparison of different methods for ATP detection.
Table 1. Comparison of different methods for ATP detection. Methods
Materials
Linear Range (µM) LOD (nM) Refs. Linear Range LOD Refs. ECL(usingMethods aptamer) CdSe/ZnSquantum dots Materials 0.018~90.7 6 [13] (μM) (nM) ECL(using aptamer) Magnetic nanoparticles-CdSe/CdS quantum dots 0.01~0.8 3 [12] ECL(using aptamer)[Ru(bpy) CdSe/ZnSquantum dots 0.018~90.7 6 1 [13][9] 2+ ECL(using aptamer) 0.005~50 3 ] , single-walled carbonnanohorn 2+nanoparticles-CdSe/CdS quantum dots ECL(using aptamer)[Ru(bpy) Magnetic 0.01~0.8 3 100 [12][10] ECL(using aptamer) 0.2~1 2 dppz] 3]2+, graphene single-walled carbonnanohorn 0.005~50 1 450 [9][20] ECL(using aptamer)FAM-labelled [Ru(bpy) FRET(using aptamer) DNA, oxide 3~320 2dppz]2+ 0.2~1 10020 [10][21] ECL(using aptamer)FAM using [Ru(bpy) FRET(using aptamer) SDR amplification 0.02~0.6 FRET(using aptamer)The prepared FAM-labelled DNA, grapheneprobe: oxide 3~320 450 [20] ratiometric fluorescent 0.1~10 FRET(no aptamer) FRET(using aptamer)naphthalimide-rhodaminecompound FAM using SDR amplification 0.02~0.6 20100 [21][19] The prepared ratiometric fluorescent probe: FRET(no aptamer) SYBR Green I using exonuclease-catalyzed target 0.1~10 100 [19] Fluorescence 0.01~2 9.5 [22] naphthalimide-rhodaminecompound (using aptamer) recycling amplification SYBR Green I using exonuclease-catalyzed Fluorescence(using 0.01~2 9.5 [22][1] LSPR(using aptamer)aptamer) Gold nanorod, TAMRA amplification dye 0.00001~10 10 pM target recycling ITC(using aptamer) Glucose oxidase 10~100 10 µM [48] LSPR(using aptamer) Gold nanorod, TAMRA dye 0.00001~10 10 pM [1] DPV(using aptamer) Porphyrin functionalized graphene nanosheets 0.0022~1.3 0.7 [15] ITC(using aptamer) Glucose oxidase 10~100 10 μM [48] Amperometry oxidase and hexokinase graphene nanosheets DPV(using aptamer)GlucosePorphyrin functionalized 0.0022~1.3 0.72500 [15][16] 100~16000 (no aptamer) co-immobilizedPt electrode Glucose oxidase and hexokinase Amperometry(no aptamer) 100~16000 2500 [16] This electrode PRA(no aptamer) AuNPs,co-immobilizedPt Zr(IV) 0.1~15 28 work PRA(no aptamer) AuNPs, Zr(IV) 0.1~15 28 This work SWV: square-wave ECL: electrochemiluminescence; FRET: fluorescence energyresonance transfer; SWV: square-wavevoltammetry; voltammetry; ECL: electrochemiluminescence; FRET: resonance fluorescence FAM: carboxyfluorescein; SDR: strand displacement reaction; LSPR: localized surface plasmon resonance; energy transfer; titration FAM: carboxyfluorescein; SDR: strand ITC: isothermal calorimetry; DPV: differential pulsedisplacement voltammetry. reaction; LSPR: localized surface
plasmon resonance; ITC: isothermal titration calorimetry; DPV: differential pulse voltammetry.
Figure 7. Selectivity for ATP detection. c(ATP and its analogs): 10 μM; µM; c(Zr(IV)): 10.0 μM. µM. The error standard deviation deviation of of three three measurements. measurements. bars represent the standard
Sensors 2016, 16, 1674
8 of 11
3.5. Detection of ATP in Synthetic Mixture Usually the amount of ATP in cells or bacterium is from 10−18 to 10−15 mol per cell [49]. Therefore, most reports detect ATP in a real urine sample or diluted serum sample by adding a higher concentration of ATP standard solution. In commercial ATP injections (20 mg/2 mL), it can be achieved by our present method for ATP detection. To investigate the feasibility of the proposed sensor to measure real samples, a synthetic mixture containing adenosine, ADP, AMP, GTP, CTP and UTP, as mentioned above, are utilized in recovery measurements. ATP (1, 5 and 10 µM) was respectively added to synthetic mixtures (Table 2). Then Zr(IV) (10 µM) and tris-HCl buffer solutions (pH 7.4, 100 µL) were added to the above solutions to achieve the affinity between Zr(IV) and ATP. Finally, AuNPs and NaCl (30 mM) were added. The whole solutions were vortex-mixed thoroughly, kept at room temperature for 2 min and transferred for PRA spectrum measurements. Since the synthetic mixtures did not have ATP, recovery percentages are calculated by dividing the concentrations of ATP measured with the added concentration of ATP. The calculated mean recoveries for the analysis of ATP range from 95.3% to 102.0% by three measurements. The satisfactory results indicate that the proposed PRA and visual sensor is promising in the application of real samples. Table 2. Recoveries for ATP detection in synthetic samples. Samples
The Added ATP (µM)
The Total ATP (µM)
Mean Recoveries (%)
1 2 3
1 5 10
0.98, 1.03, 1.05 5.04, 5.01, 5.11 9.87, 9.93, 10.05
102.0 101.1 95.3
4. Conclusions In conclusion, a new visual and PRA sensor for ATP has been developed using AuNPs based on the high affinity between Zr(IV) and phosphate. It achieves visual detection of ATP with a LOD of 0.5 µM within 2 min. It realizes PRA detection for ATP from 0.1 µM to 15 µM with a LOD of 28 nM, which is comparable to other reports. The proposed sensor for ATP using AuNPs is simple and with a fast response within 2 min. More importantly, the proposed ATP sensor only needs the participation of inorganic ions Zr(IV) free from aptamers, which saves the incubating time of ATP with its aptamer. The proposed sensor exhibits good selectivity for ATP over other analogs such as adenosine, AMP, GTP, CTP and UTP. In addition, the recoveries for the analysis of ATP in synthetic samples are satisfactory. Therefore, the proposed ATP sensor can potentially be applied in real-time or on-site detection of ATP. Acknowledgments: It was supported by the National Natural Science Foundation of China (No. 21475123, 21505011), Chongqing Research Program of Basic Research and Frontier Technology (No. cstc2015jcyjA20019), Scientific and Technological Research Program of Chongqing Education Committee (No. KI1500306), and the Chinese Academy of Sciences (CAS)-the Academy of Sciences for the Developing World (TWAS) President’s Fellowship Programme. Author Contributions: Guobao Xu and Wenjing Qi designed the experiments. Wenjing Qi, Zhongyuan Liu and Wei Zhang performed the experiments, represented them in graphs and tables. Wenjing Qi wrote the paper. Mohamed Ibrahim Halawa checked the language and grammars. Guobao Xu checked the whole paper including the experimental results and the demonstrations. Conflicts of Interest: The authors declare no conflict of interest.
References 1.
2.
Park, J.-H.; Byun, J.-Y.; Shim, W.-B.; Kim, S.U.; Kim, M.-G. High-sensitivity detection of ATP using a localized surface plasmon resonance (LSPR) sensor and split aptamers. Biosens. Bioelectron. 2015, 73, 26–31. [CrossRef] [PubMed] Wang, K.; Liao, J.; Yang, X.; Zhao, M.; Chen, M.; Yao, W.; Tan, W.; Lan, X. A label-free aptasensor for highly sensitive detection of ATP and thrombin based on metal-enhanced PicoGreen fluorescence. Biosens. Bioelectron. 2015, 63, 172–177. [CrossRef] [PubMed]
Sensors 2016, 16, 1674
3.
4.
5.
6.
7. 8.
9.
10.
11.
12. 13. 14.
15. 16.
17. 18.
19. 20. 21.
9 of 11
Wei, Y.; Chen, Y.; Li, H.; Shuang, S.; Dong, C.; Wang, G. An exonuclease I-based label-free fluorometric aptasensor for adenosine triphosphate (ATP) detection with a wide concentration range. Biosens. Bioelectron. 2015, 63, 311–316. [CrossRef] [PubMed] Jin, S.-Q.; Guo, S.-M.; Zuo, P.; Ye, B.-C. A cost-effective Z-folding controlled liquid handling microfluidic paper analysis device for pathogen detection via ATP quantification. Biosens. Bioelectron. 2015, 63, 379–383. [CrossRef] [PubMed] Lu, L.; Si, J.C.; Gao, Z.F.; Zhang, Y.; Lei, J.L.; Luo, H.Q.; Li, N.B. Highly selective and sensitive electrochemical biosensor for ATP based on the dual strategy integrating the cofactor-dependent enzymatic ligation reaction with self-cleaving DNAzyme-amplified electrochemical detection. Biosens. Bioelectron. 2015, 63, 14–20. [CrossRef] [PubMed] Kahlin, J.; Mkrtchian, S.; Ebberyd, A.; Hammarstedt-Nordenvall, L.; Nordlander, B.; Yoshitake, T.; Kehr, J.; Prabhakar, N.; Poellinger, L.; Fagerlund, M.J.; et al. The human carotid body releases acetylcholine, ATP and cytokines during hypoxia. Exp. Physiol. 2014, 99, 1089–1098. [CrossRef] [PubMed] Ma, C.B.; Yang, X.H.; Wang, K.M.; Tang, Z.W.; Li, W.; Tan, W.H.; Lv, X.Y. A novel kinase-based ATP assay using molecular beacon. Anal. Biochem. 2008, 372, 131–133. [CrossRef] [PubMed] He, H.-Z.; Ma, P.-Y.; Leung, K.-H.; Chan, S.-H.; Yang, H.; Cheng, Z.; Leung, C.-H.; Ma, D.-L. A label-free G-quadruplex-based switch-on fluorescence assay for the selective detection of ATP. Analyst 2012, 137, 1538–1540. [CrossRef] [PubMed] Liu, Z.; Zhang, W.; Qi, W.; Gao, W.; Hanif, S.; Saqib, M.; Xu, G. Label-free signal-on ATP aptasensor based on the remarkable quenching of tris(2,20 -bipyridine)ruthenium(II) electrochemiluminescence by single-walled carbon nanohorn. Chem. Commun. 2015, 51, 4256–4258. [CrossRef] [PubMed] Hu, L.; Bian, Z.; Li, H.; Han, S.; Yuan, Y.; Gao, L.; Xu, G. [Ru(bpy)2 dppz]2+ electrochemiluminescence switch and Its applications for DNA interaction study and label-free ATP aptasensor. Anal. Chem. 2009, 81, 9807–9811. [CrossRef] [PubMed] Liu, Z.; Zhang, W.; Hu, L.; Li, H.; Zhu, S.; Xu, G. Label-free and signal-on electrochemiluminescence aptasensor for ATP based on target-induced linkage of split aptamer fragments by using [Ru(phen)3 ]2+ intercalated into double-strand DNA as a probe. Chem. Eur. J. 2010, 16, 13356–13359. [CrossRef] [PubMed] Jie, G.; Yuan, J.; Zhang, J. Quantum dots-based multifunctional dendritic superstructure for amplified electrochemiluminescence detection of ATP. Biosens. Bioelectron. 2012, 31, 69–76. [CrossRef] [PubMed] Huang, H.; Tan, Y.; Shi, J.; Liang, G.; Zhu, J.-J. DNA aptasensor for the detection of ATP based on quantum dots electrochemiluminescence. Nanoscale 2010, 2, 606–612. [CrossRef] [PubMed] Guo, Y.; Sun, X.; Yang, G.; Liu, J. Ultrasensitive detection of ATP based on ATP regeneration amplification and its application in cell homogenate and human serum. Chem. Commun. 2014, 50, 7659–7662. [CrossRef] [PubMed] Zhang, H.; Han, Y.; Guo, Y.; Dong, C. Porphyrin functionalized graphene nanosheets-based electrochemical aptasensor for label-free ATP detection. J. Mater. Chem. 2012, 22, 23900–23905. [CrossRef] Soldatkin, O.O.; Schuvailo, O.M.; Marinesco, S.; Cespuglio, R.; Soldatkin, A.P. Microbiosensor based on glucose oxidase and hexokinase co-immobilised on platinum microelectrode for selective ATP detection. Talanta 2009, 78, 1023–1028. [CrossRef] [PubMed] Wang, Y.; He, X.; Wang, K.; Ni, X. A sensitive ligase-based ATP electrochemical assay using molecular beacon-like DNA. Biosens. Bioelectron. 2010, 25, 2101–2106. [CrossRef] [PubMed] Bao, T.; Shu, H.; Wen, W.; Zhang, X.; Wang, S. A sensitive electrochemical aptasensor for ATP detection based on exonuclease III-assisted signal amplification strategy. Anal. Chim. Acta 2015, 862, 64–69. [CrossRef] [PubMed] Tang, J.-L.; Li, C.-Y.; Li, Y.-F.; Zou, C.-X. A ratiometric fluorescent probe with unexpected high selectivity for ATP and its application in cell imaging. Chem. Commun. 2014, 50, 15411–15414. [CrossRef] [PubMed] Pu, W.D.; Zhang, L.; Huang, C.Z. Graphene oxide as a nano-platform for ATP detection based on aptamer chemistry. Anal. Methods 2012, 4, 1662–1666. [CrossRef] Cheng, S.; Zheng, B.; Wang, M.; Lam, M.H.-W.; Ge, X. A target-triggered strand displacement reaction cycle: The design and application in adenosine triphosphate sensing. Anal. Biochem. 2014, 446, 69–75. [CrossRef] [PubMed]
Sensors 2016, 16, 1674
22.
23. 24.
25.
26. 27.
28.
29.
30.
31.
32.
33.
34.
35. 36.
37. 38.
39. 40.
10 of 11
Xu, Y.; Xu, J.; Xiang, Y.; Yuan, R.; Chai, Y. Target-induced structure switching of hairpin aptamers for label-free and sensitive fluorescent detection of ATP via exonuclease-catalyzed target recycling amplification. Biosens. Bioelectron. 2014, 51, 293–296. [CrossRef] [PubMed] Liang, R.P.; Wang, Z.X.; Zhang, L.; Qiu, J.D. Label-free colorimetric detection of arsenite utilizing G-/T-rich oligonucleotides and unmodified Au nanoparticles. Chem. Eur. J. 2013, 19, 5029–5033. [CrossRef] [PubMed] Zhan, S.; Wu, Y.; He, L.; Wang, F.; Zhan, X.; Zhou, P.; Qiu, S. A silver-specific DNA-based bio-assay for Ag(I) detection via the aggregation of unmodified gold nanoparticles in aqueous solution coupled with resonance Rayleigh scattering. Anal. Methods 2012, 4, 3997–4002. [CrossRef] Du, G.; Zhang, D.; Xia, B.; Xu, L.; Wu, S.; Zhan, S.; Ni, X.; Zhou, X.; Wang, L. A label-free colorimetric progesterone aptasensor based on the aggregation of gold nanoparticles. Microchim. Acta 2016, 183, 2251–2258. [CrossRef] Xing, H.; Zhan, S.; Wu, Y.; He, L.; Zhou, P. Sensitive colorimetric detection of melamine in milk with an aptamer-modified nanogold probe. RSC Adv. 2013, 3, 17424–17430. [CrossRef] Kanayama, N.; Takarada, T.; Maeda, M. Rapid naked-eye detection of mercury ions based on non-crosslinking aggregation of double-stranded DNA-carrying gold nanoparticles. Chem. Commun. 2011, 47, 2077–2079. [CrossRef] [PubMed] Liu, Z.D.; Li, Y.F.; Ling, J.; Huang, C.Z. A localized surface plasmon rsonance light-scattering assay of mercury (II) on the basis of Hg2+ -DNA complex induced aggregation of gold nanoparticles. Environ. Sci. Technol. 2009, 43, 5022–5027. [CrossRef] [PubMed] Wu, Y.; Zhan, S.; Wang, F.; He, L.; Zhi, W.; Zhou, P. Cationic polymers and aptamers mediated aggregation of gold nanoparticles for the colorimetric detection of arsenic(III) in aqueous solution. Chem. Commun. 2012, 48, 4459–4461. [CrossRef] [PubMed] He, L.; Zhi, W.; Wu, Y.; Zhan, S.; Wang, F.; Xing, H.; Zhou, P. A highly sensitive resonance scattering based sensor using unmodified gold nanoparticles for daunomycin detection in aqueous solution. Anal. Methods 2012, 4, 2266–2271. [CrossRef] Liu, Y.; Yang, Y.; Zhao, X.; Liu, Z.; Li, Y. Responsive disassembly of the gold nanoparticle aggregates triggered by the competitive adsorption for lighting up the colorimetric sensing. Anal. Methods 2013, 5, 3242–3247. [CrossRef] Deng, D.; Xia, N.; Li, S.; Xu, C.; Sun, T.; Pang, H.; Liu, L. Simple, fast and selective detection of adenosine triphosphate at physiological pH using unmodified gold nanoparticles as colorimetric probes and metal ions as cross-linkers. Sensors 2012, 12, 15078–15087. [CrossRef] [PubMed] Huo, Y.; Qi, L.; Lv, X.-J.; Lai, T.; Zhang, J.; Zhang, Z.-Q. A sensitive aptasensor for colorimetric detection of adenosine triphosphate based on the protective effect of ATP-aptamer complexes on unmodified gold nanoparticles. Biosens. Bioelectron. 2016, 78, 315–320. [CrossRef] [PubMed] Tan, Y.N.; Lee, K.H.; Su, X. Study of Single-Stranded DNA Binding Protein-Nucleic Acids Interactions using Unmodified Gold Nanoparticles and Its Application for Detection of Single Nucleotide Polymorphisms. Anal. Chem. 2011, 83, 4251–4257. [CrossRef] [PubMed] Zheng, Y.; Wang, Y.; Yang, X. Aptamer-based colorimetric biosensing of dopamine using unmodified gold nanoparticles. Sens. Actuators B Chem. 2011, 156, 95–99. [CrossRef] Chen, S.-J.; Huang, Y.-F.; Huang, C.-C.; Lee, K.-H.; Lin, Z.-H.; Chang, H.-T. Colorimetric determination of urinary adenosine using aptamer-modified gold nanoparticles. Biosens. Bioelectron. 2008, 23, 1749–1753. [CrossRef] [PubMed] Wang, Y.; Zhang, L.; Liang, R.P.; Bai, J.M.; Qiu, J.D. Using graphene quantum dots as photoluminescent probes for protein kinase sensing. Anal. Chem. 2013, 85, 9148–9155. [CrossRef] [PubMed] Zhang, L.; Zhao, Q.; Liang, Z.; Yang, K.; Sun, L.; Zhang, L.; Zhang, Y. Synthesis of adenosine functionalized metal immobilized magnetic nanoparticles for highly selective and sensitive enrichment of phosphopeptides. Chem. Commun. 2012, 48, 6274–6276. [CrossRef] [PubMed] Zhao, Z.; Zhou, X.; Xing, D. Highly sensitive protein kinase activity assay based on electrochemiluminescence nanoprobes. Biosens. Bioelectron. 2012, 31, 299–304. [CrossRef] [PubMed] Qi, W.J.; Wu, D.; Ling, J.; Huang, C.Z. Visual and light scattering spectrometric detections of melamine with polythymine-stabilized gold nanoparticles through specific triple hydrogen-bonding recognition. Chem. Commun. 2010, 46, 4893–4895. [CrossRef] [PubMed]
Sensors 2016, 16, 1674
41.
42. 43.
44. 45.
46. 47. 48. 49.
11 of 11
Qi, W.; Zhao, J.; Zhang, W.; Liu, Z.; Xu, M.; Anjum, S.; Majeed, S.; Xu, G. Visual and surface plasmon resonance sensor for zirconium based on zirconium-induced aggregation of adenosine triphosphate-stabilized gold nanoparticles. Anal. Chim. Acta 2013, 787, 126–131. [CrossRef] [PubMed] Li, W.; Feng, L.; Ren, J.; Wu, L.; Qu, X. Visual Detection of Glucose Using Conformational Switch of I-Motif DNA and Non-Crosslinking Gold Nanoparticles. Chem. Eur. J. 2012, 18, 12637–12642. [CrossRef] [PubMed] Larkey, N.E.; Brucks, C.N.; Lansing, S.S.; Le, S.D.; Smith, N.M.; Tran, V.; Zhang, L.; Burrows, S.M. Molecular structure and thermodynamic predictions to create highly sensitive microRNA biosensors. Anal. Chim. Acta 2016, 909, 109–120. [CrossRef] [PubMed] Goswami, N.; Giri, A.; Bootharaju, M.S.; Xavier, P.L.; Pradeep, T.; Pal, S.K. Copper quantum clusters in protein matrix: Potential sensor of Pb2+ ion. Anal. Chem. 2011, 83, 9676–9680. [CrossRef] [PubMed] Chen, T.; Hu, Y.; Cen, Y.; Chu, X.; Lu, Y. A dual-emission fluorescent nanocomplex of gold-cluster-decorated silica particles for live cell imaging of highly reactive oxygen species. J. Am. Chem. Soc. 2013, 135, 11595–11602. [CrossRef] [PubMed] Guo, C.; Irudayaraj, J. Fluorescent Ag clusters via a protein-directed approach as a Hg(II) ion sensor. Anal. Chem. 2011, 83, 2883–2889. [CrossRef] [PubMed] Zhao, W.; Lee, T.M.H.; Leung, S.S.Y.; Hsing, I.M. Tunable stabilization of gold nanoparticles in aqueous solutions by mononucleotides. Langmuir 2007, 23, 7143–7147. [CrossRef] [PubMed] Sitaula, S.; Branch, S.D.; Ali, M.F. GOx signaling triggered by aptamer-based ATP detection. Chem. Commun. 2012, 48, 9284–9286. [CrossRef] [PubMed] Karu, T.; Pyatibrat, L.; Kalendo, G. Irradiation with He-Ne laser increases ATP level in cells cultivated in vitro. J. Photochem. Photobiol. B 1995, 27, 219–223. [CrossRef] © 2016 by the authors; licensee MDPI, Basel, Switzerland. This article is an open access article distributed under the terms and conditions of the Creative Commons Attribution (CC-BY) license (http://creativecommons.org/licenses/by/4.0/).