Rosa, Marcello G. P., Vivien A. Casagrande, Todd Preuss, and. INTRODUCTION ... terans, and tree shrews (see Preuss and Goldman-Rakic representation of ...
Visual Field Representation in Striate and Prestriate Cortices of a Prosimian Primate (Galago garnetti) MARCELLO G. P. ROSA, 1 VIVIEN A. CASAGRANDE, 2 TODD PREUSS, 3,4 AND JON H. KAAS 3 1 Vision, Touch and Hearing Research Centre, Department of Physiology and Pharmacology, The University of Queensland, QLD 4072, Australia; 2 Department of Cell Biology and 3 Department of Psychology, Vanderbilt University, Nashville, Tennessee 37240; and 4 Division of Behavioral Biology, University of Southwestern Louisiana—New Iberia Research Center, New Iberia, Louisiana 70560 Rosa, Marcello G. P., Vivien A. Casagrande, Todd Preuss, and Jon H. Kaas. Visual field representation in striate and prestriate cortices of a prosimian primate (Galago garnetti). J. Neurophysiol. 77: 3193–3217, 1997. Microelectrode mapping techniques were used to study the visuotopic organization of the first and second visual areas (V1 and V2, respectively) in anesthetized Galago garnetti, a lorisiform prosimian primate. 1) V1 occupies Ç200 mm2 of cortex, and is pear shaped, rather than elliptical as in simian primates. Neurons in V1 form a continuous (1st-order) representation of the visual field, with the vertical meridian forming most of its perimeter. The representation of the horizontal meridian divides V1 into nearly equal sectors representing the upper quadrant ventrally, and the lower quadrant dorsally. 2) The emphasis on representation of central vision is less marked in Galago than in simian primates, both diurnal and nocturnal. The decay of cortical magnification factor with increasing eccentricity is almost exactly counterbalanced by an increase in average receptive field size, such that a point anywhere in the visual field is represented by a compartment of similar diameter in V1. 3) Although most of the cortex surrounding V1 corresponds to V2, one-quarter of the perimeter of V1 is formed by agranular cortex within the rostral calcarine sulcus, including area prostriata. Although under our recording conditions virtually every recording site in V2 yielded visually responsive cells, only a minority of those in area prostriata revealed such responses. 4) V2 forms a cortical belt of variable width, being narrowest ( Ç1 mm) in the representation of the area centralis and widest (2.5–3 mm) in the representation of the midperiphery ( ú207 eccentricity) of the visual field. V2 forms a second-order representation of the visual field, with the area centralis being represented laterally and the visual field periphery medially, near the calcarine sulcus. Unlike in simians, the line of field discontinuity in Galago V2 does not exactly coincide with the horizontal meridian: a portion of the lower quadrant immediately adjacent to the horizontal meridian is represented at the rostral border of ventral V2, instead of in dorsal V2. Despite the absence of cytochrome oxidase stripes, the visual field map in Galago V2 resembles the ones described in simians in that the magnification factor is anisotropic. 5) Receptive field progressions in cortex rostral to dorsal V2 suggest the presence of a homologue of the dorsomedial area, including representations of both quadrants of the visual field. These results indicate that many aspects of organization of V1 and V2 in simian primates are shared with lorisiform prosimians, and are therefore likely to have been present in the last common ancestor of living primates. However, some aspects of organization of the caudal visual areas in Galago are intermediate between nonprimates and simian primates, reflecting either an intermediate stage of differentiation or adaptations to a nocturnal niche. These include the shape and the small size of V1 and V2, the modest degree of emphasis on central visual field representation, and the relatively large area prostriata.
INTRODUCTION
As a part of ongoing projects aimed at defining the visual areas of primates, we report on the visuotopic organization of the primary visual cortex (area 17, or V1) and adjacent prestriate cortex in a prosimian primate, the small-eared greater galago (Galago garnetti). Although most of the research on the organization of primate visual cortex has concentrated on the simian (i.e., anthropoid) primates (New World monkeys, Old World monkeys, apes, and humans) (Hoffstetter 1982; Martin 1990), the study of cortical organization in prosimian primates is important for several reasons. The brains of prosimians are smaller relative to body size than those of monkeys (Jerison 1979; Preuss and Goldman-Rakic 1991a,b; Stephan and Andy 1969; Stephan et al. 1981), and it is possible that the number and the complexity of cortical visual areas are reduced in comparison with those of simian primates. This simpler pattern of organization may be easier to unravel. Moreover, by drawing attention to those features of the organization of cortical visual areas shared by different primate groups, a comparative analysis can help understanding of the organization in primates in general, and also clarify which changes occurred in the cortex after the separation of the Order Primates from the lineages leading to related mammals, such as megachiropteran bats, dermopterans, and tree shrews (see Preuss and Goldman-Rakic 1991a; Rosa et al. 1996 for summaries of the phylogenetic relationships between galagos and other primates). The galago is a good choice for study of the organization of striate and extrastriate visual areas because much work has been done to characterize the anatomy and physiology of other portions of its visual system. For example, it has been demonstrated that the parallel (magnocellular, parvocellular, and koniocellular) pathways from the retina to V1 are distinct and well developed in this genus (Casagrande and Norton 1991; Florence and Casagrande 1987; Florence et al. 1983); in addition, it is one of only three primate species in which the receptive field structures of cells in both the lateral geniculate nucleus and V1 have been compared (DeBruyn et al. 1993; Irvin et al. 1993; Norton and Casagrande 1982; Norton et al. 1988). There is also detailed information on the connectional anatomy of all levels of the visual system in this prosimian (Cusick et al. 1984; Krubitzer and Kaas 1990, 1993; Symonds and Kaas 1978; Tigges and Tigges 1970; Tigges et al. 1973; Wall et al. 1982; Weller and Kaas 1982). Finally, and perhaps most importantly, visual resolution and sensitivity have been determined both behav-
0022-3077/97 $5.00 Copyright q 1997 The American Physiological Society
/ 9k13$$ju39
J761-6
06-05-97 13:33:43
neupal
LP-Neurophys
3193
3194
M.G.P. ROSA, V. A. CASAGRANDE, T. PREUSS, AND J. H. KAAS
iorally and physiologically in this species (Bonds et al. 1987; Langston et al. 1986). The primary objective of this study was to describe the representation of the visual field in striate cortex and immediately adjacent extrastriate cortex in Galago. This type of information is likely to be valuable for the interpretation of anatomic and physiological studies of cortical organization in this genus. In the process of recording from V1 and the second visual area (V2), we also obtained many recordings from neurons located in the adjacent visually responsive cortex. Although not sufficient to yield a full picture of the organization of extrastriate cortex in Galago, these exploratory recordings directly address important aspects of the organization of the dorsomedial visual cortex rostral to V2 in prosimians. METHODS
Four adult galagos (G. garnetti) were submitted to single recording sessions. Although most of the data on V1 and V2 were collected in two experiments, the results from all four cases were in close agreement. Anesthesia was induced with halothane (4%) and maintained during surgery with multiple intravenous doses of brevital (methohexital sodium, 10 mg/kg). Once anesthetized, the animals also received intramuscular injections of atropine (0.15 mg/kg) and dexamethasone (0.4 mg/kg). A tracheotomy was performed, and the trachea was cannulated to allow for artificial ventilation. The skull was fitted with a stainless steel bolt and an acrylic well centered on the midline. An extensive craniotomy was made exposing the occipital lobe as well as adjacent parts of the temporal and parietal lobes, and the dura mater was resected. Once these procedures were completed the well was filled with silicone oil, and a photograph of the cortical surface was taken to be used as reference for the placement of electrode penetrations. During the recordings, muscular paralysis was induced by the intravenous infusion of pancuronium bromide (Pavulon, 2 mg/kg, followed by 2 mgrkg 01rh 01 ) in lactated Ringer solution with 5% dextrose. For anesthesia, the intravenous injection also included the opioid sufentanil citrate (average dose 12 mgrkg 01rh 01 ). In one of the animals, this was supplemented with small intravenous doses of brevital (2 mg/kg) on the 3rd day of the experiment, to suppress episodes of cyclical cortical spontaneous activity. The galagos were also maintained under artificial ventilation with a gaseous mixture of 75% nitrous oxide-23.5% oxygen-1.5% carbon dioxide, which potentiates the effects of the intravenous anesthetics. The respiratory volume and rate were adjusted to keep the percentage of CO2 in the expired air between 4.0 and 4.5%. Mydriasis and cycloplegia were induced by the topical application of atropine (1%) eye drops. Appropriate focus was achieved by means of hard contact lenses, which brought into focus the surface of a 57-cm-diam translucent hemispheric screen centered on the eye contralateral to the cerebral hemisphere to be studied. The positions of the area centralis, main blood vessels, and blind spot were projected onto the screen by means of a fiberoptic light source (Pettigrew et al. 1979) and checked every 2–3 h during the experiment. The position of the horizontal meridian (HM) and the vertical meridian (VM) of the visual field were defined according to the relationship between retinal landmarks such as the blind spot and the ganglion cell distribution (DeBruyn et al. 1980). First, the HM was defined as a line passing through the area centralis and parallel to the ‘‘visual streak.’’ Because the visual streak in Galago cannot be visualized directly, the estimate was a line connecting the center of the area centralis (which was directly visualized) to a point 57 below the blind spot, corresponding to the average distance between the center of this retinal landmark and the axis of maximal ganglion cell distribution in flat-mounted
/ 9k13$$ju39
J761-6
retinas (DeBruyn et al. 1980). The VM was then defined as perpendicular to the HM through the center of the area centralis. As shown in Fig. 3C, these estimates of the axes of coordinates of visual field result in a distribution of receptive fields near the V1/ V2 border that resembles the pattern observed in other species with developed vision, including cat, flying fox, and New World monkey (for reviews, see Fritsches and Rosa 1996; Payne 1990); the receptive fields near the V1 border invade the ipsilateral hemifield to a small extent, and the amount of invasion is similar in the upper and lower quadrants of the visual field. Parylene-coated tungsten microelectrodes (with an exposed tip of 10 mm) were inserted in parasagittal rows of penetrations. Electrode penetrations were usually separated by 500–1,000 mm along the anteroposterior dimension, and were marked with electrolytic lesions. The response fields of single units and small unit clusters were mapped by correlating the stimulation of specific portions of the visual field with increments of the neural activity. Visual stimuli comprised luminous white spots and bars of variable size and illuminance, moved or flashed on the surface of the screen by means of a hand-held projector. Receptive fields were drawn as rectangles parallel to the axis of best orientation, or as ovals if this axis could not be determined. Receptive field size was calculated as the square root of the receptive field area. At the end of the experiment, the animals were administered a lethal dose of pentobarbitone sodium (100 mg) and transcardially perfused with 0.9% saline, followed by 10% Formalin in saline. The brain was removed from the skull, blocked in stereotaxic coordinates, allowed to sink in fixative containing increasing concentrations of sucrose (up to 30%), and frozen-sectioned at 50 mm in the parasagittal plane. Every section was saved, and every second section was stained for cell bodies with cresyl violet for reconstruction of the electrode tracks. Of the alternating series, one section in every four was stained for myelin (Gallyas 1979) and the remaining sections were stained for cytochrome oxidase (WongRiley 1979). The positions of the recording sites were reconstructed on the basis of the histologically determined electrolytic lesions, the gliosis caused by the penetration of the electrode, and transitions between gray and white matter. Bidimensional reconstructions of cortical layer 4 were obtained following a modification of the method of Van Essen and Maunsell (1980), as described previously (Rosa et al. 1993a). All measurements presented here include correction for shrinkage during histological processing, which was estimated by comparing the microdrive readings with the electrode tracks reconstructed in histological sections. RESULTS
In the first part of this section we summarize the cortical architecture of areas V1, V2, and prostriata as revealed by both cytochrome-oxidase- and myelin-stained material. We then describe the extent and general topography of the visual field representation in V1 of Galago and demonstrate the detailed visuotopy of this area in both serial sections and ‘‘unfolded’’ bidimensional reconstructions. We also present a quantitative analysis of the variation of receptive field size and magnification factor in different parts of V1, and use these data to calculate the point image size in striate cortex. Finally, we describe some aspects of the organization of cortex surrounding V1, including the visuotopic organization of V2 and cortex rostral to dorsomedial V2. Histological characteristics of areas V1, V2, and prostriata The extent of V1 in galagos was defined both histologically and physiologically, and was consistent between ani-
06-05-97 13:33:43
neupal
LP-Neurophys
PROSIMIAN VISUAL CORTEX
3195
V1. In V2, the supragranular and granular layers together stain rather homogeneously, and more intensely than the infragranular layers. An infragranular band of slightly increased cytochrome oxidase reactivity is also apparent in V2, due to the presence of intensely stained cells in layer 5 (Fig. 1A). The rostral border of V2 is not clearly defined in cytochrome-oxidase-stained parasagittal sections. Area prostriata presents an overall light staining, being also noticeably thinner than either V1 or V2 (Fig. 1B). In myelin-stained tissue, V1 is characterized by clearly separated inner and outer bands of Baillarger (Fig. 2A). In contrast, in V2 a dense plexus of coarse bundles of radial fibers runs without interruption between layers 3 and 6, obscuring the cleft between the bands of Baillarger. This characteristic is a reliable criterion for separation of this area from V1 (Fig. 2B). In addition, it allows a distinction between V2 and the visual areas rostral to it in ventral, lateral, and dorsolateral extrastriate cortices. Although the areas rostral to V2 vary in terms of density of myelination (Krubitzer and Kaas 1990, 1993), they can all be distinguished from V2 by the presence of a less myelinated band inserted between the inner and outer bands of Baillarger (Fig. 2C). Location and overall organization of V1
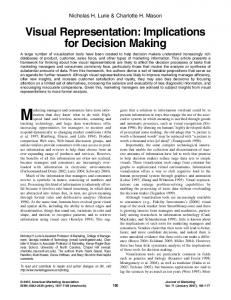
FIG . 1. Cytochrome oxidase patterns of the 1st and 2nd visual areas (V1 and V2, respectively) and prostriata, illustrated in parasagittal sections observed through a Zeiss Axiophot microscope equipped with a digital video capture system (Seescan LC100M). Caudal is left, dorsal is up. A: border between V1 and V2 in dorsolateral cortex. Downward arrows atop section: cytochrome oxidase ‘‘blobs’’ in V1. Rightward arrow within section: row of densely stained cells in layer 5, which characterizes certain regions of V2. Border between V1 and V2 coincides with tip of this arrow. B: border between V1 and area prostriata (pro) in dorsal bank of calcarine sulcus (at a level approximately corresponding to section in Fig. 4C). Arrows: cytochrome oxidase blobs of V1. Scale bar in A: 0.5 mm.
mals. V1 can be easily distinguished from adjacent areas in parasagittal sections. Although the transitions are also clear in Nissl-stained sections (e.g., Diamond et al. 1985), the most precise determination of the boundaries of V1 is afforded by the cytochrome oxidase and myelin stains. In cytochrome-oxidase-stained sections, V1 can be distinguished from both V2 (Fig. 1A) and area prostriata (Fig. 1B) by virtue of the presence of a darkly stained, broad layer 4, and cytochrome oxidase ‘‘blobs’’ in the supragranular layers of
/ 9k13$$ju39
J761-6
V1 occupies the caudal pole of the dorsolateral surface of occipital cortex, the underlying ventral surface adjacent to the tentorium, portions of the caudal cortex along the midline fissure, and both banks of the calcarine sulcus (Fig. 3, A and B). Within this area there is a single, continuous representation of the entire contralateral hemifield, up to eccentricities of 50–607 along the VM and 1007 along the HM (Fig. 3C). The representation of the area centralis occupies the lateral edge of the portion of V1 exposed on the dorsolateral cortex (Fig. 3A). The representation of the visual field around the VM forms most of the border of V1 (Fig. 3, squares), and the representation of the HM (Fig. 3, circles) bisects V1 in such a way that the representation of the lower quadrant is dorsal to the representation of the upper quadrant. Most of the cortex exposed on the surface of the occipital lobe corresponds to the representation of the lower visual quadrant, up to eccentricities of 15–207. Although parts of the representation of the upper quadrant near the HM are also accessible on the caudal pole of the occipital lobe, our results indicate that most of the paracentral (5– 207 eccentricity) upper quadrant representation is located on the tentorial surface of the brain (Fig. 3B). The part of V1 located along the walls of the interhemispheric fissure represents parts of the periphery of the lower quadrant, near the VM, up to Ç407. All of the remaining portions of the visual field periphery are represented along the banks of the calcarine sulcus. Although the ventral bank of this sulcus is entirely dedicated to the representation of parts of the upper visual field periphery, the dorsal bank represents portions of both the upper and lower visual quadrants (Fig. 3B). The most rostral part of V1, in the calcarine sulcus, represents the perimeter of the contralateral visual field (Fig. 3, triangles). Visuotopic organization of V1 Figure 4 illustrates results obtained in one animal in which recordings covered most of the cortex within V1. Figure 4,
06-05-97 13:33:43
neupal
LP-Neurophys
3196
M.G.P. ROSA, V. A. CASAGRANDE, T. PREUSS, AND J. H. KAAS
FIG . 2. Digital video frames illustrating myelin patterns and transitions between V1, V2, and visually responsive ventral cortex rostral to V2 ( V? ) . Caudal is right, dorsal is up. A : myelin pattern of V1. Parts of infragranular layers are sectioned tangentially in ventral part. B : oblique section through border between V1 and V2 ( at a level similar to that of section in Fig. 4 D ) , illustrating disappearance of less myelinated ‘‘cleft’’ between inner and outer bands of Baillarger, moving from V1 to V2. C : crossing rostral border of V2, supragranular layers become relatively broader, and ‘‘matted’’ appearance of V2 in myelin stains gives way to areas where bands of Baillarger are well separated. Arrows: approximate location of borders of V2. Scale bar in A : 0.5 mm.
/ 9k13$$ju39
J761-6
A–F, shows the correlation between the positions of recording sites in parasagittal sections (A being the most lateral, F the most medial) and the visual field coordinates (azimuths and elevations) of the corresponding receptive fields. Given that the electrode penetrations were many millimeters long, they rarely could be reconstructed within a single 50-mm section; each of the parasagittal sections illustrated in Fig. 4 is, therefore, a composite view of several adjacent sections. Considering first the cortex exposed on the dorsolateral and tentorial surfaces of the brain, the analysis of parasagittal sections reveals a clear mediolateral gradient in the representation: the most lateral sites (Fig. 4, A1–A4) correspond to the most central receptive fields, and eccentricity gradually increases as the electrode is moved medially (Fig. 4, B1– B21, C1–C16, and D1–D18). The most peripheral receptive fields of neurons on the dorsolateral and tentorial surfaces (Fig. 4, E1 and D19, respectively) represent eccentricities of Ç207. At the same time, for each mediolateral level, the receptive fields gradually move from the lower to the upper visual field as the electrode tip is moved ventrally (e.g., Fig. 4, B1–B21). Comparison of receptive fields recorded in electrode penetrations close to the midline (Fig. 4F) reveals a gradual displacement toward the periphery of the lower quadrant as the electrode is moved rostrally. A similar centroperipheral trend characterizes the recording sites located in the calcarine sulcus: at each mediolateral level, the most caudal sites represent the midperiphery of the visual field (30–457, e.g., Fig. 4, B39, C29, and D35), and the most rostral sites always correspond to the representation of the temporal crescent of the visual field (Fig. 4, B55–B59, C40, and D47–D48). The regions of the visual field represented on the banks of the calcarine sulcus include the entire periphery of the upper quadrant (lateral and ventrally in the sulcus, e.g., Fig. 4, A, B, and C17–C27) as well as the portions of the lower quadrant periphery away from the VM (medial and dorsally in the sulcus, e.g., Fig. 4, C28–C40, D36–D48, E14–E18, and E31–E33). These trends can be more readily visualized in graphically unfolded views of V1 generated from the contours of individual parasagittal sections. Three steps in the generation of a visuotopic map are illustrated in Fig. 5 (corresponding to the data shown in Fig. 4). In Fig. 5A, the contours of individual parasagittal sections are aligned and properly spaced, to reconstruct the approximate shape of V1. As an aid to orientation, different regions of V1 are indicated by different shading. Note that the anteroposterior axis of the cortex within the calcarine sulcus is inverted relative to Fig. 4, as a consequence of the process of ‘‘opening’’ the banks of this sulcus (the rostral tip of the calcarine sulcus now occupies the far right of the drawings). As shown in Fig. 5A, V1 in Galago is pear shaped, and not as elongated as in simian primates (e.g., Fritsches and Rosa 1996). The reconstructed surface area of V1 was 205 mm2 in this animal and 218 mm2 in the other animal with extensive recordings in V1 (these estimates are correct only within 20–30% because of the error inherent in the graphic unfolding method) (Gattass et al. 1987; Van Essen and Maunsell 1980). The portion of V1 that is directly accessible on the dorsolateral and caudal surfaces of the occipital lobe only corresponds to Ç20% of this area. In Fig. 5, B and C, the recording sites are
06-05-97 13:33:43
neupal
LP-Neurophys
PROSIMIAN VISUAL CORTEX
3197
FIG . 3. Summary of visuotopic organization and extent of V1 in Galago garnetti. A and B: dorsolateral and medial views of a left hemisphere in which banks of calcarine sulcus have been separated. Extent of V1 is indicated in white. Visuotopy of this area is illustrated according to following symbols (see inset): black squares, representation of vertical meridian (VM); white circles, representation of horizontal meridian (HM); thin continuous lines, isoeccentricity contours (5, 10, 20, 40, 60, and 807 ); dashed lines, 2 additional isopolar contours ( 045 and / 457 ). C: projection of all receptive fields recorded in V1 of 4 animals onto an equatorial-azimuthal chart, illustrating extent of visual field represented in V1 on 1 side of brain. Each division of chart corresponds to a 107 interval of azimuths and elevations. Black circle: location of blind spot.
/ 9k13$$ju39
J761-6
06-05-97 13:33:43
neupal
LP-Neurophys
3198
M.G.P. ROSA, V. A. CASAGRANDE, T. PREUSS, AND J. H. KAAS
FIG . 4. A–F: relationship between receptive fields and recording sites at 6 parasagittal levels (A is most lateral, F is most medial) in V1 of 1 animal (‘‘Piglet’’). A–F each consist of a parasagittal section where recording sites are indicated (left), a diagram of central portion of visual field illustrating receptive fields of neurons located on superficial cortex (middle), and a chart of entire hemifield illustrating receptive fields of neurons recorded on banks of calcarine sulcus ( right). Portion of visual field magnified in middle is indicated by gray box on right. Arrows and dashed lines on sections: borders of V1. CiS, cingulate sulcus; IpS, intraparietal sulcus; LaS, lateral sulcus; P, prostriata.
/ 9k13$$ju39
J761-6
06-05-97 13:33:43
neupal
LP-Neurophys
PROSIMIAN VISUAL CORTEX
FIG.
4.
3199
(continued)
indicated according to the symbols used in Fig. 4, together with the observed value of the receptive field center eccentricity (Fig. 5B) and polar angle (Fig. 5C). On the basis of their position in the bidimensional reconstruction, isoeccen-
/ 9k13$$ju39
J761-6
tricity (Fig. 5B) and isopolar (Fig. 5C) lines are drawn, summarizing the visuotopy of V1. In the map of eccentricities (Fig. 5 B) it can be observed that there is an emphasis on the representation of central
06-05-97 13:33:43
neupal
LP-Neurophys
3200
M.G.P. ROSA, V. A. CASAGRANDE, T. PREUSS, AND J. H. KAAS
FIG . 5. Reconstruction of visuotopy of V1 in ‘‘flat’’ representations of cortical surface. A: bidimensional reconstruction of shape of V1, based on alignment of contours of layer 4 from a series of parasagittal sections (Van Essen and Maunsell 1980). To aid in localization, different regions of V1 are shaded in different tones of gray. B: map of eccentricity representation. Value of receptive field center eccentricity corresponding to each recording site illustrated in Fig. 4 is indicated (different symbols indicate different parasagittal levels illustrated in Fig. 4). On the basis of these values, isoeccentricity lines (5, 10, 20, 40, 60, and 807, left to right) were interpolated by eye to fit individual observations. C: map of polar angle representation, illustrating 5 interpolated isopolar lines ( 0607, 0307, HM, /307 and / 607, from dorsal to ventral in cortex).
/ 9k13$$ju39
06-05-97 13:33:43
neupal
LP-Neurophys
PROSIMIAN VISUAL CORTEX
3201
FIG . 6. Receptive field size (square root of receptive field area) of V1 neurons as a function of eccentricity in 1 animal (Piglet). Thick continuous line: best-fitting power function calculated on basis of a principal axis regression.
vision, with approximately half of the surface of V1 being dedicated to the representation of the central 307 of the visual field. The map of V1 in Galago seems to depart significantly from that expected on the basis of a logarithmic-conformal map (Schwartz 1977) in that a geometric progression of isoeccentricity contours does not result in lines that are separated by roughly equal distances in the cortex. For example, the distance between the 107 and 207 isoeccentricity lines is smaller than that between the 207 and 407 lines, and the distance between the 207 and 407 isoeccentricity lines is smaller than that between the 407 and 807 lines. The map of polar angles (Fig. 5C) suggests that for a given eccentricity there is relatively more magnification of those parts of the visual field near the HM than those close to the VM (see also Fig. 8). In addition, the region of V1 dedicated to the representation of the periphery of the upper quadrant is larger than that representing the periphery of the lower quadrant. Very similar results were obtained in the other animals, which had less complete sampling of the visual field representation (a summary map of another case is illustrated in Fig. 8, bottom). Quantitative analyses RECEPTIVE FIELD SIZE. It is clear from Fig. 4 that there is a marked increase of multiunit receptive field size from the central to the peripheral representation in V1 of Galago. For example, the sizes of receptive fields within the central 57 ranged from 0.87 to 2.77, whereas in the far periphery ( ú607 eccentricity) they ranged from 47 to 207. This trend is quantified in Fig. 6, which illustrates the receptive field size (square root of receptive field area) as a function of eccentricity for one animal. A power function (described by Eq. 1), calculated on the basis of a model II (principal axis) regression,
/ 9k13$$ju39
J761-6
provides a reasonable description of the relationship between eccentricity and receptive field size in V1 RF size (degrees) Å 0.57 1 eccentricity 0.69
(1)
It is noteworthy that the receptive field sizes that we find here are comparable to those found in a single-unit recording study (DeBruyn et al. 1993). CORTICAL MAGNIFICATION FACTOR. The linear cortical magnification factor (CMF) was calculated as the ratio of the distance between two points in the cortex (in mm) and the angular distance between the centers of the corresponding receptive fields (in deg) (Daniel and Whitteridge 1961). We concentrated our analysis on the case that yielded the most complete sample of V1 (Fig. 7). Distances between recording sites were measured in unfolded reconstructions. Only pairs of recording sites separated by ú1 mm and õ3 mm were used in the analysis. As implied by the surface reconstructions, statistical analysis reveals a clear relationship between eccentricity and CMF in V1 (r Å 0.88). Unlike in monkeys (Gattass et al. 1987; Van Essen et al. 1984), no difference was found between the CMF measured along different axes of V1 of Galago (e.g., parallel vs. perpendicular to the VM representation). Equation 2 describes the power function that best fits the data, calculated with the use of a principal axis regression technique CMF (mm/deg) Å 2.36 1 eccentricity 00.80
(2)
A power function, although providing a reasonable description of the variation of CMF in the paracentral and peripheral representations, cannot adequately account for the variation of CMF within the central visual field (a map generated on the basis of such a function would have an infinitely large central representation). One proposed strategy to deal with this problem is to add a constant to the
06-05-97 13:33:43
neupal
LP-Neurophys
3202
M.G.P. ROSA, V. A. CASAGRANDE, T. PREUSS, AND J. H. KAAS
FIG . 7. Cortical magnification factor (CMF), calculated between pairs of recording sites in V1, as a function of mean eccentricity of centers of receptive fields recorded at these sites in 1 animal (Piglet). Thick continuous line: best-fitting power function calculated on basis of a principal axis regression. Coarse dashed line at left: estimate of magnification factor in central representation ( õ57 ), which includes a correction factor based on size of representation of area centralis in V1 cortex (see Eq. 3).
eccentricity term (Gattass et al. 1987; Tootell et al. 1982; Van Essen et al. 1984) so that the area predicted by integration of the CMF function matches the observed area of the representation of the area centralis. This modified function (Eq. 3), shown by the dashed line in Fig. 7, predicts with reasonable accuracy the sizes and shapes of the compartments of V1 dedicated to the representation of different portions of the visual field (Fig. 8, top) CMF (mm/deg) Å 2.36 1 (eccentricity / 0.73) 00.80
(3)
POINT IMAGE SIZE. The point image size, i.e., the linear dimension of the cortical locus of all neurons representing a point of the visual field, measured parallel to the cortical layers (McIlwain 1976), was estimated as the product of the average receptive field size and magnification factor for a given eccentricity (Gattass et al. 1987; Van Essen et al. 1984). Although this calculation only provides a minimum estimate of point image size for a given eccentricity (by virtue of not taking into consideration the receptive field scatter and the sizes of the largest receptive fields), the resulting function nonetheless accurately reflects the variation of point image size in different portions of a visual area (Fiorani et al. 1989; Rosa and Schmid 1995a). As shown in Fig. 9, the point image size in V1 of Galago varies little with eccentricity, from Ç1 mm (in the representation of the central 107 ) to 0.8 mm (in the representation of the far periphery of the visual field).
/ 9k13$$ju39
J761-6
Visuotopic organization of V2 The visuotopy of the cortex immediately rostral to V1 demonstrated a homologue of V2 similar to that described in other primates (Allman and Kaas 1974; Gattass et al. 1981; Rosa et al. 1988b). Although corresponding in general with the visuotopic organization of V2 described in simians, the organization of this area in galagos (summarized in Fig. 10) does have some distinctive features. First, V2 is relatively small and narrow. In the two animals with extensive recordings, the surface area of V2 was 63 and 68 mm2 (in both cases corresponding to 31% of the surface area of V1), with a maximum width of Ç3 mm. Second, although in simians V2 has been described as wrapping around V1 almost completely (Allman and Kaas 1971; Rosa et al. 1988b), in Galago a relatively large portion of the perimeter of V1 in the calcarine sulcus is formed by less myelinated cortex (including area prostriata; Allman and Kaas 1971; Gattass et al. 1987; Sanides 1972). Third, the data suggest that the line of ‘‘field discontinuity’’ in the visual field representation in V2 is tilted relative to the HM. Whereas the dorsal portion of V2 represents most of the lower visual field, the ventral portion represents the entire upper quadrant plus a portion of the lower quadrant adjacent to the HM. The lower quadrant representation in dorsal V2 forms a mediolaterally elongated strip, extending from immediately rostral to the representation of the area centralis in V1 to the banks of the interhemispheric fissure, only invading the
06-05-97 13:33:43
neupal
LP-Neurophys
PROSIMIAN VISUAL CORTEX
FIG . 8. Summary visuotopic maps of V1 in Galago. Top: diagrammatic map based on power function describing relationship between cortical magnification factor and eccentricity (Fig. 7). Middle and bottom: summaries of data in 2 animals. Animal ‘‘Linda’’ (bottom) lacked recording sites near occipital pole, and therefore there is a gap in representation where visuotopic coordinates could not be estimated. Symbols used in representation of visuotopic coordinates are similar to those employed in Fig. 3, and are indicated in inset.
/ 9k13$$ju39
J761-6
3203
dorsal bank of the calcarine sulcus to a small extent (Figs. 10 and 11), in close agreement with the architectonic delimitation of dorsal V2 by Preuss and Goldman-Rakic (1991a). There is a clear mediolateral gradient of eccentricity representations, from lateral (central representation) to medial (peripheral representation), and nearly half of the surface area is dedicated to the central 207 of the visual field. The border between V2 and V1 is formed by the representation of the VM (e.g., Fig. 11, fields 6, 14, 21, and 28–30). In general, the recorded receptive fields move away from this meridian as the electrode is moved rostrally. However, the receptive field sequences are rather irregular, and caudalto-rostral sequences of recording sites often reveal partial reversals near the HM representation (e.g., Fig. 11, fields 16–20 and 24–27). These partial reversals, as well as changes in receptive field size and architectonic pattern, suggest that a large portion of the rostral boundary of V2 with another visually responsive area in dorsal cortex corresponds to a representation of the lower visual field near the HM, rather than corresponding exactly to the representation of the HM as in simians. For example, in Fig. 12 we illustrate results obtained in rows of penetrations that crossed the border between V2 and the presumptive dorsomedial visual area (DM) (Krubitzer and Kaas 1990) (also referred to as the dorsal visual area by Allman et al. 1979) at different mediolateral levels. In each case, the receptive fields of neurons recorded at the most rostral sites within V2 are centered below the HM, rather than coinciding with this meridian (Fig. 12, A8, B5, and C7). Our observations of ventral extrastriate areas are also consistent with the presence of V2, similar to what has been observed in simians (Fig. 13). The results demonstrate a systematic representation of the entire upper quadrant, extending across the tentorial surface and invading the lower bank of the calcarine sulcus to a small extent. In addition, rows of penetrations crossing from V2 into adjacent areas demonstrate that the rostral border of ventral V2 corresponds to a representation of a portion of the lower quadrant near the HM rather than to the HM itself (e.g., Fig. 13, fields 18–20, 31–32, and 41). The sizes of the receptive fields of neurons located in this narrow strip of lower quadrant representation are similar to those recorded in more caudal portions of dorsal and ventral V2 (Fig. 14). These observations lend support to the suggestion that the line of field discontinuity in the visuotopic map of Galago V2 is tilted relative to the HM. As shown in Figs. 10 and 13, V2 is narrowest (just under 1 mm) at the representation of the center of gaze. However, sequences of recording sites crossing dorsoventrally at this point yield no evidence for a discontinuity between the dorsal and ventral parts of V2 (Fig. 13, fields 1–7, 8–16, and 21). These data suggest that the field discontinuity in V2 corresponds to an eccentricity of õ57 (Fig. 10). In simian primates, the representation of visual field in V2 is anisotropic: a similar distance in the visual field (in deg) is represented by a distance twice as long in the cortex parallel to the V1/V2 border as perpendicular to this border (Rosa et al. 1988b). This ‘‘stretching’’ of the visual field map has been correlated with the presence of functionally distinct stripes in V2, first revealed by cytochrome oxidase histochemistry, that run perpendicular to the V1/V2 border (Roe and T’so 1995; Tootell et al. 1983). Because cyto-
06-05-97 13:33:43
neupal
LP-Neurophys
3204
M.G.P. ROSA, V. A. CASAGRANDE, T. PREUSS, AND J. H. KAAS
FIG . 9. Estimate of point image size as a function of eccentricity in V1.
chrome oxidase stripes are not present in Galago V2 (Condo and Casagrande 1990), we were interested in determining whether the representation in V2 of this species would also be anisotropic. Therefore the CMF of V2 was calculated for two animals on the basis of interpolated visuotopic maps of both dorsal and ventral V2 (Fig. 15). Different power functions were fitted to data measured between sites located along imaginary lines parallel to the V1/V2 border (CMFpl ; Eq. 4) and perpendicular to this border (CMFpd ; Eq. 5) CMFpl (mm/deg) Å 2.05 1 eccentricity 00.80
(4)
00.80
(5)
CMFpd (mm/deg) Å 0.83 1 eccentricity
This analysis reveals that, despite the absence of cytochrome oxidase stripes, there is an anisotropic representation of the visual field in Galago V2, which is as marked as that observed in simians. At all eccentricities, the magnification factor parallel to the V1/V2 border is over twice that perpendicular to this border. It should also be noted that the exponents of Eq. 4 and 5 are identical to that of the CMF function of V1 (Eq. 2). Thus, at least to a first approximation, the emphasis on central vision is similar in areas V1 and V2. Evidence for DM Recordings in dorsomedial cortex immediately rostral to V2 resulted in rows of recording sites corresponding to systematic shifts in receptive field positions (Fig. 12) in the location of the architectonically defined DM (Allman and Kaas 1975; Krubitzer and Kaas 1990). Because of histological artifacts related to the large number of long electrode penetrations in this region, we were unable to reconstruct the myeloarchitectonic borders of DM in the same animals. Nonetheless, the rostral border of DM is well defined physiologically in the anesthetized galago as a transition between neurons with vigorous visual responses and sharply defined receptive fields (in DM) and neurons that are harder to drive and that tend to have larger receptive fields (Fig. 16). The
/ 9k13$$ju39
J761-6
presumptive boundaries of DM illustrated in Figs. 12 and 16, which are based on the physiological criterion, are in good agreement with histological estimates in other animals (Preuss and Goldman-Rakic 1991a). Neurons in the presumptive DM have receptive fields that are on average larger than those for neurons in V2, although there was a considerable overlap between the samples obtained in these areas. Laterally in DM, neurons have receptive fields that include the center of gaze and the central lower quadrant, sometimes invading the ipsilateral hemifield (Fig. 12A). More centrally in this region, receptive fields cover paracentral portions of the lower quadrant, near the border with V2, and of the upper quadrant rostrally (Fig. 12B). Near the midline, the receptive fields extend to ¢607 from the center of gaze, including portions of both quadrants (Fig. 12C). Thus the cortex within our current estimate of the border of DM encompasses a representation of the entire upper quadrant, plus the lower quadrant near the HM. We have naturally wondered whether DM is an area with incomplete representation of the visual field, or whether the ‘‘missing’’ portion of the lower quadrant representation (including the periphery near the VM) is located outside the current estimated boundaries. The data clearly indicate that the lower quadrant periphery is not represented medial to the estimated boundary. Instead, the cortex medial to DM along the midline re-represents the upper quadrant, with large receptive fields (Fig. 16, fields 10–15). In addition, the cortex immediately lateral to the presumptive DM, dorsolaterally, has neurons with smaller receptive fields, which systematically represent the central lower quadrant (Fig. 16, bottom right), confirming the results of Allman et al. (1979) in the lesser galago (Galago senegalensis). Finally, as mentioned above, most of the cortex along the rostral border of DM has neurons with very different response properties in comparison with DM neurons (including large receptive fields, Fig. 16, fields 5–9 and 16–20). The exception, illustrated in Fig. 16 (fields 1–4), is a small region of cortex
06-05-97 13:33:43
neupal
LP-Neurophys
PROSIMIAN VISUAL CORTEX
3205
FIG . 10. Location and visuotopy of V2. Top: dorsolateral (left) and medial (right) views of left cerebral hemisphere of a galago, indicating location of V1, V2, and middle temporal area (MT). Bottom: region enclosed by box, shown magnified, illustrating visuotopic organization of V2 (present results) and MT (on the basis of architectonical results of Preuss and Goldman-Rakic 1991a and physiological recording data of Allman et al. 1973). Visuotopy of V2 is indicated according to symbols shown in inset (bottom). Arrows: continuity of V2 belt from lateral to medial views of cortex.
located rostrolateral to the presumptive DM border. This region, which was observed in one animal, includes a compressed representation of the lower quadrant periphery that nearly exactly complements the visual field representation in DM, with receptive fields of appropriate size for DM. Thus, although this result demands confirmation with additional experiments, it is possible that DM in galagos forms a second-order representation of the entire visual field, with a field discontinuity running ventral to the HM.
we were able to evoke visual responses from some neurons in this area (3 of 12 recording sites). Although the sample was too small to allow any conclusions regarding visuotopy, we found that the receptive fields of neurons in this area include both the central and the peripheral visual field and are large (4–6 times the diameter) in comparison with those at a comparable eccentricity in V1.
Area prostriata
Our main finding is that the visuotopic organization of V1 and V2 in the prosimian galago shares many of the features described for simian primates, suggesting that these characteristics existed in the last common ancestor of all primates. Both V1 and V2 are continuous areas, each containing a single representation of the entire visual field, with the VM at their common border. As in other primates, V1 forms a continuous (1st-order) representation with an expanded representation of central vision, whereas V2 contains a split (2nd-order) representation of the visual field. The
As mentioned above, a relatively large proportion of the perimeter of V1 (25% and 27%, in the two most extensively studied animals; see Figs. 11 and 13) was formed by agranular, poorly myelinated cortex. In terms of both location and architectonic appearance, this cortex resembles area prostriata (Allman and Kaas 1971; Sanides 1972) and the splenial visual area of cats (Kalia and Whitteridge 1973). Similar to the findings of MacLean (1966) in the squirrel monkey,
/ 9k13$$ju39
J761-6
DISCUSSION
06-05-97 13:33:43
neupal
LP-Neurophys
FIG . 11. Correlation between positions of recording sites and receptive fields in dorsal V2. Top left: bidimensional reconstruction of caudal cortex in 1 animal, illustrating extent of V2, MT, and area prostriata (estimated borders are indicated in gray). Bottom left: region enclosed by box, shown magnified, plots location of 39 recording sites in dorsal part of V2. To facilitate presentation, these sites were connected to form 7 arbitrary sequences, from lateral (1–5) to medial (37–39) in cortex. Other plots: location of receptive fields recorded from neurons at each of these sites, in diagrams of central (top row) and peripheral (right; bottom row) visual field. STS: superior temporal sulcus.
3206 M.G.P. ROSA, V. A. CASAGRANDE, T. PREUSS, AND J. H. KAAS
/ 9k13$$ju39
J761-6
06-05-97 13:33:43
neupal
LP-Neurophys
PROSIMIAN VISUAL CORTEX
3207
FIG . 12. A–C: sequences of receptive fields and recording sites crossing border between V2 and presumptive dorsomedial visual area (DM) at different mediolateral levels. A–C each illustrate a dorsal view of brain (left) indicating recording sites and estimates of borders of V1, V2, and DM. Corresponding receptive fields in V2 ( middle) and DM (right) are illustrated relative to HM and VM (thick lines) and blind spot (gray).
/ 9k13$$ju39
J761-6
06-05-97 13:33:43
neupal
LP-Neurophys
3208
M.G.P. ROSA, V. A. CASAGRANDE, T. PREUSS, AND J. H. KAAS
FIG . 13. Correlation between positions of recording sites and receptive fields in ventral V2. Left: bidimensional reconstruction of caudal cortex in 1 animal, illustrating extent of V2 and area prostriata (estimated borders indicated in gray). Middle: region enclosed by box, shown magnified, plots location of recording sites in ventral part of V2 and in other areas. To facilitate presentation, recording sites within V2 were connected to form 6 arbitrary sequences, from dorsolateral (1–7) to ventromedial (48–51) in cortex. Thick dashed line: HM representation in ventral V2. Plus and minus signs indicate whether receptive fields recorded in area rostral to V2 had centers in upper and lower quadrants, respectively. Right: location of receptive field centers recorded from neurons at each V2 site, in a diagram of contralateral visual field. Region of visual field encompassed by borders of all V2 receptive fields is indicated in light gray. Receptive fields recorded from neurons at 3 sites rostral to V2 (a–c) are also illustrated to give an indication of their size.
results also provide evidence for a homologue of area DM located anterior to V2. In addition to these findings, our data reveal some differences in the organization of V1 and V2 of galagos in comparison with simian primates. The significance of these similarities and differences in visual field representation between galagos and simians is considered in more detail below. V1: quantitative analyses One of the main discussions in the current literature regarding the visuotopy of V1 refers to whether or not the extent of the representation of different sectors of the visual field in this area is directly proportional to the ganglion cell density in different parts of the retina. Although several studies have proposed that such a direct relationship exists (e.g., Schein and De Monasterio 1987; Wa¨ssle et al. 1989),
/ 9k13$$ju39
J761-6
many others have concluded that there is a preferential representation of the fovea (or area centralis) in V1, such that the number of V1 cells representing the central visual field is much larger than that expected on the basis of the distribution of ganglion cells (Myerson et al. 1977; Perry and Cowey 1985, 1988; Rosa and Schmid 1995a; Silveira et al. 1989, 1993). The difficulty in answering this question is compounded by two main factors: the presence of a population of displaced amacrine cells in the ganglion cell layer, whose density varies less steeply with eccentricity than that of the ganglion cells, and the displacement of ganglion cells toward the foveal rim, with the consequent difficulty in determining the numbers of ganglion cells that are connected to foveal photoreceptors (Silveira et al. 1993; Wa¨ssle et al. 1989; Wilder et al. 1996). As pointed out previously (Silveira et al. 1993), nocturnal primates may be good animal models in which to study this question, given that the absence, or
06-05-97 13:33:43
neupal
LP-Neurophys
PROSIMIAN VISUAL CORTEX
3209
FIG . 14. Receptive field size of V2 neurons (pooled data from 2 animals). Gray squares: data obtained from recording sites in dorsal V2. White squares: data obtained from recording sites in ventral V2 that yielded receptive fields centered in upper quadrant or HM. Black triangles: data obtained from recording sites in ventral V2 that yielded receptive fields centered in lower quadrant. Power function that best fits data (thick continuous line): receptive field size (deg) Å 0.76 1 eccentricity 0.87 .
rudimentary nature, of the fovea in these species greatly facilitates the quantification of ganglion cell densities in the central visual field. A previous study in G. garnetti (DeBruyn et al. 1980) (note that in that study this species was referred to as Galago crassicaudatus) has demonstrated that the peak density of neurons in the ganglion cell layer is Ç11,200 cells per mm2 , and that there are õ500 cells per mm2 in the nasal periphery of the retina (90–1007 eccentricity). These estimates yield a centroperipheral gradient of 22.4:1, which contrasts sharply with a gradient of 250:1 for the areal CMF (estimated as the square of the linear magnification factor) in V1 in the same range of eccentricit-
ies. Such a large discrepancy between the two gradients is difficult to reconcile with the view of a proportional visuotopic relationship along the retinogeniculocortical pathway. The presence of displaced amacrine cells was not recognized at the time of the study of DeBruyn et al. (1980), and, as demonstrated by others (Silveira et al. 1993; Wa¨ssle et al. 1989; Wilder et al. 1996), the density profile of such cells may be very different from that of ganglion cells. Nonetheless, even allowing for a hypothetical increase in the proportion of amacrine cells from center to periphery, it is unlikely that the visuotopy of Galago V1 will directly reflect the retinal ganglion cell distribution. For example, assuming that
FIG . 15. Cortical magnification factors in V2, measured between points in cortex located along imaginary lines parallel ( n; thick continuous line) and perpendicular ( h; thick dashed line) to V1/V2 border.
/ 9k13$$ju39
J761-6
06-05-97 13:33:43
neupal
LP-Neurophys
3210
M.G.P. ROSA, V. A. CASAGRANDE, T. PREUSS, AND J. H. KAAS
FIG . 16. Receptive fields of neurons recorded in areas surrounding DM in 2 animals. Top row: dorsal views of caudal neocortex, illustrating recording sites within presumed borders of DM ( ● ) and outside DM ( s ). Second row: extent of visual field represented within estimated boundaries of DM. Third row: receptive fields of neurons recorded in sites immediately rostral to estimated border of DM. Four receptive fields that may be part of peripheral lower quadrant representation of DM (fields 1–4) are indicated in gray. Bottom left: receptive fields of neurons recorded in sites immediately medial to DM. Bottom right: extent of visual field represented in cortex immediately lateral to DM.
/ 9k13$$ju39
J761-6
06-05-97 13:33:43
neupal
LP-Neurophys
PROSIMIAN VISUAL CORTEX
in the area centralis displaced amacrine cells form Ç5% of the neuronal population of the ganglion cell layer (as in both diurnal and nocturnal simians) (Silveira et al. 1993; Wa¨ssle et al. 1989; Wilder et al. 1996), then they would need to form ú90% of the cell population in peripheral retina to yield a direct proportional relationship between retina and cortex. Thus our data suggest that galagos resemble simian primates in having a preferential representation of the area centralis in V1, in agreement with Azzopardi and Cowey’s (1993) anatomic demonstration based on transneuronal transport of retrograde tracers from the cortex to the retina. It does remain possible, however, that the visuotopy of V1 will reflect the density of a particular type of ganglion cell (Malpeli et al. 1996; Schein and de Monasterio 1987). The analysis of the cortical point image size (Fig. 9) reveals that the steep decrease of CMF with increasing eccentricity is almost exactly counterbalanced by an increase in the average receptive field size. Thus in Galago, as in the flying fox (Rosa et al. 1993a), a nearly constant number of V1 neurons is used to process stimuli located anywhere in the visual field. One interpretation of these data is that V1 is formed by physiological modules of similar size throughout the visuotopic map; these are likely to include columns responsive to both eyes and at least a full cycle of orientation columns (Hubel and Wiesel 1974). The actual point image size curve obtained for one individual with extensive mapping of V1 suggests a slight decrease (from 1.0 to 0.8 mm) of the point image size between the central and peripheral representations. It is interesting to observe that this is paralleled by changes in the distribution of cytochrome oxidase blobs in the upper layers. In Galago, as in most other primates (see Preuss and Kaas 1996 for review), V1 is characterized by a histologically defined regular modular organization, evidenced by the cytochrome oxidase blobs of the upper cortical layers (Fig. 1). There are more blobs per mm2 within the calcarine sulcus than on the dorsolateral surface (2.9 vs. 2.6 blobs/mm2 ) (Condo and Casagrande 1990), and this may indicate that the histologically defined modules are slightly smaller in the peripheral representation in comparison with the central representation. Thus the physiological and histological data converge to support the notion of a slight decrease in module size from central to peripheral V1. The slight variation of module size in Galago V1 is reminiscent of the organization demonstrated in New World primates such as the Cebus monkey and squirrel monkey (Horton and Hocking 1996; Rosa et al. 1991). In the macaque, early reports have suggested a marked variation of module size with eccentricity on the basis of both blob distribution and ocular dominance hypercolumn width (Le Vay et al. 1985; Livingstone and Hubel 1984). However, these findings have been challenged (Florence and Kaas 1992; Gattass et al. 1995), and it is presently unclear to what extent the macaque departs from the pattern observed in other primates. V1: comparative analysis On the basis of both paleontological data and studies of molecular evolution, primatologists have suggested that the lineages leading to present-day lorisiform prosimians (which include Galago) and simians have been separated at least since the Palaeocene epoch (55–66 million years ago) (Martin 1990). To put these estimates in context, it is worth
/ 9k13$$ju39
J761-6
3211
remembering that the first evidence of simians of modern aspect has only been recovered from Eocene formations ( Ç40 million years ago) (Beard et al. 1994; Godinot and Mahboubi 1992; Simons 1995). Yet, despite their remote common ancestry, previous studies have demonstrated that several aspects of the organization of V1 in galagos are similar to those observed in simians, including the pattern of termination of geniculocortical afferents relative to the cortical layers (Diamond et al. 1985; Florence and Casagrande 1987; Florence et al. 1983; Lachica and Casagrande 1992; Lachica et al. 1993), the architectonic distribution of cytochrome oxidase and calcium-binding proteins (Condo and Casagrande 1990; Johnson and Casagrande 1995), neuronal response properties (DeBruyn et al. 1993), and the pattern of projections to extrastriate cortex (Krubitzer and Kaas 1990, 1993; Symonds and Kaas 1978; Tigges et al. 1973). These data converge to suggest that the features of V1 organization common to lorisiform prosimians and simians were established early during primate evolution. The present study demonstrates that the visuotopy of Galago V1 is consistent with that observed in other mammals as far as the relative locations of central/peripheral and upper/lower visual field representations are concerned. Nonetheless, the data also demonstrate some characteristics that are intermediate between those of nonprimate mammals on one hand and simian primates on the other. These include the size of V1 relative to body size, the degree of emphasis on representation of central vision, and the topographic relationship between areas V1, V2, and prostriata. Many authors have suggested that primates as a group, and simians in particular, are highly dependent on vision for telereception. Attempts to define primates as a natural group distinct from other mammals commonly mention that ‘‘the visual sense is greatly emphasised’’ (Martin 1990; see also Polyak 1957) and contain references to an ‘‘elaboration and perfection of the visual apparatus’’ (Le Gros Clark 1959). In agreement with this notion, a previous study (Rosa et al. 1993a) has demonstrated that the surface area of V1 of both simian and prosimian primates is significantly larger than that of nonprimates of similar body mass. The present data indicate that the surface area of V1 in G. garnetti ( Ç200 mm2 ) is 2–3 times as large as would be expected in comparison with nocturnal nonprimates of similar body size, such as ferrets (Law et al. 1988) and hedgehogs (Kaas et al. 1970). Yet, despite the similarities in functional architecture, it is also apparent that V1 in the galago is relatively small in comparison with that of simians. To what extent is the ‘‘intermediate’’ condition of V1 in galagos a reflection of adaptations to a nocturnal niche? A relevant comparison can be drawn with the nocturnal owl monkey, which is similar to G. garnetti in terms of body mass and density of retinal ganglion cells (DeBruyn et al. 1980). As in Galago, the striate cortex of owl monkeys differs from that of diurnal simians in a number of aspects, including a relatively small surface area (286–400 mm2 ) (Myerson et al. 1977; Tootell et al. 1985), which corresponds to about half of that in the similarly sized but diurnal squirrel monkey (Cowey 1964). Thus it is likely that adaptations to nocturnal lifestyles are a major factor determining the relative size of visual areas. For example, the size of V1 might be correlated with the number of ganglion cells projecting centrally and with the convergence ratio along
06-05-97 13:33:43
neupal
LP-Neurophys
3212
M.G.P. ROSA, V. A. CASAGRANDE, T. PREUSS, AND J. H. KAAS
the visual pathway, factors that may differ in nocturnal versus diurnal species. As demonstrated by studies comparing the retina and lateral geniculate nucleus of feral and domestic animals of the same genus, these characteristics can be regulated by developmental processes in such a way that vast quantitative changes can occur in a relatively small number of generations (Peichl 1992; Williams et al. 1993). Given the possibility that the volume of visual areas is a labile character, in evolutionary terms, is there any reason to suspect that the relatively small size of V1 (and other areas) in Galago reflects a lesser degree of differentiation in comparison with simians? Although nocturnality is clearly an important element, the fact remains that presently published figures suggest that the surface area of V1 in the owl monkey is still ¢40% larger than that in the galago. Both the owl monkey and the galago are present-day representatives of what seem to be long-standing but independent lineages of nocturnal primates that can be traced back at least 15 million years (McCrossin 1992; Setoguchi and Rosenberger 1987). In view of the relative rapidity with which quantitative changes in the visual pathway can occur, it is unlikely that the differences between the owl monkey and the galago could be solely attributed to the fact that the owl monkey probably descended from diurnal ancestors (e.g., Hoffstetter 1982). In theory, it is possible that in the course of the evolutionary process leading to present-day simians further quantitative changes in the retinogeniculostriate pathway occurred, possibly related to the reduction in the olfactory apparatus and increasing reliance on vision among simians (Cave 1973; Le Gros Clark 1959; see Martin 1990 for a review), or that new neuronal circuits were added to simian striate cortex after the divergence from the prosimian lineages. Alternatively, given that the brains of simians tend to be larger overall than those of size-matched prosimians, the larger surface of visual areas may be pleiotropic, being the result of a developmental regulatory process affecting the entire brain rather than targeting the visual apparatus in particular. Morphometric studies of the retina and other visual structures in diurnal prosimians could help clarify these questions. Analysis of the data also demonstrates that the emphasis on central vision representation in V1 of Galago is less marked than that observed in simians. One simple index for comparing this across different species is the proportion of the surface area of V1 dedicated to the representation of the central 107 of the visual field. Whereas in diurnal simians ranging from marmosets to humans this portion of the visual field occupies 50–60% of the surface area of V1 (Fritsches and Rosa 1996), in G. garnetti it corresponds to only 20– 22% of the total V1 surface (Fig. 8). The proportion observed in Galago is even smaller than that reported in the nocturnal owl monkey (30%) (Allman and Kaas 1971), but approaches that found in nonprimates with well-developed vision such as cats (20%) (Tusa et al. 1978). It is interesting to observe that the peak resolution of the visual system of galagos is very similar to the cat’s, and about half of that in the owl monkey (Bonds et al. 1987; Langston et al. 1986). In primates (including galagos) the unfolded surface of V1 forms an ellipse with the major axis parallel to the representation of the HM (e.g., Daniel and Whitteridge 1961; see Fritsches and Rosa 1996 for a review). In these species, the representation of the VM in V1 bows out markedly, forming
/ 9k13$$ju39
J761-6
an ‘‘apex’’ that corresponds to the representation of the fovea or area centralis (e.g., Dow et al. 1985; Tootell et al. 1988). Although similar to other primates, the present data suggest that these characteristics are less marked in Galago than in simians, both diurnal and nocturnal (Fig. 17). In marked contrast, in most (if not all) nonprimates the longer axis of V1 is parallel to the VM, and the representation of the area centralis does not protrude toward V2 (Choudhury 1978; Hughes 1971; Kaas et al. 1970, 1972a,b, 1989; Law et al. 1988; Lo¨wel 1987; Picanc¸o-Diniz et al. 1991; Rosa et al. 1993a; Sousa et al. 1978; Tusa et al. 1978; Wagor et al. 1980). Several authors have correlated the overall shape of V1 with the functional architecture for ocular dominance, suggesting that the map tends to be elongated perpendicular to the preferred orientation of ocular dominance stripes (e.g., Anderson et al. 1988; Lo¨wel et al. 1988; Rosa et al. 1988a, 1992; Tootell et al. 1982, 1988). Information on the layout of ocular dominance columns in galagos is still sketchy (Glendenning et al. 1976). However, given the shape of striate cortex and the isotropic CMF we observed in this area, one expects that a more complete study of these animals will reveal a system of bands less regularly oriented than that observed in simian primates. The border relationship of V1 with V2 and area prostriata also differs markedly between simian primates and nonprimates ( Fig. 17 ) . In both nocturnal and diurnal simians, V2 wraps around V1 almost completely, with a relatively small area prostriata, located at the rostral end of the calcarine sulcus, forming only Ç10% of the perimeter of V1 ( Allman and Kaas 1971; Gattass et al. 1981, 1987; MacLean 1966; Rosa et al. 1988b; Van Essen et al. 1984 ) . In contrast, in nonprimates, visually responsive ‘‘limbic’’ agranular cortex located medial to V1 may form over half of the perimeter ( e.g., Kaas et al. 1989; Kalia and Whitteridge 1973; McConnell and LeVay 1986; Rosa et al. 1995 ) . Here again, the pattern revealed by our experiments suggests an intermediate condition in Galago : V2 forms about three-quarters of the perimeter of V1, with the remaining quarter being formed by area prostriata. Studies of interhemispheric connections in galagos reveal that projecting cells are distributed well within V1, much as in nonprimates, rather than being restricted to the immediate vicinity of the border of this area, as in simians ( Beck and Kaas 1994; Cusick et al. 1984; Kennedy et al. 1986 ) . This anatomic organization may be reflected in the presence of a representation of the ipsilateral hemifield near the VM, as revealed by our experiments ( Fig. 3C ) . Organization of V2 We propose that the visuotopic map in Galago V2 is a second-order representation of the visual field, featuring a field discontinuity that does not exactly correspond to the HM. Given the existence of other plausible interpretations of the data, we acknowledge that the issue of the exact location of the field discontinuity and anterior border of V2 should be considered a hypothesis to be tested by further studies. One reasonable alternative is that, as in simians (e.g., Allman and Kaas 1974; Gattass et al. 1981), the rostral border of V2 in galagos is coincident with the representation of the HM. Purely on the basis of the progression of the receptive field centers (Figs. 11–13), one might argue that
06-05-97 13:33:43
neupal
LP-Neurophys
PROSIMIAN VISUAL CORTEX
3213
FIG . 17. Topographic relationships of V1, V2, and prostriata in a hypothetical nonprimate, Galago, and a hypothetical simian primate.
the border of dorsal V2 could be placed more rostrally (e.g., around Fig. 12, A10, B8, and C10), leaving V2 directly abutting the upper quadrant representation in DM, and that the border of ventral V2 could be placed more caudally, therefore excluding the sector of lower quadrant representation. Although the myeloarchitecture of ventral cortex suggests that the sector of lower quadrant representation near the rostral border of V2 is part of V2, this is a narrow strip of cortex, and there is a degree of uncertainty in determining the border. Thus the histological evidence alone is not definitive. However, the sizes of the receptive fields of neurons recorded in this transitional region of lower quadrant representation are well within the range of those found in other parts of V2 (Fig. 14), and they are much smaller than the ones recorded in the more rostrally located area (which may be a homologue of the ventral posterior area). Furthermore, sequences of recording sites extending rostral to this transitional region reverted to re-represent the upper quadrant, rather than advancing further into the lower quadrant. Excluding the lower quadrant transitional region from ventral V2 would therefore leave us with a narrow area that only represented a sector of the lower visual field near the HM. In view of these arguments, we believe that the balance of evidence in ventral cortex favors the interpretation that there is some lower quadrant representation forming the rostral border of ventral V2. This, combined with the (admittedly subtle) transitions in receptive field size between dorsal V2 and DM tending to occur below the HM, and the evidence on the organization of DM itself (see below), suggest the model of organization of V2 summarized in Fig. 10. The ‘‘split representation’’ tilted relative to the HM is reminiscent of the proposal of Gattass et al. (1988) for macaque V4. One feasible experiment to test these hypotheses would be to combine, in the same animals, electrophysiological recordings across the rostral border of V2 and examination of transitions in the laminar patterns of connections after tracer injections in other visual areas. If the hypothesis depicted in Fig. 10 is correct, one would expect that the sector of lower field representation that we propose to be part of ventral V2 will show the same laminar patterns of labeled cells and terminals as other parts of V2, and that the connectional boundary between V2 and DM will correspond to the representation of a point below the HM.
/ 9k13$$ju39
J761-6
Another possibility is that the impression of a tilted field discontinuity at the rostral border of V2 is due to error in measurement, specifically, in our estimates of the location of the area centralis and the HM. For example, the eyes of cats rotate during paralysis, and a correction is necessary when measuring the polar angles of receptive fields relative to the screen (Cooper and Pettigrew 1979). Fortunately, there are good reasons to believe that this was not a serious factor in our experiments. Although there is some degree of error in interpolating the HM on the basis of the positions of the area centralis and optic disk, any error would be similar for all visual areas. Yet the receptive fields recorded in V1 (often in the same penetrations) result in a visuotopic map in which 1) the center of the visual field coincides well with the apex of the curvature of the border of V1 in lateral cortex and 2) there is no evidence of a large asymmetry between the representations of the upper and lower quadrants. If anything, the mild asymmetry we observed in V1 (the periphery of the upper quadrant being more magnified than that of the lower quadrant; Figs. 5 and 8), which may be due to rotation of the stimulated eye, would point to an error in the opposite direction. Furthermore, given the extent of the receptive fields recorded in V1 (Fig. 3C), a rotation of our frame of coordinates to bring the HM into alignment with the most ventral receptive fields recorded in ventral V2 (Fig. 13, fields 20, 31, and 41) would result in a large invasion of the ipsilateral hemifield in the upper quadrant representation and a lack of representation of the VM in the lower quadrant. It is interesting to note that a field discontinuity oblique relative to the HM was also demonstrated in V2 of megachiropteran bats (Rosa et al. 1994), animals that are considered by many authors to be members of one of the possible sister groups of Order Primates (Pettigrew et al. 1989; Rosa and Schmid 1994; see also Fig. 1 of Preuss and Kaas 1996). A similar visuotopic pattern, with ventral V2 representing the entire upper quadrant plus parts of the lower quadrant, may also exist in other nonprimates, such as tree shrews and squirrels (for discussion, see Rosa et al. 1994). Thus the pattern whereby the upper and lower quadrants are almost perfectly segregated into ventral and dorsal V2, respectively, may be unique to simian primates (Allman and Kaas 1974; Cowey 1964; Gattass et al. 1981; Rosa et al. 1988b). The
06-05-97 13:33:43
neupal
LP-Neurophys
3214
M.G.P. ROSA, V. A. CASAGRANDE, T. PREUSS, AND J. H. KAAS
data in galagos also suggest a partial overlap between the sectors of the visual field represented in dorsal and ventral V2, as demonstrated for capuchin and marmoset monkeys (Rosa and Schmid 1995b; Rosa et al. 1988b). Our results suggest that V2 in galagos is formed by a continuous belt of variable width, as in other primates. These electrophysiological data are consistent with previous architectonic studies in this and other prosimians (Krubitzer and Kaas 1990; Preuss and Goldman-Rakic 1991a; Preuss et al. 1993), but do not support the view of Sereno and Allman (1991), who proposed that V2 in Galago is formed by two islands of cortex separated by another area that represents both the upper and lower visual quadrants. Although the brief nature of the latter report makes a comparison of data difficult, we can propose at least two reasons why the impression of a physically segregated V2 may arise. First, V2 in Galago is very narrow at the representation of the area centralis (just 1 mm wide, or slightly less), and it is difficult to obtain a number of recording sites from this region unless long penetrations tangential to the lateral cortex are used (as in Fig. 13). This introduces an element of uncertainty in the interpretation of the data. Second, because of the fact that the field discontinuity in Galago V2 may be tilted relative to the HM, recordings from neurons in ventrolateral cortex, just over 1 mm from the V1 border, show evidence of receptive fields with centers below the HM. It would be natural to interpret these recordings as evidence of an additional visual area in ventrolateral cortex, except for the fact, as argued above, that this strip of cortex only represents a small part of the lower quadrant adjacent to the HM. Analysis of CMF in Galago V2 revealed an anisotropy similar to that described in simian primates (Roe and T’so 1995; Rosa et al. 1988b). An elongation of the visuotopic map parallel to the V1/V2 border has also been demonstrated in other species lacking cytochrome oxidase stripes, such as the cat and flying fox, and therefore this seems to be a general feature of mammalian V2 (see Rosa et al. 1994 for review). It is possible that the anisotropy in V2 of nonsimian species is due to the presence of regular stripelike functional modules that are not revealed by the cytochrome oxidase stain. For example, in the cat, transneuronal transport of anterograde tracers injected in the eye reveals a pattern of appropriately oriented stripes in V2 (Anderson et al. 1988).
lensis (Allman et al. 1979) has proposed the existence of a dorsal visual area (area D) in the approximate location of DM. In agreement with this report, we found that the dorsomedial cortex includes representations of both the upper and lower contralateral quadrants (Fig. 12), and that the rostral border of this area is formed by a representation of the VM. However, in contrast with these previous results, our data suggest that much of the lower quadrant representation is located caudal to the upper quadrant representation, rather than being entirely lateral to it. Another difference is that the cortex along the banks of the interhemispheric fissure was included in the dorsal area of G. senegalensis, whereas our data indicate that this region forms a representation of the upper quadrant that is distinct from that of DM. At least in part, these discrepancies could be related to the different species used (note, for example, that G. senegalensis is 3– 4 times smaller, in terms of body mass, than G. garnetti). On the basis of the fact that their recordings suggested an area where the lower quadrant representation was lateral to the upper quadrant representation, Allman et al. (1979) suggested that area D might be homologous to the medial visual area (area M) of owl monkeys. Given that subsequent research has demonstrated that there are significant interspecies differences in the visuotopic organization of DM (Rosa and Schmid 1995b; see Rosa 1997 for a review), the nowextensive anatomic evidence for a homologous DM in many primate species (see above), and the fact that we found another visually responsive area medial to the presumptive DM, it seems more likely that both DM and area M are present in galagos. If so, the argument is strengthened that DM is a visual area that emerged early in primate evolution and has been retained in most primates, including humans. We also found that recording sites rostral to V2 in lateral cortex yield neurons with receptive fields centered in the lower quadrant, and that neurons at recording sites rostral to V2 in ventral cortex yield receptive fields centered in the upper quadrant (Figs. 13 and 16). Although it is clear that more data are needed, these results are compatible with the previous suggestion, made on the basis of anatomic connections, that there is a homologue of the dorsolateral area in lorisiform prosimians (Krubitzer and Kaas 1990; Preuss et al. 1993).
Homologue of DM?
The term ‘‘prostriata’’ was originally used by Sanides (1972) to describe a part of the cortex bordering V1 that is less granular and less myelinated than area 18. The marked difference in appearance of the two fields (Allman and Kaas 1971; Gattass et al. 1987) helped dispel the idea that V2 completely surrounds V1. Area prostriata of primates has long been thought to have visual functions (e.g., MacLean 1966; Sanides 1972), but compelling evidence has been difficult to obtain. Recent anatomic tracing experiments have demonstrated that prostriata projects to visual areas, including V1 and the medial superior temporal area (Rosa et al. 1993b; Sousa et al. 1991). Present results add to this story in that neurons in only a few sites in area prostriata respond to visual stimuli. Yet, visual responses were obtained, and the receptive fields did not correspond to the visuotopy of V2. In particular, neurons had receptive fields that included central vision, a feature incompatible with the visuotopy of
DM is a subdivision of extrastriate cortex first described in owl monkeys (Allman and Kaas 1975). Microelectrode recordings allowed a systematic map of the contralateral hemifield to be related to a strip of relatively heavy myelination located rostral to dorsomedial V2. More recently, the visual topography of DM has been demonstrated in a diurnal New World monkey, the marmoset (Rosa and Schmid 1995b), and anatomic criteria such as cortical architecture and the pattern of connections with V1 and the middle temporal area (Krubitzer and Kaas 1990, 1993; Vogt-Weisenhorn et al. 1995; Wagor et al. 1975; Weller et al. 1991) have been used to support the hypothesis that DM is present in Old World monkeys and prosimians as well (Stepniewska and Kaas 1996). A previous study of the cortex rostral to V2 in G. senega-
/ 9k13$$ju39
J761-6
Area prostriata
06-05-97 13:33:43
neupal
LP-Neurophys
PROSIMIAN VISUAL CORTEX
the ends of the V2 belt. In nonprimate mammals, cortex medial to V1, which is topologically equivalent to prostriata, receives inputs from V1 and is visually responsive (Choudhury 1978; Dra¨ger 1974; Kaas et al. 1989; Kalia and Whitteridge 1973; Law et al. 1988; Malach 1989; McConnell and LeVay 1986; Montero 1993; Olavarria and Montero 1984, 1990; Rosa et al. 1995; Sanderson et al. 1991; Sesma et al. 1984; Tiao and Blakemore 1976; Wagor et al. 1980). As noted above, this splenial visual region, which possibly contains the homologue of prostriata, is more expansive in nonprimates than in primates. However, prostriata is relatively larger in galagos than in simian primates, possibly reflecting a more primitive condition. Area prostriata seems to be part of the medial limbic system, and as such would be expected to have quite different functions from the visual areas of the occipital, parietal, and lateral temporal lobes related to perception (MacLean 1966). The authors thank Dr. A. B. Bonds for making laboratory facilities available to us, Dr. David Pow for allowing access to a microscope and video capture system, R. Tweedale for comments on many versions of this manuscript, and Prof. J. D. Pettigrew for making this collaborative project possible. This work was supported by Australian National Health and Medical Research Council Grants 910423 and 961144 and National Eye Institute Grants EY-01778 and EY-02686. Address for reprint requests: M. Rosa, Vision, Touch and Hearing Research Centre, Department of Physiology and Pharmacology, The University of Queensland, QLD 4072, Australia. Received 23 September 1996; accepted in final form 25 February 1997. REFERENCES ALLMAN, J., CAMPBELL, C.B.G., AND MC GUINNESS, E. The dorsal third tier area in Galago senegalensis. Brain Res. 179: 355–361, 1979. ALLMAN, J. M. AND KAAS, J. H. Representation of the visual field in striate and adjoining cortex of the owl monkey (Aotus trivirgatus). Brain Res. 35: 89–106, 1971. ALLMAN, J. M. AND KAAS, J. H. The organization of the second visual area (V II) in the owl monkey: a second order transformation of the visual hemifield. Brain Res. 76: 247–265, 1974. ALLMAN, J. M. AND KAAS, J. H. The dorsomedial cortical visual area: a third tier area in the occipital lobe of the owl monkey (Aotus trivirgatus). Brain Res. 100: 473–487, 1975. ALLMAN, J. M., KAAS, J. H., AND LANE, R. H. The middle temporal area (MT) in the bushbaby, Galago senegalensis. Brain Res. 57: 197–202, 1973. ANDERSON, P. A., OLAVARRIA, J., AND VAN SLUYTERS, R. C. The overall pattern of ocular dominance bands in cat visual cortex. J. Neurosci. 8: 2183–2200, 1988. AZZOPARDI, P. AND COWEY, A. Preferential representation of the fovea in the primary visual cortex. Nature Lond. 361: 719–721, 1993. BEARD, K. C., QI, T., DAWSON, M. R., WANG, B., AND LI, C. A diverse new primate fauna from the middle Eocene fissure-fillings in southeastern China. Nature Lond. 368: 586–587, 1994. BECK, P. D. AND KAAS, J. H. Interhemispheric connections of neonatal owl monkeys (Aotus trivirgatus) and galagos (Galago crassicaudatus). Brain Res. 651: 57–75, 1994. BONDS, A. B., CASAGRANDE, V. A., NORTON, T. T., AND DEBRUYN, E. J. Visual resolution and sensitivity in a nocturnal primate (galago) measured with visual evoked potentials. Vision Res. 27: 845–857, 1987. CASAGRANDE, V. A. AND NORTON, T. T. Lateral geniculate nucleus: a review of its physiology and function. In: Vision and Visual Dysfunction: The Neural Basis of Visual Function, edited by A. Leventhal. London: Macmillan, 1991, vol. 4, p. 41–84. CAVE, A.J.E. The primate nasal fossa. Biol. J. Linn. Soc. 5: 377–387, 1973. CHOUDHURY, B. P. Retinotopic organization of the guinea pig’s visual cortex. Brain Res. 144: 19–29, 1978. CONDO, G. J. AND CASAGRANDE, V. A. Organization of cytochrome oxidase
/ 9k13$$ju39
J761-6
3215
staining in the visual cortex of nocturnal primates (Galago crassicaudatus and Galago senegalensis). J. Comp. Neurol. 293: 632–645, 1990. COOPER, M. L. AND PETTIGREW, J. D. The decussation of the retinothalamic pathway in the cat, with a note on the major meridians of the cat’s eye. J. Comp. Neurol. 187: 285–312, 1979. COWEY, A. Projection of the retina on to striate and prestriate cortex in the squirrel monkey, Saimiri sciureus. J. Neurophysiol. 27: 366–393, 1964. CUSICK, C. G., GOULD, H.J.I., AND KAAS, J. H. Interhemispheric connections of visual cortex of owl monkeys (Aotus trivirgatus), marmosets (Callithrix jacchus), and galagos (Galago crassicaudatus). J. Comp. Neurol. 230: 311–336, 1984. DANIEL, P. M. AND WHITTERIDGE, D. The representation of the visual field on the cerebral cortex in monkeys. J. Physiol. Lond. 159: 203–221, 1961. DEBRUYN, E. J., CASGRANDE, A., BECK, P. D., AND BONDS, A. B. Visual resolution and sensitivity of single cells in the primary visual cortex (V1) of a nocturnal primate (bush baby): correlations with cortical layers and cytochrome oxidase patterns. J. Neurophysiol. 69: 3–18, 1993. DEBRUYN, E. J., WISE, V. L., AND CASAGRANDE, V. A. The size and topographic arrangement of retinal ganglion cells in the galago. Vision Res. 20: 315–327, 1980. DIAMOND, I. T., CONLEY, M., ITOH, K., AND FITZPATRICK, D. Laminar organization of geniculocortical projections in Galago senegalensis and Aotus trivirgatus. J. Comp. Neurol. 242: 584–610, 1985. DOW, B. M., VAUTIN, R. G., AND BAUER, R. The mapping of visual space onto foveal striate cortex in the macaque monkey. J. Neurosci. 5: 890– 902, 1985. DRA¨ GER, U. C. Receptive fields of single cells and topography in mouse visual cortex. J. Comp. Neurol. 160: 269–290, 1974. FIORANI, M., GATTASS, R., ROSA, M.G.P., AND SOUSA, A.P.B. Visual area MT in the Cebus monkey: location, visuotopic organization, and variability. J. Comp. Neurol. 287: 98–118, 1989. FLORENCE, S. L. AND CASAGRANDE, V. A. Organization of individual afferent axons in layer IV of striate cortex in a primate. J. Neurosci. 7: 3850– 3868, 1987. FLORENCE, S. L. AND KAAS, J. H. Ocular dominance columns in area 17 of Old World macaque and talapoin monkeys: complete reconstructions and quantitative analyses. Visual Neurosci. 8: 449–462, 1992. FLORENCE, S. L., SESMA, M. A., AND CASAGRANDE, V. A. Morphology of geniculo-striate afferents in a prosimian primate. Brain Res. 270: 127– 130, 1983. FRITSCHES, K. A. AND ROSA, M.G.P. Visuotopic organisation of striate cortex in the marmoset monkey (Callithrix jacchus). J. Comp. Neurol. 372: 264–282, 1996. GALLYAS, F. Silver staining of myelin by means of physical development. Neurol. Res. 1: 203–209, 1979. GATTASS, R., FARIAS, M. F., PIN˜ON, M. C., AND UNGERLEIDER, L. G. Distribution of cytochrome-oxidase-rich patches in the primary visual cortex of macaque monkeys. Soc. Neurosci. Abstr. 21: 395, 1995. GATTASS, R., GROSS, C. G., AND SANDELL, J. H. Visual topography of V2 in the macaque. J. Comp. Neurol. 201: 519–539, 1981. GATTASS, R., SOUSA, A.P.B., AND GROSS, C. G. Visuotopic organization and extent of V3 and V4 of the macaque. J. Neurosci. 8: 1831–1845, 1988. GATTASS, R., SOUSA, A.P.B., AND ROSA, M.G.P. Visual topography of V1 in the Cebus monkey. J. Comp. Neurol. 259: 529–548, 1987. GLENDENNING, K. K., KOFRON, E. A., AND DIAMOND, I. T. Laminar organization of projections of the lateral geniculate nucleus to the striate cortex in Galago. Brain Res. 105: 538–546, 1976. GODINOT, M. AND MAHBOUBI, M. Earliest known simian primate found in Algeria. Nature Lond. 357: 324–326, 1992. HOFFSTETTER, R. Les primates Simiiformes (Anthropoidea). Comprehe´nsion, phyloge´nie, histoire bioge´ographique. Ann. Paleontol. 68: 241–290, 1982. HORTON, J. C. AND HOCKING, D. R. Anatomical demonstration of ocular dominance columns in striate cortex of the squirrel monkey. J. Neurosci. 16: 5510–5522, 1996. HUBEL, D. H. AND WIESEL, T. N. Uniformity of monkey striate cortex: a parallel relationship between field size, scatter, and magnification factor. J. Comp. Neurol. 158: 295–306, 1974. HUGHES, A. Topographical relationships between the anatomy and physiology of the rabbit visual system. Doc. Ophthalmol. 30: 33–159, 1971. IRVIN, G. E., CASAGRANDE, V. A., AND NORTON, T. T. Center/surround relationships of magnocellular, parvocellular, and koniocellular relay
06-05-97 13:33:43
neupal
LP-Neurophys
3216
M.G.P. ROSA, V. A. CASAGRANDE, T. PREUSS, AND J. H. KAAS
cells in primate lateral geniculate nucleus. Visual Neurosci. 10: 363– 373, 1993. JERISON, H. J. Brain, body and encephalization in early primates. J. Hum. Evol. 8: 615–635, 1979. JOHNSON, J. K. AND CASAGRANDE, V. A. Distribution of calcium-binding proteins within the parallel visual pathways of a primate (Galago crassicaudatus). J. Comp. Neurol. 356: 238–260, 1995. KAAS, J., HALL, W. C., AND DIAMOND, I. T. Cortical visual areas I and II in the hedgehog: the relation between evoked potential maps and architectonic subdivisions. J. Neurophysiol. 33: 595–615, 1970. KAAS, J. H., HALL, W. C., AND DIAMOND, I. T. Visual cortex of the grey squirrel (Sciurus carolinensis): architectonic subdivisions and connections from the visual thalamus. J. Comp. Neurol. 145: 273–305, 1972a. KAAS, J. H., HALL, W. C., KILLACKEY, H., AND DIAMOND, I. T. Visual cortex of the tree shrew (Tupaia glis): architectonic subdivisions and representation of the visual field. Brain Res. 42: 491–496, 1972b. KAAS, J. H., KRUBITZER, L. A., AND JOHANSON, K. L. Cortical connections of areas 17 (V-I) and 18 (V-II) of squirrels. J. Comp. Neurol. 281: 426– 446, 1989. KALIA, M. AND WHITTERIDGE, D. The visual areas in the splenial sulcus of the cat. J. Physiol. Lond. 232: 275–283, 1973. KENNEDY, H., DEHAY, C., AND BULLIER, J. Organization of the callosal connections of visual areas V1 and V2 in the macaque monkey. J. Comp. Neurol. 247: 398–415, 1986. KRUBITZER, L. A. AND KAAS, J. H. Cortical connections of MT in four species of primates: areal, modular, and retinotopic patterns. Visual Neurosci. 5: 165–204, 1990. KRUBITZER, L. A. AND KAAS, J. H. The dorsomedial visual area of owl monkeys: connections, myeloarchitecture, and homologies in other primates. J. Comp. Neurol. 334: 497–528, 1993. LACHICA, E. A., BECK, P. D., AND CASAGRANDE, V. A. Intrinsic connections of layer III of striate cortex in squirrel monkey and bush baby: correlation with patterns of cytochrome oxidase. J. Comp. Neurol. 329: 163–187, 1993. LACHICA, E. A. AND CASAGRANDE, V. A. Direct W-like geniculate projections to the cytochrome oxidase (CO) blobs in primate visual cortex. J. Comp. Neurol. 319: 141–158, 1992. LANGSTON, A., CASAGRANDE, V. A., AND FOX, R. Spatial resolution of the Galago. Vision Res. 26: 791–796, 1986. LAW, M. I., ZAHS, K. R., AND STRYKER, M. P. Organization of primary visual cortex (area 17) in the ferret. J. Comp. Neurol. 278: 157–180, 1988. LE GROS CLARK, W. E. The Antecedents of Man. Edinburgh: Edinburgh Univ. Press, 1959. LEVAY, S., CONNOLY, M., HOUDE, J., AND VAN ESSEN, D. C. The complete pattern of ocular dominance stripes in the striate cortex and visual field of the macaque monkey. J. Neurosci. 5: 486–501, 1985. LIVINGSTONE, M. S. AND HUBEL, D. H. Anatomy and physiology of a color system in the primate visual cortex. J. Neurosci. 4: 309–356, 1984. LO¨ WEL, S. The pattern of ocular dominance columns in flat-mounts of the cat visual cortex. Exp. Brain Res. 68: 661–666, 1987. LO¨ WEL, S., BISCHOF, H. J., LEUTENECKER, B., AND SINGER, W. Topographic relations between ocular dominance and orientation columns in the cat striate cortex. Exp. Brain Res. 71: 33–46, 1988. MACLEAN, P. D. The limbic and visual cortex in phylogeny: further insights from anatomic and microelectrode studies. In: Evolution of the Forebrain, edited by R. Hassler and H. Stephan. Stuttgart, Germany: Thieme, 1966, p. 443–453. MALACH, R. Patterns of connections in rat visual cortex. J. Neurosci. 9: 3741–3752, 1989. MALPELI, J. G., LEE, D., AND BAKER, F. H. Laminar and retinotopic organization of the macaque lateral geniculate nucleus: magnocellular and parvocellular magnification functions. J. Comp. Neurol. 375: 363–377, 1996. MARTIN, R. D. Primate Origins and Evolution. London: Chapman & Hall, 1990. MCCONNELL, S. K. AND LEVAY, S. Anatomical organization of the visual system of the mink, Mustela vison. J. Comp. Neurol. 250: 109–132, 1986. MCCROSSIN, M. L. New species of bushbaby from the middle Miocene of Maboko Island, Kenya. Am. J. Phys. Anthropol. 89: 215–233, 1992. MC ILWAIN, J. T. Large receptive fields and spatial transformations in the visual system. Int. Rev. Physiol. 10: 223–248, 1976. MONTERO, V. M. Retinotopy of cortical connections between the striate
/ 9k13$$ju39
J761-6
cortex and extrastriate visual areas in the rat. Exp. Brain Res. 94: 1–15, 1993. MYERSON, J., MANIS, P. B., MIEZIN, F. M., AND ALLMAN, J. M. Magnification in striate cortex and retinal ganglion cell layer of owl monkey: a quantitative comparison. Science Wash. DC 198: 855–857, 1977. NORTON, T. T. AND CASAGRANDE, V. A. Laminar organization of receptivefield properties in lateral geniculate nucleus of bush baby (Galago crassicaudatus). J. Neurophysiol. 47: 715–741, 1982. NORTON, T. T., CASAGRANDE, V. A., IRVIN, G. E., SESMA, M. A., AND PETRY, H. M. Contrast-sensitivity functions of W-, X-, and Y-like relay cells in the lateral geniculate nucleus of the bush baby, Galago crassicaudatus. J. Neurophysiol. 59: 1639–1656, 1988. OLAVARRIA, J. AND MONTERO, V. M. Relation of callosal and striate-extrastriate cortical connections in the rat: morphological definition of extrastriate visual areas. Exp. Brain Res. 54: 240–252, 1984. OLAVARRIA, J. AND MONTERO, V. M. Elaborate organization of visual cortex in the hamster. Neurosci. Res. 8: 40–47, 1990. PAYNE, B. R. Representation of the ipsilateral visual field in the transition zone between areas 17 and 18 of the cat’s cerebral cortex. Visual Neurosci. 4: 445–474, 1990. PEICHL, L. Topography of ganglion cells in the dog and wolf retina. J. Comp. Neurol. 324: 603–620, 1992. PERRY, V. H. AND COWEY, A. The ganglion cell and cone distributions in the monkey’s retina: implications for central magnification factor. Vision Res. 25: 1795–1810, 1985. PERRY, V. H. AND COWEY, A. The lengths of the fibres of Henle in the retina of macaque monkeys: implications for vision. Neuroscience 25: 225–236, 1988. PETTIGREW, J. D., COOPER, M. L., AND BLASDEL, G. G. Improved use of tapetal reflection for eye-position monitoring. Invest. Ophthalmol. Visual Sci. 18: 490–495, 1979. PETTIGREW, J. D., JAMIESON, B.G.M., ROBSON, S. K., HALL, L. S., MCANALLY, K. I., AND COOPER, H. M. Phylogenetic relations between microbats, megabats and primates (Mammalia: Chiroptera and Primates). Philos. Trans. R. Soc. Lond. B Biol. Sci. 325: 489–559, 1989. PICANC¸ O-DINIZ, C. W., SILVEIRA, L.C.L., DE CARVALHO, M.S.P., AND OSWALDO-CRUZ, E. Contralateral visual field representation in area 17 of the cerebral cortex of the agouti: a comparison between the cortical magnification factor and the retinal ganglion cell distribution. Neuroscience 44: 325–333, 1991. POLYAK, S. The Vertebrate Visual System. Chicago, IL: Univ. of Chicago Press, 1957. PREUSS, T. M., BECK, P. D., AND KAAS, J. H. Areal, modular, and connectional organization of visual cortex in a prosimian primate, the slow loris (Nycticebus coucang). Brain Behav. Evol. 42: 321–335, 1993. PREUSS, T. M. AND GOLDMAN-RAKIC, P. S. Architectonics of the parietal and temporal association cortex in the strepsirhine primate Galago compared to the anthropoid Macaca. J. Comp. Neurol. 310: 475–506, 1991a. PREUSS, T. M. AND GOLDMAN-RAKIC, P. S. Ipsilateral cortical connections of granular frontal cortex in the strepsirhine primate Galago, with comparative comments on anthropoid primates. J. Comp. Neurol. 310: 507– 549, 1991b. PREUSS, T. M. AND KAAS, J. H. Cytochrome oxidase ‘‘blobs’’ and other characteristics of primary visual cortex in a lemuroid primate, Cheirogaleus medius. Brain Behav. Evol. 47: 103–112, 1996. ROE, A. AND TS’O, D. Y. Visual topography in primate V2: multiple representation across functional stripes. J. Neurosci. 15: 3689–3715, 1995. ROSA, M.G.P. Visuotopic organization of primate extrastriate cortex. In: Cerebral Cortex: Extrastriate Cortex in Primates, edited by J. H. Kaas, K. Rockland, and A. Peters. New York: Plenum, in press, vol. 12. ROSA, M.G.P., GATTASS, R., AND FIORANI, M. Complete pattern of ocular dominance stripes in V1 of a New World monkey, Cebus apella. Exp. Brain Res. 72: 645–648, 1988a. ROSA, M.G.P., GATTASS, R., FIORANI, M., AND SOARES, J.G.M. Laminar, columnar and topographic aspects of ocular dominance in the primary visual cortex of Cebus monkeys. Exp. Brain Res. 88: 249–264, 1992. ROSA, M.G.P., GATTASS, R., AND SOARES, J. G. M. A quantitative analysis of cytochrome oxidase-rich patches in the primary visual cortex of Cebus monkeys: topographic distribution and effects of late monocular enucleation. Exp. Brain Res. 84: 195–209, 1991. ROSA, M.G.P., PETTIGREW, J. D., AND COOPER, H. M. Unusual pattern of retinogeniculate projections in the controversial primate Tarsius. Brain Behav. Evol. 48: 121–129, 1996. ROSA, M.G.P. AND SCHMID, L. M. Topography and extent of visual-field
06-05-97 13:33:43
neupal
LP-Neurophys
PROSIMIAN VISUAL CORTEX representation in the superior colliculus of the megachiropteran Pteropus. Visual Neurosci. 11: 1037–1057, 1994. ROSA, M.G.P. AND SCHMID, L. M. Magnification factors, receptive field images and point-image size in the superior colliculus of flying foxes: comparison with the primary visual cortex. Exp. Brain Res. 102: 551– 556, 1995a. ROSA, M.G.P. AND SCHMID, L. M. Visual areas in the dorsal and medial extrastriate cortices of the marmoset. J. Comp. Neurol. 359: 272–299, 1995b. ROSA, M.G.P., SCHMID, L. M., AND CALFORD, M. B. Responsiveness of cat area 17 after monocular inactivation: limitation of topographic plasticity in adult cortex. J. Physiol. Lond. 482: 589–608, 1995. ROSA, M.G.P., SCHMID, L. M., KRUBITZER, L. A., AND PETTIGREW, J. D. Retinotopic organization of the primary visual cortex of flying foxes (Pteropus poliocephalus and Pteropus scapulatus). J. Comp. Neurol. 335: 55–72, 1993a. ROSA, M.G.P., SCHMID, L. M., AND PETTIGREW, J. D. Organization of the second visual area in the megachiropteran bat Pteropus. Cereb. Cortex 4: 52–68, 1994. ROSA, M.G.P., SOARES, J.G.M., FIORANI, M., AND GATTASS, R. Cortical afferents of visual area MT in the Cebus monkey: possible homologies between New and Old World monkeys. Visual Neurosci. 10: 827–855, 1993b. ROSA, M.G.P., SOUSA, A.P.B., AND GATTASS, R. Representation of the visual field in the second visual area in the Cebus monkey. J. Comp. Neurol. 275: 326–345, 1988b. SANDERSON, K. J., DREHER, B., AND GAYER, N. Prosencephalic connections of striate and extrastriate areas of rat visual cortex. Exp. Brain Res. 85: 324–334, 1991. SANIDES, F. Representation in the cerebral cortex and its areal lamination patterns. In: Structure and Function of the Nervous System, edited by G. H. Boune. New York: Academic, 1972, p. 329–453. SCHEIN, S. J. AND DE MONASTERIO, F. M. Mapping of retinal and geniculate neurons onto striate cortex of the macaque. J. Neurosci. 7: 996–1009, 1987. SCHWARTZ, E. L. Spatial mapping in the primate sensory projection: analytic structure and relevance to perception. Biol. Cybern. 25: 181–194, 1977. SERENO, M. I. AND ALLMAN, J. M. Cortical visual areas in mammals. In: Vision and Visual Dysfunction: The Neural Basis of Visual Function, edited by A. G. Leventhal. London: Macmillan, 1991, vol. 4, p. 160– 172. SESMA, M. A., CASAGRANDE, V. A., AND KAAS, J. H. Cortical connections of area 17 in tree shrews. J. Comp. Neurol. 230: 337–351, 1984. SETOGUCHI, T. AND ROSENBERGER, A. L. A fossil owl monkey from La Venta, Colombia. Nature Lond. 326: 692–694, 1987. SILVEIRA, L.C.L., PERRY, V. H., AND YAMADA, E. S. The retinal ganglion cell distribution and the representation of the visual field in area 17 of the owl monkey, Aotus trivirgatus. Visual Neurosci. 10: 887–897, 1993. SILVEIRA, L.C.L., PICANC¸ O-DINIZ, C. W., SAMPAIO, L.F.S., AND OSWALDOCRUZ, E. Retinal ganglion cell distribution in the Cebus monkey: a comparison with the cortical magnification factors. Vision Res. 29: 1471– 1483, 1989. SIMONS, E. L. Skulls and anterior teeth of Catopithecus (Primates: Anthropoidea) from the Eocene and Anthropoid origins. Science Wash. DC 268: 1885–1888, 1995. SOUSA, A.P.B., GATTASS, R., AND OSWALDO-CRUZ, E. The projection of the opossum’s visual field on the cerebral cortex. J. Comp. Neurol. 177: 569–588, 1978. SOUSA, A.P.B., PIN˜ ON, M.C.G.P., GATTASS, R., AND ROSA, M.G.P. Topographic organization of cortical input to striate cortex in the Cebus monkey: a fluorescent tracer study. J. Comp. Neurol. 308: 665–682, 1991. STEPHAN, H. AND ANDY, O. J. Quantitative comparative neuroanatomy of primates: an attempt at a phylogenetic interpretation. Ann. NY Acad. Sci. 167: 370–387, 1969. STEPHAN, H., FRAHM, H., AND BARON, G. New and revised data on volume
/ 9k13$$ju39
J761-6
3217
of brain structures in insectivores and primates. Folia primatol. 35: 1– 29, 1981. STEPNIEWSK A, I. AND KAAS, J. H. Topographic patterns of V2 cortical connections in macaque monkeys. J. Comp. Neurol. 371: 129–152, 1996. SYMONDS, L. L. AND KAAS, J. H. Connections of striate cortex in the prosimian, Galago senegalensis. J. Comp. Neurol. 181: 477–512, 1978. TIAO, Y. C. AND BLAKEMORE, C. Functional organization in the visual cortex of the golden hamster. J. Comp. Neurol. 168: 459–481, 1976. TIGGES, M. AND TIGGES, J. The retinofugal fibers and their terminal nuclei in Galago crassicaudatus (Primates). J. Comp. Neurol. 138: 87–101, 1970. TIGGES, J., TIGGES, M., AND KALAHA, C. S. Efferent connections of area 17 in Galago. Am. J. Phys. Anthropol. 38: 393–397, 1973. TOOTELL, R.B.H., HAMILTON, S. L., AND SILVERMAN, M. S. Topography of cytochrome oxidase activity in the owl monkey cortex. J. Neurosci. 5: 2786–2800, 1985. TOOTELL, R.B.H., SILVERMAN, M. S., DE VALOIS, R. L., AND JACOBS, G. H. Functional organization of the second cortical visual area of primates. Science Wash. DC 220: 737–739, 1983. TOOTELL, R.B.H., SILVERMAN, M. S., SWITKES, E., AND DEVALOIS, R. L. Deoxyglucose analysis of retinotopic organization in primate striate cortex. Science Wash. DC 218: 902–904, 1982. TOOTELL, R.B.H., SWITKES, E., SILVERMAN, M. S., AND HAMILTON, S. L. Functional anatomy of macaque striate cortex. II. Retinotopic organization. J. Neurosci. 8: 1531–1568, 1988. TUSA, R. J., PALMER, L. A., AND ROSENQUIST, A. C. The retinotopic organization of area 17 (striate cortex) in the cat. J. Comp. Neurol. 177: 213– 236, 1978. VAN ESSEN, D. C. AND MAUNSELL, J.H.R. Two-dimensional maps of the cerebral cortex. J. Comp. Neurol. 191: 255–281, 1980. VAN ESSEN, D. C., NEWSOME, W. T., AND MAUNSELL, J.H.R. The visual field representation in striate cortex of the macaque monkey: asymmetries, anisotropies and individual variability. Vision Res. 24: 429–448, 1984. VOGT-WEISENHORN, D. M., ILLING, R.-B., AND SPATZ, W. B. Morphology and connections of neurons in area 17 projecting to the extrastriate areas MT and 19DM and to the superior colliculus in the monkey Callithrix jacchus. J. Comp. Neurol. 362: 233–255, 1995. WAGOR, E., LIN, C. S., AND KAAS, J. H. Some cortical projections of the dorsomedial visual area (DM) of association cortex in owl monkey, Aotus trivirgatus. J. Comp. Neurol. 163: 227–250, 1975. WAGOR, E., MANGINI, N. J., AND PEARLMAN, A. L. Retinotopic organization of striate and extrastriate visual cortex in the mouse. J. Comp. Neurol. 193: 187–202, 1980. WALL, J. T., SYMONDS, L. L., AND KAAS, J. H. Cortical and subcortical projections of the middle temporal area (MT) and adjacent cortex in galagos. J. Comp. Neurol. 211: 193–214, 1982. WA¨ SSLE, H., GRU¨ NERT, U., RO¨ HRENBECK, J., AND BOYCOTT, B. B. Cortical magnification factor and the ganglion cell density of the primate retina. Nature Lond. 341: 643–645, 1989. WELLER, R. E. AND KAAS, J. H. The organization of the visual system in Galago: comparisons with monkeys. In: The Lesser Bushbaby (Galago) as an Animal Model: Selected Topics, edited by D. E. Haines. Boca Raton, FL: CRC, 1982, p. 107–134. WELLER, R. E., STEELE, G. E., AND CUSICK, C. G. Cortical connections of dorsal cortex rostral to V II in squirrel monkeys. J. Comp. Neurol. 306: 521–537, 1991. WILDER, H. D., GRU¨ NERT, U., LEE, B. B., AND MARTIN, P. R. Topography of ganglion cells and photoreceptors in the retina of the New World marmoset monkey Callithrix jacchus. Visual Neurosci. 13: 335–352, 1996. WILLIAMS, R. W., CAVADA, C., AND REINOSO-SUAREZ, F. Rapid evolution of the visual system: a cellular assay of the retina and dorsal lateral geniculate nucleus of the Spanish wildcat and the domestic cat. J. Neurosci. 13: 208–228, 1993. WONG-RILEY, M. Changes in the visual system of monocularly sutured or enucleated cats demonstrable with cytochrome oxidase histochemistry. Brain Res. 171: 11–28, 1979.
06-05-97 13:33:43
neupal
LP-Neurophys