format and control therefore becomes an important ... glance durations and number of glances for radio and .... consisting of radio station call signs, weather.
Visual Sampling of In-Vehicle Text Messages Effects of Number of Lines, Page Presentation and Message Control Joshua D. Hoffman, John D. Lee, Daniel V. McGehee, Mashala Macias, Andrew W. Gellatly Emerging in-vehicle technology associated with radio data systems (RDS), satellite radio, navigation aids, and infotainment systems will expose drivers to an increasing amount of textual information. The visual demands of driving make it critically important to understand how characteristics of such information affect visual sampling of the roadway. This study used a medium-fidelity driving simulator to evaluate the effect of scroll control (manual, automatic), the number of lines displayed (one, two, four), and scrolling strategy (line -by-line, page -by-page) on drivers’ visual sampling behavior of text messages. Fifteen males and fifteen females, ages 25-51 (mean 35.7, s.d. 7.5), participated. Consistent with previous models of sampling behavior, text message characteristics affected the number of glances much more strongly than the duration of glances, and drivers were able to protect driving performance even with a demanding secondary visual task. However, the number of lines of text displayed increased the mean glance duration, the variability of glance duration, and the number of glances greater than two seconds. Scrolling text line -by-line increased visual demand relative to scrolling page-by-page particularly when scrolling is manually controlled by the driver. A touch screen button for manual control of scrolling lead to greater visual demand compared to automatically scrolled text. The proliferation of in-vehicle technology has brought with it an abundance of textual information. One challenge of managing information from radio data systems (RDS), satellite radio, navigation, information systems and other sources is to develop methods to present text information that are efficient, simple, and place the fewest demands on the driver’s attention. While such data should enhance drivers’ experience in terms of overall enjoyment, travel time and efficiency, improperly displayed and controlled text messages may distract drivers and lead them to
miss critical driving events. The design of text message format and control therefore becomes an important influence on the drivers’ overall visual sampling behavior. Current guidelines provide direction for the development of advanced in-vehicle displays, which include principles that apply to the presentation of text information such as appropriate fonts and message complexity (1, 2). However, these guidelines focus primarily on succinct vehicle state and navigation information, with the intent of minimizing display induced distraction. As more entertainment-based systems are introduced into the vehicle, guidelines addressing longer messages unrelated to the primary task of driving must be developed to present this information in the least demanding manner possible. Visual Sampling Visual sampling guides how drivers extract information inside and outside of the vehicle. Simply put, the more head-down time in-vehicle, the less time the driver has to respond to changing roadway conditions. Senders and colleagues (3) were the first to quantify the visual sampling process in driving. They found that on a closed highway, a vehicle could be driven with only intermittent visual sampling. Using a helmet with a visor that periodically occluded the forward view they found drivers could easily maintain vehicle control with surprisingly small periodic samples of the roadway. Between samples, the driver becomes increasingly uncertain about the state of the vehicle relative to the roadway and when uncertainty exceeds a threshold, the driver samples the roadway. Overall, they found that drivers are generally well-calibrated regarding the buildup of uncertainty relative to the vehicle dynamics and roadway characteristics. Wierwille (4) extended this sampling model to describe how drivers distribute their attention between an in-vehicle task and the roadway. When drivers glance towards the in-vehicle display, information
Hoffman, Lee, McGehee, Macias, & Gellatly
2
extraction begins and time elapses. If drivers can extract information in one second or less, they will return their glance to the forward scene. Howeve r, if extraction takes longer, drivers will continue to glance at the display while uncertainty builds as the eyes remain off the road. If the glance to the display exceeds approximately 1.5 seconds and the information cannot be extracted, drivers will quickly feel pressured to return their eyes to the forward scene and try again later. Additional samples are handled in the same manner, until all required information is obtained. Such a model predicts that the duration of glances away from the road will remain relatively constant as the visual demand of in-vehicle displays increases, but that the number of glances will increase. Several previous studies have considered the frequency and duration of glances required to perform various in-vehicle tasks. One study examined in-car glance durations and number of glances for radio and mirror tasks on the open road-in traffic (5). Results showed that individual glance times into the car were clustered around 1.27-1.42 seconds and that for radio tasks such as tuning, four or five glances were required. The authors concluded that drivers develop a consistent time-sharing strategy for performing tasks that require visual attention while driving. Another study reported a series of 1-1.5 second glances to the in-vehicle display/control system to complete a range of in-vehicle tasks (6). Findings also showed that the total task time depended on the number of glances, not the mean duration of those glances. Likewise, Bhise, Forbes and Farber (7) found that single glance times to the instrument panel vary relatively little while the number of glances varies greatly with the type of task. All of these results are generally consistent with the sampling model developed by Senders and colleagues (3), but this relationship may not hold for complex text messages.
sampling of the control of scrolling—either automatically controlled by the system or manually advanced by the driver, how much text is revealed to the driver at any time—either one, two or four lines, and the strategy for scrolling information—one line versus one page at a time, were examined. Four general hypotheses guided this study:
Goal of Study
Driving Simulator Description
This study addresses the influence of different ways of managing the display of text messages while driving. Specifically, the overall visual demands associated with reading and scrolling a message on a multi-line display compared to a display containing a single line of text has not been empirically investigated. In this study, the effects on visual
Data were collected using the medium-fidelity, fixedbase DriveSafety Corporation Vection Research Simulator (VRS) located at the Cognitive Systems Laboratory at the University of Iowa. The simulator utilizes a fully equipped 1992 Mercury Sable cab equipped with a 50-degree visual field of view, full instrumentation with functional gauges, a force
• • • •
To read a given amount of text, displaying more lines will reduce the number of glances, but will increase the duration of those glances. Manual control of information display will lead the driver to adjust the flow of information according to the driving environment. Scrolling through text page-by-page requires fewer glances compared to advancing a message line-byline. Overall, text display characteristics will have a greater effect on the number of glances compared to the duration of glances.
METHOD Participants 15 males and 15 females, ages 25-51 (mean 35.7, s.d. 7.5), participated in this experiment. Each participant had been driving for at least five years, possessed a valid driver’s license, and had normal or corrected to normal vision that did not require eye glasses. Only native English speakers were included in this study to eliminate potential confounds related to comprehension of message content. Prior to participating in this study, drivers were screened to exclude those who had participated in previous driving simulator studies as well as those prone to simulator sickness. Participation lasted approximately two hours, for which drivers were compensated $30.
Hoffman, Lee, McGehee, Macias, & Gellatly
feedback steering wheel, and a surround-sound audio system. The fully textured graphics are generated by PC hardware that delivers a 60 Hz frame rate at 1024 x 768 resolution. Eye movements were recorded with a Seeing Machines eye tracker driven by the FaceLab 2.0 software. Driving Environment The driving environment consisted of a two-lane highway with straight and curved sections of roadway, representative of those found in rural Iowa. Curves of either 100 or 200 m (328 or 656 ft) radius of curvature were encountered approximately every 45 seconds. The roadway had four intersections controlled by traffic signals placed so that drivers experienced an intersection approximately every three minutes. Traffic in the opposite lane was encountered at a rate of three to four cars per minute. Participants were instructed to drive 45 mph (20 m/s) and follow a lead vehicle which periodically braked, requiring participants to respond in order to avoid a collision. Except during the braking events, drivers were separated from the lead vehicle by a minimum time headway of 1.7 seconds. This headway was not fixed, resulting in some drivers increasing the time headway and avoiding the braking events. Text Message System Description Text messages were presented on a seven-inch 640 x 480 resolution LCD color display, mounted on the dash above the center instrument panel 32.5 degrees
3
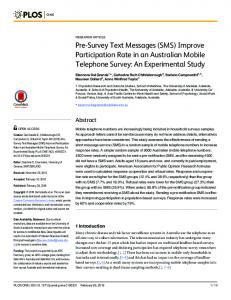
lateral and 15.42 degrees below the driver’s line of sight (Figure 1). The text messaging program was developed using Microsoft Visual Basic 6.0 and used a 5x7 dot matrix font, ‘LCD Display Grid’ , with RGB color values (80,143,194) to present 22 characters per line, each of which was 4 mm wide and 4 mm tall. There was a 0.5 mm separation between lines, resulting in a total display area of 18 x 88 mm. Text Message Task In addition to the primary task of driving, participants were asked to read in-vehicle text messages presented on the dash-mounted display. The messages described restaurants available in a town they were approaching. Descriptions included the name, the average cost of an entrée based dollar a dollar sign rating, the quality rating, the cuisine served, and the distance the restaurant was located from the center or downtown area. Each message was approximately 170 characters and 30 words long; as an example: “The third restaurant, the Great Steakout, has an average entrée cost of $ and a quality rating of 3 stars. The Great Steakout specializes in steak. It is located 2 miles from downtown.” Three target messages were presented during each drive, separated by distracter messages consisting of radio station call signs, weather information, and the current date. A chime informed the participants that a message was available, at which time the driver pressed the touch screen to display the message. Upon completing each drive, participants were asked a series of questions relating to the restaurant messages to assess reading comprehension.
FIGURE 1 Position of text display relative to driver, with the eye tracking system shown above the steering wheel.
Hoffman, Lee, McGehee, Macias, & Gellatly
Experimental Design and Independent Variables A 2X3X2 mixed, between and within experimental design was used to compare the text message system characteristics of scroll control, tested as a betweensubjects variable , and scrolling strategy and number of lines displayed, which were tested as withinsubjects variables. Scroll control defined how the text was advanced and had two levels, either automatic or manual. Manual scrolling required the driver to press a soft button on the touch screen to advance the message. In contrast, the automatic scrolling required no input from the driver to advance the message, occurring every four, five, or twelve seconds depending on whether one, two or four lines were scrolled, respectively. The timing of the automatic scrolling was based on a preliminary analysis of the time between manual activations of a scroll and corresponded to an 85th percentile response time. Number of lines defined the amount of text visible to the driver at any time and had three levels : one, two, or four lines. Scrolling strategy defined how much text was advanced in scrolling the message and had two levels , line-by-line or page-by-page. Line-by-line scrolling introduced one new line of a message each time the button on the touch screen was pressed or when the system automatically advanced the message. In contrast, page-by-page scrolling replaced all of the lines currently displayed with new lines of information. Note that this design was a partial factorial design because it is not possible to make the line and page scrolling distinctions with the one-line display. Procedure Upon arriving, drivers completed an informed consent form, received instructions for the driving and message tasks, and the eye tracker was calibrated. A five minute practice drive began with a left curve and a right curve which allowed participants to become comfortable with the steering and vehicle dynamics. An example of each message presentation type was then presented on a straight section of roadway, allowing drivers to familia rize themselves with the operation of the text messaging system. The lead vehicle was not present in the practice drive, allow ing participants to concentrate on operation of the
4
simulator and the text messaging system. Upon completion of the practice drive, participants were asked three questions representative of those they were to receive following experimental trials. Experimental trials consisted of five ten-minute drives similar to the practice drive. Participants drove the same driving environment in both directions to prevent association of the onset of the messages with particular features of the driving environment while encountering an equal number of curves and intersections. Upon completion of each drive, participants answered six questions related to the target messages and filled out a NASA TLX questionnaire. Following the final drive, participants were debriefed regarding the purpose of the study, compensated for their time, and thanked for their participation. Dependent Variables The effect of the text message system parameters on driver behavior was assessed using five categories of dependent variables. The first category assessed visual demand of the message system, which included frequency and duration of glances to the display, a breakdown of the glances into short (2 sec) glances, and the duration between glances to the display. The second category assessed message management and included the response time to initiate a message following indication it was available, the time between button presses to scroll the message, and the percent of times the eyes were on the display during a scroll. The third category assessed driver productivity, measured by message comprehension scores and the total time required to read a message. The fourth category assessed driving performance, including the average speed during a message, the difference in steering entropy (8) between driving while reading a message and driving alone, and the root mean square of the vehicle’s deviation from its mean lane position. The fifth category assessed driver workload using the NASA TLX subject workload scale measures of temporal demand and mental effort. RESULTS Data were reduced using Matlab 6.5 and aggregated across each trial by calculating the mean value for all the dependent variables for the three messages read. The mean data were then analyzed using SAS for
Hoffman, Lee, McGehee, Macias, & Gellatly
Windows 9.0. To accommodate the partial factorial design of this experiment, the PROC MIXED function in SAS was used to develop two statistical models for each of the dependent variables listed above. The first model included the scroll control, the number of lines, and the interaction between the two conditions. Because the one-line display did not differ between scroll strategies, a second model was fit to the data for the two- and four-line conditions which included the scroll strategy, the number of lines by scroll strategy interaction, and the three-way interaction between scroll control, the number of lines, and scroll strategy. The composite symmetry covariance structure was used for all the analyses, and participant was the repeated measures variable. The LSMEANS function was used to obtain a least squares estimate of the means and the standard error of the means. Message Initiation Upon receiving indication a message was available, the driver was required to press a button on the touch screen to initiate display of the message. The mean and median times to initiate a message were 3.93 and 3.02 seconds, respectively. Message initiation times ranged from 1.45 seconds to 15.74 seconds with a standard deviation of 2.81. Surprisingly , given the range of initiation times, no display characteristic had a statistically significant effect on when the driver began reading the message. Drivers initiated the message at approximately the same time whether the scroll control was under automatic (M= 3.41 s) or manual control (M= 4.48 s), (F (1,28) = 1.70, p = 0.2024). Likewise, the standard deviation of the initiation time did not show a statistically significant effect of scroll control, with similar mean values for automatic (M=1.55) and for manual control (M=2.81), (F(1,28) = 1.74, p= 0.1984). Number of Glances Once displayed, drivers begin sampling the message with a series of short glances. Across all display conditions the mean number of glances required to read the message ranged from 9.59 to 19.7, with the largest number of glances seen with the four-line display scrolled manually line-by-line. The total number of glances required to read a message
5
depended on the text display system characteristics in a complex manner, as shown by the three-way interaction between scroll control, the number of lines displayed, and scrolling strategy (F (4,33) = 13.43, p < 0.0001) in Figure 2. Overall, line-by-line and manual scrolling of messages required more glances to the display than automatic scrolling. In general, paging reduced the number of glances made to the display, a benefit which was more pronounced for manual control. One-line displays required an approximately equal number of glances for the automatic as compared to the manual scrolling condition. As the number of lines displayed increased, the number of glances tended to decrease (F (2,46) = 4.88, p = 0.012). The variability in the number of glances followed a similar pattern to the mean number of glances, with a significant three-way interaction in which manual control varie d more than automatic control and the line-by-line strategy varie d more than the page-by-page strategy (F (4,33) = 3.11, p = 0.0282). As in Figure 2, the decrease in variability associated with the page-by-page scrolling of a four-line display was much greater for manual compared to automatic scroll control. Glance Durations to Display and the Road Across all display conditions the mean glance duration to the display ranged from 0.76 to 1.14 seconds, with the longest glances seen with the four-line display manually scrolled line-by-line. Overall, manual control of message scrolling resulted in longer mean glances than automatic scrolling (F (1,24) = 5.98, p = 0.0222). Increasing the number of lines displayed increased the duration of glances, F (2,46) = 28.53, p < 0.0001, with mean glance durations of 0.87, 1.00, and 1.09 seconds for the one-, two-, and four-line displays, respectively. Increasing the number of lines also increased the variability of glance duration, F (2,46) = 8.98, p = 0.0005, with standard deviations of glance duration of 0.37, 0.45 and 0.47 for the one-, two-, and four-line displays, respectively. Page-by-page scrolling resulted in slightly shorter glance durations (M=1.02) compared to line-by-line scrolling (M=1.07), (F (1,23) = 4.52, p = 0.0441), but this effect is highly dependent on the number of lines displayed. The mean glance duration was shorter when fewer lines were presented and the driver advanced the message with a paging strategy, compared to a line-by-line strategy with more lines of text, as shown in Figure 3.
Hoffman, Lee, McGehee, Macias, & Gellatly
6
25
Manual Automatic
Mean Number of Glances
20
15
10
5
0 Line/Page 1 Line
Line
Page
Line
2 Lines
Page 4 Lines
FIGURE 2 Mean number of glances made to the display during a message. More important than the mean glance duration is the distribution of glances. A display that induces a few long glances may undermine driving performance more than a display that has a slightly longer mean glance duration. Across all display conditions the percentage of glances longer than two seconds ranged from 0.11% to 5.4%, with the greatest percentage of long glances seen with the four-line display automatically scrolled line-by-line. A threeway interactio n for the percentage of long glances existed between scroll control, the number of lines displayed, and scrolling strategy (F (4,33) = 1.41, p = 0.0258). In general, the number of long glances to the four-line display was not influenced by scroll control or scroll strategy. When compared to the two-line display, the four-line display (M = 4.92%) performed worse than the two-line display scrolled automatically (M = 2.22%) and the two-line display manually scrolled page by page (M = 0.11%), while the twoline display manually scrolled line-by-line performed equally poorly (M = 4.54%).
Across all display conditions the mean duration between glances to the display—the length of glances to the roadway—was 1.69 seconds and ranged from 1.38 seconds for the two-line display scrolled manually lineby-line to 2.11 seconds for the four-line display scrolled manually page-by-page. For the automatically scrolled one-line (M=1.80 s) and two-line (M=1.86 s) displays, drivers tended to wait longer between glances compared to manual scrolling (M=1.63 s, M=1.45 s), but waited longer between glances for the manually scrolled fourline display (M=1.81 s) than the automatic (M=1.69 s), (F (2,46) = 3.74, p = 0.0314). Eyes on the Display during a Scroll Drivers had their eyes on the display during a scroll a greater percentage of times for manual scrolling as compared to automatic scrolling (F (4,33) = 15.47, p < 0.0001). Within manual control, drivers’ eyes were on the display approximately the same percentage of times
1.4
Manual Automatic
1.2
Mean Glance Duration (s)
1
0.8
0.6
0.4
0.2
0 Line/Page 1 Line
Line
Page 2 Lines
Line
Page 4 Lines
FIGURE 3 Mean duration of glances made to the display during a message. for two-line (M=77.8%) and four-line displays (M=74.5%), while in the automatic condition this difference was larger (M=34.7% for two-line displays vs. M=43.82% for four-line displays). For the oneline display, drivers attended the display during scrolling 83.6% of the time under manual control and only 30.8% when it scrolled automatically. Total Time to Read a Message Across all display conditions the mean time to read a message ranged from 23.8 to 45.9 seconds, with the four-line display manually scrolle d line-by-line leading to the longest time to read a message and the two-line display manually scrolled page-by-page supportin g the shortest. Figure 4 shows that the time to read a message, similar to the number of glances, depends on a three-way interaction. The total time a message remained on the display was generally greater for manual scrolling than for automatic, and for the line-by-line scrolling strategy than for the
page-by-page, with the exception of the four-line display that was paged automatically (F (4,44) = 13.06, p < 0.0001). In the manual condition, the number of lines displayed had little effect on the total time it took to read a message. The variability in total message time followed the same pattern as seen in Figure 4, where manual scrolling and line-by-line scrolling exhibited more variability, with the exception of the four-line display automatically paged (F (4,44) = 9.99, p < 0.0001). This pattern of results is quite similar to the mean number of glances shown in Figure 2, in fact the correlation between the mean number of glances and the total time to read a message is 0.67. In contrast, the correlation between the mean glance duration and the total time to read a message is -0.09. Message Comprehension and Driving Performance A logistic regression model showed that manual control of scrolling was likely to increase steering entropy
60
Manual Automatic
Total Message Time (s)
50
40
30
20
10
0 Line/Page 1 Line
Line
Page
Line
2 Lines
Page 4 Lines
FIGURE 4 Total time a message remained on the display. while reading a message as compared to driving alone (?2 (1) = 15.5, p < 0.0001). Manipulation of the number of lines displayed and the scrolling strategy had no significant effect on any of the driving performance measures collected (RMS lane deviation, average speed, steering entropy). Overall, the effect the presentation characteristics had on sampling behavior, but not on driving performance, suggests that the low-demand rural driving environment, rather than the tradeoff between the text reading task and the driving task, most likely contributed to this result. In addition, no significant difference was observed between the number of correct responses to the postdrive questions based on the display characteristics. In general, drivers tended to respond correctly 77% of the time. A main effect was observed for the temporal demand experienced by drivers. Subjective ratings indicated that automatic scrolling (M = 49.2) was substantially more temporally demanding compared to manual scrolling (M=25.6) (F (1,28) = 8.49, p = 0.0069).
Summary of Results Table 1 summarizes the mean values for the primary dependent variables of interest. The values in bold represent the best performing combination(s) of display characteristics for a particular dependent variable . Performance was not assessed for differences which failed to reach statistical significance. DISCUSSION The purpose of this study was to examine how invehicle text messaging display characteristics affect visual sampling behavior. Specifically, the experiment compared scroll control (manual, automatic), the number of lines displayed (one, two, or four), and scrolling strategy (line, page). To apply these findings and models of visual sampling to text message display design, we have decomposed the life of a message into an iterative sequence. This decomposition reveals that there is more to a text message than just reading; drivers
TABLE 1. Summary of Findings (Bold Indicates Best Performance) Manual 1 Line Line/ Page
Automatic
2 Lines Line Page
4 Lines Line Page
1 Line Line/ Page
2 Lines Line Page
4 Lines Line Page
Mean number of glances
16.3
19.7
14.2
19.5
12.3
15.6
12.8
9.6
10.7
11.2
Mean glance duration (s)
0.98
1.07
1.04
1.14
1.12
0.76
0.95
0.92
1.11
0.99
Mean inter-glance duration (s)
1.63
1.38
1.47
1.51
2.11
1.80
1.83
1.89
1.54
1.82
Percent of long glances (%)
1.97
4.50
0.11
5.10
4.60
0.73
1.70
2.80
5.40
4.60
Message initiation response time (s)
4.27
4.93
4.80
4.59
4.13
3.36
3.65
3.17
3.99
2.83
Mean time between button presses (s)
4.11
5.91
6.62
7.86
12.30
4.00
4.00
5.00
4.00
12.00
Percent of times eyes on the display during a scroll (%)
83.6
76.0
79.6
77.0
72.2
30.8
34.8
35.0
47.4
41.1
Message comprehension
4.7
4.2
4.3
4.8
4.1
5.2
4.8
4.7
4.6
4.9
Total time per message (s)
38.0
45.9
27.2
46.8
34.0
35.8
31.7
24.3
23.8
34.4
Average speed during a message (mph)
39.8
39.9
39.5
39.3
39.4
39.3
38.6
39.3
38.6
39.4
RMS lane deviation
0.56
0.54
0.54
0.50
0.56
0.44
0.43
0.48
0.50
0.46
0.062 0.063 0.036 0.045
0.008
-0.006
-0.041
-0.014
-0.038
Entropy difference
0.034
Temporal demand
22.2
30.2
22.1
28.5
28.0
50.9
53.3
46.6
49.8
46.2
Mental effort
56.2
70.0
59.4
56.3
66.5
72.8
68.3
69.5
67.4
70.1
must manage the timing and display of the message (see Figure 5). Although the amount of information in a message had a strong effect on drivers’ sampling behavior, the display characteristics that influence how a driver manages the message display also influenced visual sampling.
In Figure 5, the first phase following a nominal state (e.g., blank screen) is the initial state change signifying the arrival of a new message. The display of the message begins with message entry. Messages can either appear simply by ‘turning on’ or enter dynamically (e.g., either by sliding in horizontally or
Message Complete
Line entry/exit
Nominal State
State Change
Initiate Message Entry
Initiate Message Scroll
Read Message
Message End
Eye Position Head up/ On road In car/ head down 0.6 to 1.6 seconds
0.6 to 1.6 seconds
0.6 to 1.6 seconds
Start message sampling
Complete message sampling
FIGURE 5 The life of a message (eye position adapted from (4)). vertically), the control of which is given to the driver or is automatically carried out by the system. Understanding the factors influencing when the message is initiated is particularly important because the timing of the demands of reading a message relative to the roadway demands may be more important than the absolute demands of reading the message itself, such as during curve negotiation. Results of this study, however, showed that contrary to our hypothesis, drivers did not anticipate upcoming roadway demands and delay messages that scroll automatically. Drivers accepted both manually and automatically scrolled messages shortly after they were notified. Overall, these results provide preliminary evidence that drivers are not likely to adjust when they initiate a message as a function of system characteristics or driving demands. Following initiation of the message, the reading phase begins and visual demand begins to build. The driver samples the message, returns his/her vision to the forward roadway, samples the message again, returns to the roadway, and so on, until the displayed portion of the message has been
read. Figure 5 shows how these considerations might translate into a typical sequence of glances during the reading phase of the message. Consistent with our hypothesis, the mean glance duration tended to increase and the number of glances tended to decrease as the number of lines displayed increased. This suggests that when more information is available, drivers will tend to sample the message longer to extract more information. The variability in these glance durations also increased with the number of lines, as did the number of glances longer than two seconds. These results suggest that large, multi-line displays may induce very long and potentially distracting glances away from the roadway. After the displayed portion of the message has been read, the message must be scrolled by the driver or the system, before the reading phase can resume. In this experiment, the manual activation of the scrolling button was relatively demanding, requiring the driver to glance towards the display to press the scrolling button on the touch screen. This activity induced substantially more glances to the display than automatic activation. The percentage of time the eyes were on the display during a scroll supports this conclusion, with manual
Hoffman, Lee, McGehee, Macias, & Gellatly
scrolling resulting in drivers’ eyes being on the display for twice the number of scrolling initiations as compared to automatic scrolling. Automatic scrolling resulted in a greater number of short glances to the display, particula rly for one-line displays, which may reflect check glances made to the display to determine when the system had scrolled. Longer durations between glances to the display were also observed for automatic scrolling of one- and two-line displays, suggesting individual glances may have been able to capture all the information displayed. Here, drivers may have been waiting for information to change before glancing to the display again, suggesting research may be necessary to determine if confirmation of information change (i.e., a tone) would promote a more effective sampling strategy. Following the initiation of scrolling (Figure 5), information can either enter and exit one line at a time, or the entire page of information can be replaced. The strategy used to scroll information can determine whether, following a scroll, drivers will need to reorient themselves within the message prior to beginning to extract information, which is particularly important in displays that have many lines of text. Cons istent with our hypothesis, scrolling page-by-page required fewer glances than line-by-line scrolling. Two factors explain this effect. First, page-by-page scrolling requires fewer button presses in the manual condition, reducing glances associated with the button press activity. Second, line-by-line scrolling limited the amount of information drivers could extract in a single glance. Drivers had to scan the message to identify new information because all but one line of the display was redundant with the information before the scroll event. The interaction between the scroll control and scroll strategy supports this interpretation. Line-byline scrolling requires more glances than page-bypage, an effect which is much stronger for manual scrolling than automatic. This explanation is also confirmed by the greater number of long glances with the line-by-line strategy. The combination of scanning and reading increases the overall glance duration, resulting in potentially dangerous glance durations when more information must be scanned in multi-line displays. The reading and scrolling process shown in Figure 5 is repeated until all the information in the message has been extracted. While scrolling activation adds some time to the sampling process, the total time to read a message is primarily a product
11
of the number of glances and the glance durations. Consistent with our hypothesis, the mean number of glances was strongly related to the total reading time while the mean glance duration was not. This is generally consistent with the findings of a previous study in which the mean number of glances and mean total task time correlate strongly (0.948) (6). The relationship in this study is not as strong, which may reflect the complexity of the interaction. Previous studies have considered relatively simple discrete tasks, whereas this one involved interaction over a span of 20 to 50 seconds. The total reading time was particularly poorly predicted by the number of glances in two conditions. Messages on the two-line, manually scrolled, page-by-page display were read more quickly than expected and the four-line, page-by-page display took longer to read than expected based on the mean number of glances. One explanation for these discrepancies is that drivers may have delayed glances to the four-line display to accommodate driving demands because they anticipated the high visual demand associated with this display. The overall results support the hypothesis that increasing the amount of information displayed prompted fewer but longer glances to the display. This included the increased amount of information introduced by the strategy which scrolled multiple lines at a time. Single line displays showed many short glances to the display which, when coupled with the large number of times the message must be scrolled, resulted in a longer overall time to read a message. The duration of glances supports previous findings of visual sampling behavior (4, 5, 6, 7), as represented in Figure 6, which shows a plot of the mean number of glances versus mean glance duration results from this study and results for certain in-vehicle tasks observed in a previous study (9). CONCLUSIONS A substantial range of message display parameters had little effect on message comprehension, but most affected reading speed and visual demand. Four-line messages displayed automatically line-by-line and twoline messages displayed page-by-page were read most quickly. However, reading speed must be balanced with the potential for distraction. Overall, line-by-line scrolling required a greater number of glances than page-by-page. Displays with more lines led to longer glance durations and a greater number glances longer
1.8
Present study Dingus et al. 1989
1.7
Cross street (Nav.) Road Name (Nav.)
1.6
Road Distance (Nav.)
Glance Duration (s)
1.5 1.4 1.3 1.2
4 Lines (Line)
1.1
Tune Radio
4 Lines (Page) 4 Lines (Auto)
4 Lines
Page
1 2 Lines (Auto)
2 Lines
2 Lines (Page)
0.9
2 Lines (Manual) 2 Lines (Line) 1 Line (Manual)
1 Line
Power Mirror Cruise Control
0.8
4 Lines (Manual) Line
1 Line (Auto)
0.7 5
7
9
11
13
15
17
19
Number of Glances
FIGURE 6 Comparison of number of glances and glance durations to previous data (Dingus et al. 1989). than two seconds, which are likely to interfere with driving. Manual scrolling of text messages using a touch screen induced substantially more glances compared to automatic control and so the message management demands may outweigh the benefits in enabling the driver to pace the interaction. Other scroll control mechanisms, such as a steering wheel button, may capture the benefits of allowing the driver to pace the interaction without adding to the visual demand. An important caveat of this study is the limited age range considered. For example, one study showed that when interacting with a radio, cassette, or cellular phone, no experienced driver glanced away from the road for longer than three seconds, but 29% of the inexperienced drivers did (10). This suggests that the calibration of uncertainty about the roadway in younger drivers may not be well suited to a more demanding secondary task such as reading text messages, which requires efficient visual sampling to sustain driving performance. Alternately, age-related declines in the speed of processing and selective attention would likely make this task much more difficult for older drivers. As a consequence, our results may underestimate the effect of text message displays on the overall driver population.
REFERENCES 1. AAM Driver Focus-Telematics Working Group. (2002). Statement of Principles, Criteria and Verification Procedures on Driver Interactions with Advanced In-Vehicle Information and Communications Systems (Version 2.0). www.umich.edu/~driving/guidelines/AAM_Driver Focus_Guidelines.pdf. Accessed July 10, 2003. 2.
Campbell J.L., Carney C.L., & Kantowitz B.H. Human Factors Design Guidelines for Advanced Traveler Information Systems (ATIS) and Commercial Vehicle Operations (CVO). Publication FHWA-RD-98-057. FHWA, U.S. Department of Transportation, 1998.
3.
Senders, J. W., Kristofferson, A. B., Levison, W. H., Dietrich, C. W. & Ward, J. L. The Attentional Demand of Automobile Driving. Highway Research Record, Vol. 195, 1967, pp. 15– 32.
4. Wierwille, W.G. Visual and Manual Demands of In-Car Controls and Displays. In: Smith and
Hoffman, Lee, McGehee, Macias, & Gellatly
Solame (Eds.), Automotive Ergonomics. Taylor and Francis, New York, 1993. 5. Rockwell, T.H. Spare Visual Capacity in Driving - Revisited. In: A.G. Gale, M.H. Freeman, C.M. Hasleman, P Smith and S.P. Taylor (Eds.), Vision in Vehicles II. Elsevier Science Publishers, North Holland, 1988. 6. Gellatly, A.W., & Kleiss, J.A. Visual Attention Demand Evaluation of Conventional and Multifunction In-Vehicle Information Systems. In: Proceedings of the IEA 2000/HFES 2000 Congress. Joint International Ergonomics Association 14th Triennial Congress and Human Factors and Ergonomics Society 44th Annual Meeting July 29, 2000-August 4, 2000. 7. Bhise, V.D., Forbes, L.M. & Farber E.I. Driver Behavioral Data and Considerations in Evaluating
13
In-Vehicle Controls and Displays. Presented at the Transportation Review Board 65th Annual Meeting, Washington, D. C., 1986. 8. Nakayama, O., Futami, T., Nakamura, T., & Boer, E.R. Development of a Steering Entropy Method for Evaluating Driver Workload. SAE Technical Paper (1999-01-0892). 9. Dingus, T.A., Antin, J.F., Hulse, M.C. & Wierwille, W.W. Attentional Demand Requirements of an Automobile Moving-Map Navigation System. Transportation Research, Vol. A23, No. 4, 1989, pp. 301-315.
10. Wikman, A. S., Nieminen, T., & Summala, H. Driving Experience and Time-Sharing during InCar Tasks on Roads of Different Width. Ergonomics, Vol. 41, No. 3, 1998, pp. 358-372.