Visualisation of allocated and unallocated data blocks in digital forensics Christopher Hargreaves Centre for Forensic Computing, Cranfield University, Shrivenham, SN6 8LA, UK
[email protected]
Abstract The ability to visualise blocks within file systems as allocated or unallocated is part of many existing forensic tools, for example the ‘Disk’ view in EnCase. However, analysis of the file system or partitioning of a disk is only one level of analysis that can occur as part of a digital investigation. Analysis of the structure within individual files can also be useful, however, there are limited examples of visualising file based data structures. This paper provides a discussion of the development of a prototype visualisation tool that could be used for examining application or operating system files that themselves contain allocated and unallocated blocks. An example is provided that visualises the Windows Registry and demonstrates how a visualisation could assist in identifying areas that are unallocated and therefore may contain deleted data of interest. This approach has potential applications in teaching the binary structure of files and also for data recovery in situations where code exists to process the live data from a file format, but data carving strategies for that format have not yet been developed.
Keywords Digital Forensics, Visualisation, Windows Registry
1. Introduction Deleted data can be of importance in digital forensic investigations and some tools offer visualisations that can be used to highlight unallocated areas within file systems, and therefore may contain deleted data. This paper considers the visualisation of unallocated areas within files themselves. The paper makes the following contributions: it demonstrates that a block based visualisation of the Windows Registry can show allocated and unallocated areas; and that tagging blocks and highlighting possible headers of deleted keys, in conjunction with visualising unallocated space, can show areas within files where deleted data is likely to be recoverable. The paper is structured as follows: Section 2 provides background and related work, including consideration of an example visualisation, i.e. the EnCase ‘Disk’ view. Section 3 discusses the methodology for the paper and Section 4 provides the results. The results and method used are evaluated in Section 5, and Section 6 discusses conclusions and future work.
In: 8th International Annual Workshop on Digital Forensics & Incident Analysis (WDFIA 2013), ISEG School of Economics and Management, Lisbon, 8th-10th May 2013
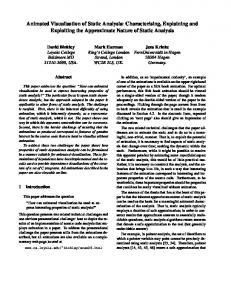
2. Background and Related Work This section contains an overview of background material on allocated and unallocated blocks in file systems, the visualisation of block allocation in existing forensic tools and the importance of deleted data in digital forensic investigations. 2.1 EnCase ‘Disk’ Visualisation One example of a block based disk visualisation can be found in EnCase, which can display blocks of a disk image based on the contents of a sector. An example is shown in Figure 1, which was generated using EnCase 6.19.7.2. The legend for the visualisation reveals that blocks can be tagged as ‘Volume Boot’, ‘FAT 1’, ‘FAT 2’, ‘Root Folder, ‘Unallocated’, ‘Bad Cluster’, ‘Allocated’, ‘Lost Cluster’, ‘Deleted File’, ‘Boot Sector’, ‘Wasted Area’, ‘No Partition’, ‘Unknown’, ‘Volume Slack’, ‘Disk Manager’.
Figure 1: The ‘Disk’ view of EnCase However, in digital forensics, different layers of abstraction are often referred to when discussing analysis. Carrier (2005) discusses several layers: Physical Storage Media Analysis, Volume Analysis, File System Analysis, Application/Operating System Analysis. EnCase can also be used to create a ‘Disk’ visualisation of some files that allow the ‘View File Structure’ option, for example the Windows Registry and PST files. This suggests that visualisation of data at other layers of abstraction, for example the Application/Operating System level is potentially of interest. However, there are several main limitations of this example representation. First is that there are a limited range of files that can be processed such that their internal structure can be displayed in this ‘Disk’ view. Secondly, the block size is predetermined; in this example, the block size is that of a sector (512 bytes). As will be investigated later, different values for block sizes may offer potential benefits. Finally, there are limited criteria for highlighting particular blocks, i.e. blocks are coded mostly on an allocated/unallocated basis.
2.2 Deleted Data Deleted data is clearly of interest in digital forensic investigations, and the existence of the visualisation in EnCase suggests that displaying a visualisation of ‘unallocated’ blocks or clusters within a file system is of interest. The ability to view the blocks of files displayable using the ‘View File Structure’ option also suggests that visualising the internal blocks of files stored within file systems may be of use. There are several file types that have internal structures that may result in ‘unallocated’ blocks within the files themselves, for example the Windows Registry (Thomassen 2008), SQLite databases (Pereira 2009) or index.dat files (Jones 2003). Bespoke data recovery techniques exist or can be developed for extracting deleted data from many of these file formats (which can be referred to as data carving). There are parallels here with file carving, which can be applied to both partitions or compound files, and usually results in extracted files as output, but data recovery techniques applied to single files can also output text results or table-based data that represent recovered records. File or data carving is a substantial topic within digital forensics and space does not permit an extensive review in this paper. This paper focuses on creating a block-based visualisation of files that is capable of highlighting unallocated areas where deleted data may reside and applying additional criteria to suggest particular sections of unallocated that may warrant further examination. 2.3 Existing Visualisations There are several existing visualisations available for binary files. Screenshots of these existing visualisations cannot be included due to space restrictions. However, a non-exhaustive summary is provided below. Byte Frequencies: Tools such as WinHex (X-Ways Software) and 010 (Sweetscape Software) are capable of a graphical representation of the byte frequencies within a file. This can give an overview of the distribution of bytes, for example large portions of zero bytes, or an even distribution of all bytes. Visualisation of Entropy: Another visualisation is based on the entropy of sections of data within a file. Cortesi (2012) allows areas to be highlighted that represent high entropy, for example encrypted data. Comparison of Binary Files: There are also tools that will compare two files and offer a simple visualisation in the form of highlighting differences between the files, usually as a side-by-side comparison. A further and thorough discussion of different binary file visualisation is available in Conti et al (2010). Conti also provides a table that discusses uses for binary file visualisation. Based on the discussion of these different uses provided in Conti, this paper focuses on visualisation for the tasks of “Locating and extracting metadata” and “Locating and extracting hidden content”.
3. Methodology 3.1 Aim The aim of this research is to investigate the visualisation of block allocation within application or operating system level files. Specifically the research seeks to determine if visualising blocks of such files potentially offers benefits to a digital forensic investigation. 3.2 Research Method This research assumes that we are working with known/reverse engineered data structures that can be parsed. Therefore, some of the binary file visualisation techniques that could be applied would not provide any additional insight, for example byte frequencies. The approach taken in this paper is to focus on blockbased analysis of files and graphically representing the allocated or unallocated nature of a block. This exploratory research paper consists of a case study that focuses on a single file format, and involves the development of a software prototype that identifies the allocated/unallocated nature of a block and produces a graphical representation of these states. The development then focuses on adding more detailed block tagging and investigates the effect this has on the visualisations. There are two phases to the research presented in this paper; the first is data generation, and the second is data visualisation. 3.3 Data Generation As stated in Marty (2008), “Visualization cannot happen without data or information. Therefore, before we can start talking about graphs and visualization, we have to talk about data”. In the context of this paper, this means that in order to visualise the allocated or unallocated nature of blocks within a file, it is necessary to determine what certain areas of a file are being used for and to store this information. There are many possible choices for a demonstration of block visualisation of an operating system or application file, for example: Windows Registry hives, Internet Explorer index.dat files, or SQLite databases could all be represented as blocks. In this case the Windows Registry has been chosen since the structure is complex but fairly well understood. While the example given in Section 2 showed that EnCase is already capable of visualising allocated and unallocated blocks within the Registry, it does not allow more complex highlighting based on additional criteria. Also the block size chosen does not appropriately represent the granularity of the block size in the Registry, which could be divided up based on hbins (multiples of 4096 bytes), or cells (8 bytes).
Detailed descriptions of the Windows Registry binary format exist in Russinovich and Solomon (2009), Thomassen (2008), Norris (2009) and others, and due to space constraints the explanation are not repeated here. However, as an overview of the structures, the hive files (e.g. NTUSER.DAT, SYSTEM, SOFTWARE) are divided up into hbins, which are multiples of 4096 bytes. The hbins contain cells, which are multiples of 8 bytes, and these cells contain records of various types, e.g. nk (key records), vk (value records), various types of subkeys lists, value lists and actual data values. Several parsers exist that are capable of processing the binary structure of the Windows Registry, for example Carvey (2013) (Perl based) and Ballenthin (2013) (Python 2 based). In addition the author of this paper also has previously created Python 3 based code for Registry hive processing, and since this code was the most familiar this was selected for use. 3.4 Data Visualisation After enhancement of a Windows Registry parser in order to generate information regarding block allocation, the next phase is the visualisation of the data. The focus of the research in this paper is to provide a simple representation of block allocation within the data structure. Despite focusing on applying a simple block-based visualisation, it is necessary to give consideration to factors such as block size and the technology used to implement the visualisation. There are a large number of possibilities for implementing a visualisation of the block allocation data. Much visualisation software is written in Java, but since the Registry hive processing was performed in Python 3, this was also used for the visualisation. There are several options for GUI based applications in Python, for example TkInter, GTK, PyQT. However, an approach was taken to make use of some of the features used by modern Web based applications. Instead of using Python GUI frameworks, Python can be used to start a web server on the local machine and the interaction performed though a web browser. This allows HTML, Javascript and CSS to be used to create the visualisation, with Python handling the data interpretation. While the visualisation used in this research is quite simplistic, the approach provides great flexibility for future alternative visual representations.
4. Results This section provides more detail of the development process for the data generation and visualisation stages. It also provides sample results and discusses the adjustment of parameters to highlight particular areas of interest within the Windows Registry. 4.1 Data Generation Section 3 discussed the selection of the Windows Registry for this visualisation and that a Python 3 based parser is used. The existing parser processes the baseblock, nk,
vk, li, lf, lh, ri records of the Registry, in addition to the data nodes. Sk records were also added to the parser’s processing list to increase the accuracy and coverage of allocated block identification. In terms of the block size for the Registry, since records are stored within multiples of 8 byte cells, an 8 byte block size was chosen. In order to record the status of blocks a simple data structure was created that allows blocks to be tagged with a particular a string to indicate its content. While space restrictions in this paper considers tagging blocks within the Windows Registry only, the particular implementation was developed such that the principles could be applied to other block-based application or operating system files. In order to create an approach that could be generalised, the mechanism by which the raw data of the Registry hives was read was replaced with a new class that was capable of maintaining a record indicating the nature of the data contained within the block. The existing means of parsing the Windows Registry was to read the entire file into a list of bytes and to access sections of it using slicing. Reading whole files into memory in this case is an acceptable approach since even large Registry files are small enough that this does not pose a problem. To allow a record to be maintained of block use, a new class was created called block_reader. This requires a value to be passed to the constructor describing the block size to be used. In addition the class implements a __getitem__(self, index) method that means that the new class also allows slicing. Since this new class now operates in the same way as the old bytes object, the existing parser continues to work as before. Additional methods were added to allow blocks to be tagged with particular values. tag_block_based_on_offset(offset_min, offset_max, tag)
Therefore an example new implementation for reading and processing the Windows Registry is (code has been restructured slightly for ease of reporting in this paper): reg_key_data = reg_data[start_offset:start_offset + key_length] type = self.identify_type(reg_key_data) values = get_values(reg_key_data, type) reg_data.tag_block_based_on_offset(start_offset, start_offset + key_length, type)
The code in bold is the only change necessary to the existing parser code. This approach allows an internal list of blocks to be maintained and tagged with strings. Strings were chosen rather than simple Boolean values so that more sophisticated tags can be used for blocks rather than simply ‘allocated’ or ‘unallocated’. While initially blocks were tagged as allocated or unallocated, additional tagging and the implications are discussed in Section 4.2. 4.2 Visualisation After parsing of the Windows Registry files and creation of a map of blocks, the allocation of blocks needed to be visualised. As discussed in the previous section, Python was used to run a local web server, using HTML, Javascript and CSS to generate the visual interface. The approach that was used in terms of the HTML interface was to use SVG rather than Canvas. In terms of performance, the Canvas is
more suited to the problem, however, since some interactivity is required, for example to perform an action on clicking a block, SVG is more appropriate since individually drawn elements can have their own event handlers. Interactivity with Canvas is possible through third party libraries, but this has not yet been explored. The developed map of block allocation requires that the colour is specified for blocks that are tagged with specific strings. In this code snippet, blocks tagged as unallocated are black (#000000), and all other blocks tagged with anything else are tagged green (#00FF00). self.reg_block_map.add_block_colour("unallocated", "#000000") self.reg_block_map.set_default_used_block_colour("#00FF00")
However, as was discussed in Section 3, it should be possible to produce more detailed visualisations on the block structure within files. To this end, the visualisation code was modified to tag the hbin headers as blue (#0000FF), which is also shown in Figure 2. self.reg_block_map.add_block_colour("unused", "#000000") self.reg_block_map.add_block_colour("hbin", "#0000FF") self.reg_block_map.set_default_used_block_colour("#00FF00")
Figure 2: In this example the green cells are allocated and the black cells are unallocated. In addition the blue highlights indicate hbin headers. This clearly shows the hbin headers occurring every 4096 bytes (strictly speaking multiples of 4096 bytes). However, it is difficult to imagine a practical use for this outside of teaching the Registry binary structure.
The Python web server code, HTML and Javascript were modified to allow individual cells to be clicked and the contents of that cell displayed in a separate HTML div, through an AJAX request. The code was then enhanced in two further ways. Firstly it was modified so that when clicking a cell that is tagged as unallocated, rather than just displaying the contents of that cell, consecutive unallocated cells before and after the selected cell are also displayed. This allows more effective exploration of areas of unallocated space within the Registry hive. Secondly, the Registry parser was updated to perform a second pass of the hive after reconstructing the Registry hierarchy. During this second pass, the parser examines only the blocks marked as unallocated and scans for specified criteria. In this example a scan was conducted for nk records, simply by searching for an nk signature at offset 4 (decimal) into the cell. These cells were tagged as nk-del, and the visualisation was updated to highlight these cells in red. This is shown in Figure 3. self.reg_block_map.add_block_colour("unused", "#000000") self.reg_block_map.add_block_colour("hbin", "#0000FF") self.reg_block_map.add_block_colour("nk-del", "#FF0000") self.reg_block_map.set_default_used_block_colour("#00FF00")
Figure 3: This example shows a single deleted nk header has been identified and highlighted in red. The hexadecimal view of the contents is displayed on the right after clicking the cell. However, it can also be seen just from the visualisation (i.e. without viewing the hexadecimal) that the cells immediately after the identified deleted nk record are allocated, and therefore the potentially useful information from the nk record e.g. the key name, has been overwritten by the cell that follows. However, in the next
example it can be seen that the cells that follow the identified deleted nk record have been marked as unallocated and so there is potential for recovery. This is shown in Figure 4.
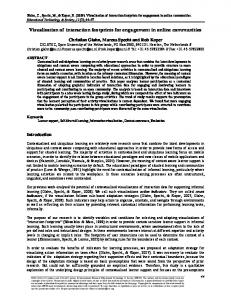
Figure 4: Deleted nk record headers are shown in red. The cells after one of them have been selected and the hexadecimal content is displayed on the right. As can be seen in the hexadecimal view of the recoverable nk record, the complete Registry key can be recovered, including key name and parent ID. Using this information, it can be determined that it is a deleted key from within the USB Enum key and contains a VID (07AB) and PID (FCF6) of an attached USB stick. Significant care must be taken in interpreting any deleted data and a thorough understanding of the binary structure of Registry keys should be sought before any conclusions drawn from the data displayed.
5. Evaluation and Limitations This paper has demonstrated that visualisation of a block based operating system file using a block size that relates to its internal structure could offer potential benefit to digital investigations. It should be noted that this tool is a prototype that demonstrates a concept, rather than a software engineered final product. In terms of evaluating the visualisation, no formal user study was conducted, so demonstration of the usefulness of the visualisation is supported only by the deleted nk record case study in the results section. A more thorough user study would be beneficial, including aspects of design including icons, use of colour, importance of speed of rendering, etc. This is particularly important in terms of drawing any conclusions about the effectiveness of the visualisation approach compared to automated criteria-based record carving such as those discussed in Thomassen (2008) or Morgan (2008). However, it may be possible that if a file format existed
that could be parsed, but no data carving approach had yet been developed, this approach would allow those blocks that were not processed during the ‘live’ data parsing to be identified and inspected for data relevant to the case, or possibly used to assist in the development of a deleted data carving approach. While this paper has shown that block based tagging and visualisation allows identification of areas of the Windows Registry that may contain recoverable information, this has not yet been extended to other block based file systems. To overcome this limitation, potential files that could be investigated include Internet Explorer index.dat files, SQLite databases and many others.
6. Conclusions and Future Work This paper has shown that a block-based visualisation of the internal structure of the Windows Registry potentially offers insight into areas that may contain recoverable deleted data. The work certainly supports the sentiment in Conti et al (2010), which states “It is possible to create a visualization enhanced analysis system that combines the functionality of the best hex editors with the strengths of visualization.” Combining the block-based visualisation with more interactive elements e.g. a keyword search followed by viewing the hit in context may also be of interest. This should also be expanded to other file formats, as discussed earlier. In addition a formal evaluation of the use of such visualisations should be conducted both for analysis and also for the teaching of binary structures of files. In any case, in order to facilitate any such visualisation, the internal structure of a file needs to be interpreted and the contents of blocks in some way recorded. This paper has demonstrated one mechanism by which this is possible.
7. References Ballenthin, W. (2013) Python-Registry [online], williballenthin.com, available: http://www.williballenthin.com/registry/ [accessed 15 Feb 2013]. Carrier, B. (2005) File System Forensic Analysis, 1st ed, Addison-Wesley Professional. Carvey, H. (2013) RegRipper [online], regripper.wordpress.com, available: http://regripper.wordpress.com/ [accessed 15 Feb 2013]. Conti, G., Dean, E., Sinda, M., Sangster, B. (2010) ‘Visual reverse engineering of binary and data files’, VizSec, 1–17. Cortesi, A. (2012) Visualizing Entropy in Binary Files [online], corte.si, available: http://corte.si/posts/visualisation/entropy/index.html [accessed 15 Feb 2013]. Jones, K.J. (2003) ‘Forensic Analysis of Internet Explorer Activity Files’, Web, 1–30. Marty, R. (2008) Applied Security Visualization, Addison-Wesley. Morgan, T.D. (2008) ‘Recovering deleted data from the Windows registry’, Digital Investigation, 5(Supplement 1), S33–S41. Norris, P. (2009) The Internal Structure of the Windows Registry. Cranfield University MSc Dissertation. Pereira, M.T. (2009) ‘Forensic analysis of the Firefox 3 Internet history and recovery of deleted SQLite records’, Digital Investigation, 5(3-4), 93–103. Russinovich, M.E., Solomon, D.A. (2009) Windows Internals, 5th Edition, Microsoft Press. Thomassen, J. (2008) Forensic Analysis of Unallocated Space in Windows Registry Hive Files. University of Liverpool, MSc Dissertation.