Hengl T.
Visualisation of uncertainty
Visualisation of uncertainty using the HSI colour model: computations with colours Tomislav Hengl International Institute for Geo-Information Science & Earth Observation (ITC), P.O. Box 6, 7500 AA Enschede, the Netherlands Telephone +31 (0)53-4874227; FAX +31 (0)53-4874336; Email
[email protected]
Abstract Paper describes two GIS methods for visualisation of uncertainty associated with spatial prediction of continuous and categorical variables. In the case of continuous variables, the key issue is to visualise both predictions and the prediction error at the same time, while in the case of categorical data, the key issue is to visualise multiple memberships and confusion in-between them. Both methods are based on the Hue-Saturation-Intensity (HSI) colour model and calculations with colours using the colour mixture (CM) concept. The HSI is a psychologically appealing colour model – hue is used to visualise values or taxonomic space and whiteness (paleness) is used to visualise the uncertainty. In the case of continuous variables, a twodimensional legend was designed to accompany the visualisations – vertical axis (hues) is used to visualise the predicted values and horizontal axis (whiteness) is used to visualise the prediction error. In the case of categorical variables, a circular legend is used – perimeter (hues) defines the taxonomic space and radial distance represents the confusion. The methods are illustrated using two examples: (a) interpolation of soil thickness using regression-kriging and (b) fuzzy k-means classification of landforms classes.
1. Introduction The maps of natural resource inventories are often visualised using either (a) greyscales or colour scales for continuous variables (e.g. map of pH of soil, occurrence of tree species, biomass density, birds density) and (b) sets of different colours for categorical variables (e.g. map of soil types, forest vegetation types, geomorphic classes, land cover classes, geological units). Visualisation of uncertainty has not been of much interest in the last century and its influence on decision-making has often been ignored. This gives a false impression, as the maps are 100% correct in all parts of the study area. Uncertainty, which can be defined as unpredictability or indefiniteness of the prediction models, can in many cases be estimated from the statistical models. For example, a typical result of (geo)statistical interpolation is a map of predictions, accompanied with a map of the prediction error, so called kriging error map. In the case of ordinary kriging, the kriging error map typically shows a granular pattern – uncertainty increases as we get farther away from the points, which reflects the interpolation model. With the emerging of various quantitative GIS tools, uncertainty is becoming an important aspect of mapping process (Goodchild et al., 1994). Its visualisation allows users to investigate the effects of different decisions. In the past decade, there has been an increasing interest for modelling and visualisation of uncertainty, both to visualise the results of the spatial prediction and impact of the propagated uncertainty on decision-making. Hootsmans (1996) compared visualisation of uncertainty using different colour variables – saturation, intensity and hues. Jiang (1996) investigated some new fuzzy colour systems for visualisation of uncertainty. Number of pilot applications for the managing and visualising spatial uncertainty can be found in the Proceedings of the “Accuracy” conferences (Heuvelink and Lemmens, 2000; Mowrer and Congalton, 2000; Hunter and Lowell, 2002). Foody and Atkinson (2002) give an overview of the most recent studies in modelling the uncertainty in GIS. Geocomputation 2003
1
Hengl T.
Visualisation of uncertainty
In this paper, I describe two static GIS techniques for visualisation of uncertainty in spatial data using calculation with colours – one for visualisation of uncertainty of interpolating continuous data and one for visualisation of uncertainty of continuous classification (categorical variables). In both cases, I used computations with the colours as implemented in the Integrated Land and Water Information System (ILWIS) (Unit Geo Software Development, 2001), following the Hue Saturation Intensity (HSI) colour model and Colour Mixture (CM) concept1. ILWIS was chosen because it enables calculation with colours within the map calculator. This includes extraction of colour variables such as hue, saturation, intensity and conversion from RGB to HSI colour spaces.
2. Computations with colours 2.1 The HSI colour model The first important requirement for successful visualisation of uncertainty is to select a psychologically appealing colour model. For example, a logical colour variable to visualise uncertainty is whiteness2 or paleness. This was confirmed, for example, by Jiang (1996) who conducted a number of perception tests. To visualise the actual predictions, many GIS packages use colours with constant saturation and intensity, so called pseudo-colour legend in ILWIS. Hence, HSI3 model seems to be the most promising for the visualisation of uncertainty. Another important reason to use this colour model is the fact that it is geometrically related to the RGB colour cube, which makes it possible to calculate intermediate and mixed colours. The formulas for RGB to HSI transformations often differ between software. The one used in ILWIS, follow the geometric design of the RGB colour cube (Fig. 1a):
H=
3 [G + B] ⋅ 240 360 ⋅ arctan ⋅ [G − B ], R − 2π 2 360 2
S = R2 + G2 + B2 − R ⋅ G − R ⋅ B − G ⋅ B ⋅ I=
R + G + B 240 ⋅ 3 255
240 255
(1)
(2) (3)
The input R, G and B are coded from 0-255 while H, S and I are coded to from 0-240 to comply with the colour scheme used in Microsoft Windows.
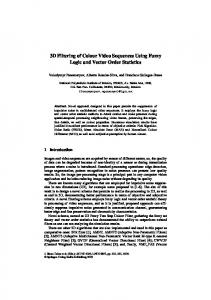
2.2 Designing the legends The second important task for the visualisation of uncertainty is to design suitable legends to accompany the CM maps. In this case, two special legends (Fig. 1b and c) were designed: 1. Two-dimensional legend – This legend is used for continuous variables. Here, vertical axis
Colour mixture means that the visualisation is based on the mixing of colours, i.e. by doing map calculations with colours in a GIS or image processing software. See section 3 and 4 for more details. 1
Whiteness is amount of the white colour, which in the colour cube can be visualised as the shortest distance to the white corner of the RGB colour cube.
2
3
The hue (H) represents the visual sensation of the colour type, and is calculated as the number of degrees around the axis. The saturation (S) represents the degree to which the colour expresses its hue, and is calculated as the radial distance from the diagonal axis. The intensity (I) represents the visual sensation of brightness.
Geocomputation 2003
2
Hengl T.
Visualisation of uncertainty
represents the predicted values and horizontal axis (whiteness) is used to visualise the prediction error. On the vertical axis, hues range from blue for low values (-90˚) to red for high values (-30˚), which corresponds to the pseudo-colour scale used in many GIS packages for visualising continuous variables (Unit Geo Software Development, 2001). On the horizontal axis, the saturation-intensity changes lineary from low to total whiteness (Fig. 1b). In this case, full colour means the minimum uncertainty and full whiteness indicates the maximum uncertainty. Note that a part of the hue circle representing magenta (-30˚ to -90˚) has been omitted to avoid confusion between high and low values. 2. Colourwheel – This legend is used to accompany the results of continuous classification. Here, a circular (HSI colourwheel) legend is used (Niblack 1986, pp. 61) – perimeter (hues) defines the taxonomic space and radial distance represents the confusion (Fig. 1c). In this case, classes that are closer on the colour wheel are also more similar taxonomically. Towards the centre of the circle the colours become whitish, that is, the hues become less distinct. This represents the situation where we are less sure about the components of any mixture (Hengl et al., in press-a). Note that the above-described legends, once designed, can be used for different thresholds and different number of classes.
(b )
= -30 o
red white
yellowish
(a )
green
green
cyan
yellow
blue
= -90 o
cyan white
S=0 I = 240
S = 240 I = 120
( c) green
90 o
30 o
150 o
black
yellowish
red white
cyan
red 0o
blue magenta
-30 o
-150 o
magenta
blue -90 o
Fig. 1. Design of the legends for visualisation of uncertainty: (a) Hue-Saturation-Intensity colour model and the Red-Green-Blue colour cube; (b) the two-dimensional legend used for visualisation of uncertainty in quantitative data and (c) the circular colour legend (colourwheel) used for categorical data. φ is the hue angle in degrees measured clockwise.
3. Continuous variables In the case of continuous variables, we are primarily interested to visualise both the predictions and the prediction error at the same time. The uncertainty is represented with the standard deviation of the prediction error (or shortly prediction error), which can be mapped through-out the study area. A simpler solution is to divide the prediction error of the transformed variable by the total variance of observed samples. This is the normalized or relative prediction error expressed in percentage (Hengl Geocomputation 2003
3
Hengl T.
Visualisation of uncertainty
et al., in press-b):
σ E , r ( s0 ) =
σ E ( s0 ) sz
(4)
where σ E ( s0 ) is the prediction error and s z is the standard deviation of observed samples. A satisfactory prediction is when the model explains more than 85% of the total variation. As a rule of thumb, we can consider that a value of σ E ,r (s0 ) close to 40% means a fairly satisfactory accuracy of
prediction. Otherwise, if the values get above 80%, the model accounted for less than 50% of variability at the validation points and the prediction is unsatisfactory. The map of predictions and prediction error can be visualised simultaneously by coding the predictions with hues and uncertainty with whiteness. First, the predictions are coded to hue using:
ϕ1 = −90 + zr ⋅ 300
(5)
ϕ + 360 if ϕ1 ≤ −360 ϕ2 = 1 if ϕ1 > −360 ϕ1
(6)
where φ1 is the hue angle in degrees measured clockwise, φ2 is the value transformed to the –360 to 360 range and zr are the predictions ( zr ∈ [ 0,1] ). The HSI-coded image is then derived using:
H = (ϕ 2 + 360) ⋅
240 360
(7)
S = (1 − ur ) ⋅ 240
(8)
I = (1 + u r ) ⋅120
(9)
where ur is the prediction uncertainty ( ur ∈ [ 0,1] ). Note that the input values for predictions and prediction error need to be stretched before coding by using:
zr =
σ −u zˆ − z1 ; ur = E , r 1 u2 − u1 z2 − z1
(10)
where zˆ is the prediction map, σ E ,r is the relative prediction error map standardised using Eq. (4), z1
and z2, and u1 and u2 are the lower and upper inspection range limits for the predicted values and relative prediction error. For predicted variables, the range limits are the measured minimum and maximum and for uncertainty the above-mentioned thresholds can be used (40% and 80%). From the HSI images, the RGB composite image is derived using the ILWIS command: z RGB = colorhsi [ H , S , I ]
(11)
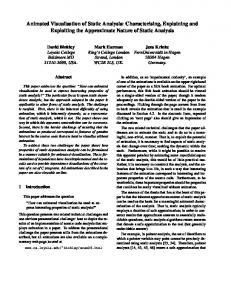
Note that, from Eqs (5) to (7), the lower values are coded bluish (hue angle from -90˚ to -150˚) and highest values are coded reddish (hue angle from -330˚ to -30˚). The intermediate values are coded with cyan, green and yellowish. The combined visualization gives insight into the relationship between uncertainty and input data for the given thresholds. In this example (Fig. 2b), success of interpolation of topsoil thickness is quantified using the whiteness. The corrected brightness values are: (a) equal to the original RGB for a relative uncertainty equal or less than 40%, and (b) completely white for relative uncertainty equal or higher than 80%. The visualisation resulted in most of the map distant from the points being pale. These areas would probably need additional samples or more suitable prediction models. See http://www.itc.nl/personal/hengl/GRK/ for full-colour animation of prediction uncertainty. Geocomputation 2003
4
Hengl T.
Visualisation of uncertainty
Fig. 2. Visualisation of uncertainty for a quantitative variable (topsoil thickness in cm) interpolated using regression-kriging: (a) standard visualisation using pseudo-colour legend used in many GIS packages and (b) uncertainty included with whiteness and the accompanying two-dimensional legend.
4. Categorical maps Production of categorical maps is commonly based on training and classifying the input attribute maps. For example, map of land cover types can be produced by training and classifying the remote sensing (multi-spectral) images. Nowedays, it is becoming more interesting to use some continuous classification systems and produce quantitative predictions. The membership maps are most commonly derived using fuzzy k-means classification (Burrough et al., 1997). Here, a membership is calculated from the standardised distance in the attribute space: −
1
d c2 (i ) ( q −1) ; c = 1, 2,...k ; i = 1, 2,...n µ c (i ) = k 1 − 2 dc (i ) ( q −1)
(12)
µi (c) ∈ [ 0,1]
(13)
∑ c =1
where µc(i) is a fuzzy membership value of the ith object in the cth cluster, d is the similarity distance, k is the number of clusters and q is the fuzzy exponent4 determining the amount of fuzziness. In this case, the key issue is to visualise multiple memberships and confusion in-between them. The can be achieved by mixing colours in each pixel (i) as an averaged intensity of RGB bands. The new derived Ri, Gi, Bi raster maps are first calculated separately for each of the three primary colours: k
Ri =
∑ (µ
i ,c
⋅ Rc )
c =1
(14)
n
∑µ
i ,c
i =1
4
A commonly-suggested value for q is 1.5.
Geocomputation 2003
5
Hengl T.
Visualisation of uncertainty k
Gi =
∑ (µ
⋅ Gc )
i ,c
c =1
(15)
n
∑µ
i ,c
i =1
k
Bi =
∑ (µ
i ,c
⋅ Bc )
c =1
(16)
n
∑µ
i ,c
i =1
where the Ri, Gi, Bi are the new derived mixed colours, Rc, Gc, Bc are the digital values (0-255) for selected class colours and k is the number of classes. The RGBs can be then visualised as a colour composite. Prior to calculation of mixed colours, it is important to select the class hues that reflect the taxonomic similarity of the classes. The problem is that the number of attributes can be large, so that the allocation of class centres on the colourwheel is not easy. One solution is to use the first and the second factor loading of the factor or principal component analysis as the axes of a reduced attribute space. This is the so-called biplot display (Gabriel, 1971). The Hue of each class is then derived as the angular distance around the gravity centre, which, in the case of factor loadings, is the centre of the coordinate system: Hc =
360 240 ⋅ arctan ( F1c , F2 c ) ⋅ 2π 360
(17)
where Hc is the new derived class Hue and F1c and Fc2 are the factor loadings in the cth class. To display the class colours in the GIS, the Hc, Sc, Ic values (where Sc=240 and Ic=120) need to be first transformed to RGB and then can be used to calculate CMs with Eqs (14) to (16). The confusion between the classes is emphasized using the whiteness, i.e. amount of white colour by replacing the constant brightness with the saturation of :
[ Ri* , Gi* , Bi* ] = colorhsi [ H i , Si ,(120 + 0.5 ⋅ Si )]
(18)
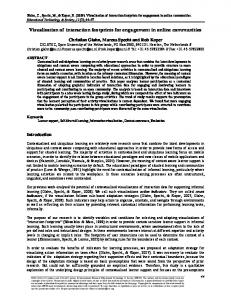
where Hi, Si are the hue and saturation maps derived from the CM map and Ri*, Gi* and Bi* are the corrected RGBs. Now, both saturation and brightness changes radially, i.e. brightness changes from 120 (circumference) to maximum brightness (255 or the centre of colourwheel). The design of the method is explained in more detail in (Hengl et al., in press-a). The following example (Fig. 3) shows visualisation of results of classifying nine landform facets using supervised fuzzy k-means classification. The colour values are considered to represent the taxonomic relationship between the classes. Coordinates of the nine class centres (landform facets) were first transformed from multivariate to two-dimensional attribute space, and then projected on the HSI colourwheel (Hengl et al., in press-a). Classes that are closer in attribute space will be merged into similar generic colours. The colour-mixture technique limits the derived CM map to seven generic hues independently of the total number of classes, which provides basis for automated generalisation. The CM map (Fig. 3b) shows intermediate colours between similar classes (i.e. along the circumference), which represent intergrades in taxonomic space and therefore are ssigned intermediate colour. On the other hand, intergrades between strongly-contrasting classes finished having colours towards the centre of the circle, i.e. being whitish. For example, intermediate pixels between escarpment (Hi211) and the two terrace levels (Pl311 and Pl411) show almost white colour. This is psychologically appealing – pure white colour represents a mixture of strong contrasts or an Geocomputation 2003
6
Hengl T.
Visualisation of uncertainty
undefined class, where a mixture of similar classes results in a transitional colour.
Fig. 3. Visualisation of uncertainty for a categorical variable (landform facets): (a) the common double-crisp system where map shows crisp transitions and crisp classes and (b) CM map with uncertainty coded with whiteness. Landform classes are: Hi111 (hill summit), Hi112 (shoulder), Hi211 (scarp), Hi212 (colluvium), Hi311 (vale slope), Hi312 (vale bottom), Hi411 (glacis slope), Pl311 (high terrace) and Pl411 (low terrace).
Compare the CM map with the conventional double-crisp approach where the colours are selected subjectively, thus, often giving wrong idea about the similarity between the classes (Fig. 3a). On contrarily, in the case of the CM map, categorical classes are not sorted one above each other as they are in the traditional concepts. A circle has no beginning and therefore indicates that the classes are not ordinal. Similarly, some classes can be located closer and some farther apart on the circumference. The saturation derived from the CM map allows extraction of primary transition zones between fairly contrasting classes. Moreover, it can be used to locate areas of high taxonomic confusion (inter or extra-grades), i.e. to redesign the map legend or make additional sampling on the field.
5. Conclusions and discussion Visualisation of both predictions and prediction uncertainty, as explained in section 3, offers a possibility to enhance visual exploration of the data uncertainty and compare different prediction methods or predictions of totally different variables. The whitish area can be simply interpreted as unsatisfactory predictions, i.e. areas that need additional samples. The limitation of using the twodimensional legend is that it is not easy to match the colours on the HSI coded image and the legend because the pale colours are harder to distinguish. Moreover, it is not easy to read the actual uncertainty within the ±5% of the relative prediction error by just looking at the whiteness of the map. The limitations of visualising the multiple memberships using the colour mixing are as follows. First, the colours can still be derived from different combinations of memberships, i.e. the class centres are considered to be as relative as the definition of classes. The original memberships can not be accurately back-derived as we do not know from which combination of membership was it derived. The second limitation is that we were forced to reduce the attribute space to only the first and second components. Thus we have discarded information in this reduced attribute space, as only part (67% in this case) of total variation was explained with first two components. An alternative would be to develop a more accurate method to use distances between the class centres to allocate them on the circumference of the colourwheel. Moreover, it is possible that some other colour model (Lab, CIE, Luv, Munsell etc.) would be more suitable to enhance calculations with colours. Geocomputation 2003
7
Hengl T.
Visualisation of uncertainty
Both visualisation algorithms can be applied in any image processing or general GIS package that allows computations with colours. Some parts of the CM principles could be used in a more interactive way. For example, by linking resulting CM map to the sample set points, so that a mapper could inspect class definition interactively. The next steps will be to improve the design of the legends and make technically correct metric legends and develop interactive tools using animations and real-time object linking.
6. References BURROUGH, P.A., GAANS, P.F.M. and VAN HOOTSMANS, R., 1997. Continuous classification in soil survey: spatial correlation, confusion and boundaries. Geoderma, 77, 115-135. CRESSIE, N.A.C., 1993. Statistics for Spatial Data (New York: John Wiley & Sons). FOODY, G.M. and ATKINSON, P.M., 2002. Uncertainty in Remote Sensing and GIS. (London: Wiley Europe). GABRIEL, K.R., 1971. The biplot graphical display of matrices with applications to principal component analysis. Biometrika, 58, 453-467. GOODCHILD, M., CHIH-CHANG, L. and LEUNG, Y., 1994. Visualizing Fuzzy Maps. In: H.M. Hearnshaw and D.J. Unwin (Editors), Visualisation in Geographical Information Systems (London: John Wiley and Sons Ltd.), pp. 158-167. HENGL, T., WALVOORT, D.J.J., BROWN, A. and ROSSITER, D.G., 2003a. A double continuous approach to visualisation and analysis of categorical maps. Int. Jou. of Geographical Information Science, in press. HENGL, T., HEUVELINK, G.M.B. and STEIN, A., 2003b. A generic framework for spatial prediction of soil variables based on regression-kriging. Geoderma, in press. HEUVELINK, G.B.M. and LEMMENS, M.J.P.M., 2000. Proceedings of the 4th International Symposium on Spatial Accuracy Assesment in Natural Resources and Environmental Sciences (Accuracy 2000) (Amsterdam: Delft University Press). HOOTSMANS, R.M., 1996. Fuzzy sets and series analysis for visual decision support in spatial data exploration. PhD Thesis, (Utrecht: University of Utrecht). HUNTER, G.J. and LOWELL, K., 2002. Proceedings of the 5th International Symposium on Spatial Accuracy Assesment in Natural Resources and Environmental Sciences (Accuracy 2002) (Melbourne: Accuracy 2002), pp. 300-309. JIANG, B., 1996. Fuzzy Overlay Analysis and Visualization in Geographic Information Systems. PhD Thesis, (Utrecht: University of Utrecht). MOWRER, H.T. and CONGALTON, R.G., 2000. Quantifying Spatial Uncertainty in Natural Resources: Theory and Application for GIS and Remote Sensing. (Chelsea, MI: Ann Arbor Press). NIBLACK, W., 1986. An Introduction to Digital Image Processing. Prentice/Hall International. UNIT GEO SOFTWARE DEVELOPMENT, 2001. ILWIS 3.0 Academic user's guide. (Enschede: ITC).
Geocomputation 2003
8