Visualizing and Assessing Navigation in Hypertext John E. McEneaney Division of Education Indiana University South Bend South Bend, IN 46634-7111, USA Tel/Fax: 219-237-4576 / 219-237-4550 Email:
[email protected] ABSTRACT
Numerical measures and metrics have also been proposed to help assess global properties of hypertext that may be related to the difficulties users experience. Some of these metrics [1] have been imported directly from other disciplines, most notably from social network theory, where there is a long history of using proximity measures that have been more recently applied in hypertext research. Other metrics have been developed to address the specific needs and perspectives of hypertext researchers (e.g. [3]).
User navigation has been a central theme in both theoretical and empirical work since the earliest days of hypertext research and development. Studies exploring user navigation have, however, tended to rely on indirect navigational measures and have rarely tried to relate navigation to performance solving problems or locating information. The purpose of this paper is to propose methods that lead to a more direct representation and analysis of user movement in hypertext and to empirically explore the relationship of resulting measures to performance in a hypertext search task. Results of this study support the claim that the proposed graphical and numerical methods have empirical significance and may be useful in applications related to assessing and modeling user navigation.
There has also been interest in developing a better understanding of how users navigate hypertext under various task and environmental conditions. Some of these studies have employed “static” measures related to numbers of nodes or links accessed, measures of time and path length [29, 26, 19] or analyzed selected episodes of movement, tabulating navigation within or across sections of a network [29]. Some investigators have applied statistical techniques to identify “clusters” of nodes and interpret user navigation in terms of these constructs [17]. Other statistical approaches include collapsing data from large numbers of users into state transition probability tables that are used as a basis for analysis [7], and identification of statistical benchmarks that might be useful in developing theoretical models [26, 23].
visualization; user paths; path analysis; patterns; navigation metrics; empirical
KEYWORDS:
navigation validation.
INTRODUCTION
In response to problems related to hypertext navigation, researchers and developers have created a variety of powerful tools, many of them based on visualization techniques. Site maps are now commonly used and there is evidence that users find them helpful in navigating and in establishing a clearer idea of the organizational structure of a site [8, 32]. In larger networks where complete site maps are impractical, fish-eye views [12, 28, 2], clustering techniques that organize nodes into meaningful groups [13, 21], and a variety of other filtering and mapping techniques (e.g. [15, 22]) have been developed to assist both in development and use of large scale hypertext networks.
Perhaps the most consistent trend in user navigation research however is the use of navigational “paths” as a primary source of data. Although the concept of a path has been referred to using a variety of terms including “route” [4], “user trail” [14], “audit trail” [20] and others, these terms all refer to data sets that record the sequence of nodes visited by a subject in a hypertext session and often also include measures of time related to visits. That user paths are commonly employed in navigational studies should be no surprise. Although a time-stamped path misses deliberations that go into a users’ decision making (e.g. a pointer hovers momentarily over one link before moving on to another that is clicked), a path represents the single most complete measure of user navigation and thus affords an important window on the search process [17]. Moreover, since data can be recorded and formatted in an unobtrusive manner on-the-fly, this approach provides empirical
Permission to make digital or hard copies of all or part of this work for personal or classroom use is granted without fee provided that copies are not made or distrinbuted for profit or commercial advantage and that copies bear this notice and the full citation on the first page. To copy otherwise, to republish, to post on servers or to redistribute to lists requires prior specific permission and/or a fee. Hypertext 99 Darmstadt Germany Copyright ACM 1999 1-58113-064-3/99/2...$5.00
61
investigators with a powerful data collection tool that has the additional benefit of being seamlessly integrated with the delivery of experimental materials.
navigation is based on the traditional node-and-link model. At least part of the popularity of this model can be attributed to two simple but powerful formalisms that support analysis: adjacency matrices that are well suited to computational analysis and labeled directed graphs (digraphs) that present structural information in a readily interpreted visual format. Both of these formalisms have played important roles in earlier work establishing metrics to assess structure in hypertext and they serve similar roles in the present study.
For all of the interest in navigational paths however there have been relatively few studies that have sought to examine the relationship between patterns of navigation and outcome measures. Two exceptions are studies by Smith [30] and Cardle [5], both of whom investigated the relationship of informal measures of search success (i.e. displays of frustration or confidence by subjects) with a path efficiency measure. Both of these studies, however, were based on static navigational measures (e.g. number of pages visited) that did not attempt to incorporate spatial or directional aspects of user paths. Other studies that sought to relate path data to outcome measures have been based on similarly indirect path measures. Chang and McDaniel [6], relied on video transcripts of their subjects and accompanying “think aloud” data to subjectively categorize navigational patterns. Pirolli, Pitkow, and Rao [25] and Chen [7] adopted a more quantitative focus on user paths but employed large-scale aggregate data drawn from web server statistics. By using these aggregated data sets, however, the “paths” studied had to be inferred from access logs and were thus subject to problems related to firewalls, proxy masking of user identity, intentional reloading of documents by users, and missed hits as a result of local browser caches.
The two structural metrics of special interest in the present study are compactness and stratum [3]. The purpose of these metrics is to yield global network-based assessments of structure that are grounded in node-based centrality measures. Briefly, compactness refers to the overall connectedness of a network with more sparsely linked networks resulting in values for compactness close to 0, while densely connected networks yield compactness closer to 1 (a continuum labeled “sparse vs. rich” hypertext by Nielsen [24]). Stratum, on the other hand, refers to the degree of linearity of a network, as indicated by the extent to which a network is organized so that certain nodes must be read before others. Stratum also ranges between 0 and 1, with more linear networks closer to 1 and more web-like networks closer to 0. Although compactness and stratum were originally developed to assess the structure of hypertext networks, subsequent work [27] has suggested that these same metrics might be usefully applied as tools in assisting users navigate networks. The present study attempts to broaden the application of these metrics still further by proposing adaptations intended to support the analysis of user movement in hypertext. Before considering how these metrics can be adapted, however, it will be useful to be more specific both about the larger conceptual framework that supports the proposed methods and the concept of a path.
Although discrete static measures, informal descriptive characterizations, and aggregated summarizations of user navigation are useful starting points, our understanding of user navigation will be significantly enhanced if user movement can be more directly represented, analyzed, and related to performance outcomes. It is the purpose of this paper to achieve these ends - to define methods that support more direct representation and analysis of user paths and to empirically relate resulting measures to hypertext search outcomes.
Conceptual Preliminaries
Distance matrices have proven to be particularly useful for analyzing hypertext networks. Each cell Dij in a distance matrix identifies the minimum number of steps required to move from node i to node j. By convention, the distance from a node to itself is “0” and the distance to unreachable nodes is infinite. In circumstances where infinite values complicate subsequent computation, they are replaced with a conversion constant K (usually set equal to the number of nodes in the network), resulting in a converted distance matrix. Sums across rows in the converted distance matrix (3jCij) are referred to as converted out-distances and represent the centrality of nodes when considered as points of departure. Sums down columns in the distance matrix (3iCij) are referred to as converted in-distances and represent the centrality of nodes as destinations. The sum of all entries in the converted matrix is referred to as the converted distance (CD) of a network and is commonly
In this paper, user paths will be analyzed in two different ways. One form of analysis is based on a graphical method intended to illustrate user paths in a way that makes navigational patterns visually distinct. The second form of analysis relies on path-specific structural metrics that are related to the visually distinct categories identified by graphic analysis. Following definition of these path metrics, the paper will report on an experimental study that explores the relationship between the proposed measures and a quantitative search outcome measure. The paper will conclude by considering limitations of the proposed methods and will suggest some potential applications of the proposed methods and metrics. VISUALIZING AND ASSESSING NAVIGATION
The framework adopted to visualize and assess user
62
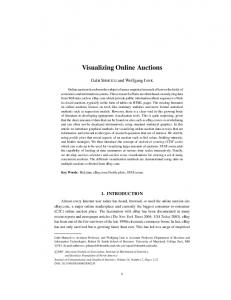
Calculation of the proposed path metrics, like their structural counterparts, requires a distance matrix and suitable conversions. Consider, for example, the path in Figure 1A, consisting of 17 transitions, beginning and ending at node 6. The path matrix is constructed by creating a suitably labeled matrix that includes each distinct node in the path and then incrementing the appropriate cell for each transition represented. The resulting path matrix (Figure 1B) indicates the number of transitions from each node to every other node in the path.
employed to normalize in- and out-distances so that comparisons can be made between networks that differ in size or connectedness. A path P in a network is simply the sequence of nodes or pages visited by a reader during a browsing session (i.e. P = +p1,p2,p3,...,pL,, where L refers to the length of the path or number of node visits). Although this use of the term “path” deviates from its meaning in the underlying graphtheoretic framework (since it allows nodes to appear more than once), this usage has been adopted in recent work [25, 10, 9] and will be employed in the present study as well. Since nodes can occur in more than one position in a path, however, the length of a path may not correspond to the number of distinct nodes visited and this has some important consequences for both path visualization and the calculation of metrics based on path matrices. The Path Matrix And Its Derivatives
Unlike the distance matrix described earlier that represents distances between nodes, a path matrix represents frequencies of node transitions during a browsing session from each node in the path to every other node in the path [25]. If the hypertext under consideration is closed, the path matrix can also be normalized by representing every node in the hypertext as a whole, regardless of whether a node appears in the path. As a result of this expansion, it is possible to sum individual user paths into group “paths”. The normalizing expansion of the path matrix is achieved by inserting rows and columns filled with zeroes in the appropriate places in the path matrix so that every node in the hypertext is represented. The net result of this expansion is to embed the path within the larger structure of the hypertext. The structural features of the original path matrix are, however, preserved while establishing a normal form for all paths.
6
15
16
21
23
24
30
35
37
6
0
1
0
2
1
0
1
1
1
15
0
0
1
0
0
0
0
0
0
16
1
0
0
0
0
0
0
0
0
21
1
0
0
0
0
0
1
0
0
23
0
0
0
0
0
1
0
0
0
24
1
0
0
0
0
0
0
0
0
30
2
0
0
0
0
0
0
0
0
35
1
0
0
0
0
0
0
0
0
37
1
0
0
0
0
0
0
0
0
6
15
16
21
23
24
30
35
37
6
0
1
2
1
1
2
1
1
1
15
2
0
1
3
3
4
3
3
3
16
1
2
0
2
2
3
2
2
2
21
1
2
3
0
2
3
1
2
2
23
2
3
4
3
0
1
3
3
3
24
1
2
3
2
2
0
2
2
2
30
1
2
3
2
2
3
0
2
2
35
1
2
3
2
2
3
2
0
2
37
1
2
3
2
2
3
2
2
0
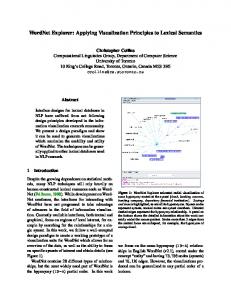
A. Converted distance matrix for the path in Figure 1A.
B. Path diagram for the path in Figure 1A.
Figure 2. The converted distance matrix and path diagram for the path in Figure 1A.
The distance matrix and converted distance matrix for a path are created through straightforward adaptations of the procedures described by Botafogo et al. [3, 27], with one important difference. Creation of a distance matrix for a path begins by substituting a value of “1” for all entries in the original path matrix that exceed one (i.e., that represent multiple transitions) and then generating a distance matrix as would be done with an adjacency matrix representing a hypertext. For path stratum, no further conversion is needed. The path compactness metric, however, requires conversion, replacing infinite cell entries with the conversion constant K, where K equals the number of nodes in the original path matrix (Figure 2A). The path diagram is constructed from the original path matrix by creating a vertex for each node represented and an arc for each nonzero cell entry (Figure 2B).
A. Path:¢¢6,30,6,37,6,15,16,6,21,6,21,30,6,23,24,6,35,6¦¦.
to from
to from
B. Path matrix for the path above.
Path Metrics
Figure 1. A path across a larger 78-node hypertext (A) and its resulting path matrix. (B).
Although the computational procedures involved in generating path metrics are straightforward manipulations of the structural metrics they are based on [3, 27], there is an important difference between path matrices and corresponding structural matrices. In structural matrices,
63
every node in the hypertext is represented but this is clearly not the case in the path matrix presented in Figure 1B, which only represents nodes actually in the path. While the expanded path matrix does represent all nodes in the hypertext it will usually be much larger than the path matrix and this has significant consequences for both path visualization and metrics, suggesting that the path matrix rather than the expanded path matrix should serve as the basis for subsequent visualization and calculation.
are in the path. PMax and PMin are given by PMax 'K(n 2 & n), and PMin ' (n 2 &n), where n is simply the order of the path matrix. Path stratum (PSt) is also defined in a manner analogous to its structural equivalent with PSt '
With respect to visualization, use of the expanded path matrix will tend to crowd the display of a path with large numbers of isolated (i.e. unconnected) nodes that do little more than communicate the size of the network traversed, something more easily done by simply reporting this information. A second problem introduced by using the expanded path matrix is that subsequent calculations will tend to be dominated by the conversion constant. Since most paths traverse only small portions of hypertexts, the expanded distance matrix will typically include large numbers of unreachable nodes with infinite entries that, on conversion, will be replaced by K, the conversion constant. Although the influence of the conversion constant can be moderated somewhat by scaling this constant up or down, it seems counterproductive to define a metric in a way that knowingly obscures the variability that is of greatest interest.
where the absolute prestige of a path is defined similarly to a network with the exception that the distance matrix is derived from a path matrix rather than an adjacency matrix. The linear absolute prestige (LAP) that serves as the normalizing measure for this metric is also defined analogously to the structural metric, based on the number of distinct nodes (n) in the path with
LAP '
( PMax & PMin )
, if n is even.
n3 & n , if n is odd. 4
The purpose of this section is to describe the results of an empirical study designed to assess whether the proposed measures are empirically meaningful in the sense that they can be shown to be related to objective categories of users. More specifically, the focus of the present validation will be to determine whether the proposed graphic techniques and path metrics can be shown to be associated with user success in a hypertext search task. Participants in the validation study were adult students at a medium-sized Midwestern public university in the USA. Identities of subjects were coded so that individuals could not be identified and all procedures were reviewed and approved by a university human subjects board. A total of 89 teacher education students participated, with data collection extending across both terms of the 1997-1998 academic year. The experiment required subjects to respond to a set of academic advising questions using an electronic student advising handbook. Subjects were to answer as many questions as possible within a 15-minute period. The handbook consisted of approximately 31,000 words in 78 text nodes structured in a hierarchical-linear fashion with major handbook divisions organized hierarchically and nodes within those divisions organized in a linear fashion. The handbook duplicated the content and overall structure of a print version that had been in use for a number of years.
As a consequence of these considerations, it is possible to define path compactness and path stratum, the specialized metrics that are a central objective of this study. Path compactness (PCp) refers to the complexity of a user’s path, based on the same notion of connectedness employed in the corresponding structural metric and is formally defined as (PMax &Ei Ej PCij )
n3 4
EMPIRICAL VALIDATION
Although a complete representation of nodes is clearly needed in assessing network structure, trying to distinguish user paths within a visual display of a larger network seems ill-advised. The very nature of path analysis, particularly when it attempts to treat individual users, suggests that ignoring unvisited nodes is a better approach since any attempts to account for the influence of these unvisited nodes is speculative at best. Moreover, if as cognitive flexibility theory suggests [31, 16], users define their “knowledge space” as a result of their particular experiences traversing larger spaces, it seems theoretically justifiable (as well as computationally convenient) to base path visualization and metrics on the smaller path matrix.
PCp '
path absolute prestige , LAP
,
where PC refers to the converted distance matrix of the path and PMax and PMin refer, respectively, to the maximum and minimum converted distance values that the path matrix can assume for a completely-connected (PMin) and completelydisconnected (PMax) network consisting of as many nodes as
Since all subjects participating in the study were new
64
admissions to the teacher education program and had not yet participated in formal academic advising, it was unlikely they were familiar with the handbook content. Moreover, since all subjects were at the same point in their academic careers, it is highly unlikely there was any systematic variation of subjects’ familiarity with program policies and procedures across the experimental groups.
tended to show shallow hierarchical patterns of movement with the handbook table of contents serving as the root of the tree, indicating repeated visits to the table of contents during the course of the browsing session. Moreover, as indicated in Figures 5 and 6, similar navigational patterns resulted when group paths were generated by summing the individual expanded path matrices for high- and low-scoring subjects.
Following completion of the experimental sessions, subjects’ browser cookie files were retrieved and path data were extracted. Mathematica [33] routines were developed to format graph files for display by GraphViz 1.3 [11], employing a hierarchical embedding format. Mathematica routines were also used to calculate the path compactness and path stratum metrics described above. Subjects’ responses to academic advising questions were scored on the basis of information provided in the handbook across a scale of three values with 0 points awarded for incorrect and omitted responses, ½ point for partially correct and correctbut-incomplete responses, and 1 point for complete and correct responses [30, 18, 34]. Visual Analysis
The first stage of analysis validating the proposed graphical methods was based on a subset (n = 29) of the larger subject pool (n=89). In this preliminary graphical analysis subjects were grouped according to their search performance answering questions using the hypertext handbook. The “high” group consisted of subjects with the top three scores in each of four groups that had been set up to counter-balance experimental conditions. The “low” group, on the other hand, consisted of subjects with the bottom three scores in each of the four counter-balancing groups. As a result, the analysis was based on two groups of 12 subjects that differed according to their success in carrying out the hypertext search task.
Figure 3: Three path diagrams for subjects whose scores on the hypertext search task were low.
Since some link traversals in group paths probably represent idiosyncratic thinking and navigational errors, “noise” was eliminated from the summed group diagrams by
The next step in the analysis was to create and review path diagrams for the subjects in the two groups, with the intent of discerning visually distinctive patterns that might be related to success in the search task. In reviewing these path diagrams, it soon became apparent that there were, indeed, visually salient features that seemed to be related to subjects’ success in the experimental task. A number of examples of these distinctive path diagrams for individual high and low scoring subjects are presented in Figures 3 and 4. Review of the path diagrams suggested that subjects whose scores on the search task were low tended to assume a “passive” approach to locating answers in the handbook, relying much more heavily on sequential “page-turning” than those subjects who did well on the search task. The path diagrams for these low scoring subjects typically revealed distinctively linear patterns of movement. Path diagrams for high scoring subjects, on the other hand,
Figure 4. Three path diagrams for subjects whose scores on the hypertext task were high.
65
setting a threshold that had to be met in order for a traversal to be displayed. In figures 5 and 6, the threshold is set equal to 3, with the result that only those links are displayed that were traversed at least three times by the subjects in each group. While setting thresholds to other values (5,2,1, etc.) altered diagrams in minor ways (mainly by increasing the number of links displayed), alternative settings did not alter the characteristic linear and shallow hierarchical patterns associated with the low- and highscoring groups.
effective hypertext search is associated with a more passive linear path diagram that reflects users’ reliance on sequential “page-turning” with users hoping to locate desired information by simply coming across it in their browsing.
Figure 6. Group path matrix ( 3 pi ) for high ability hypertext readers for path transition frequencies $ 3.
Moreover, these graphical analyses are suggestive about what we might expect to find when we examine the association between the path metrics that have been defined and hypertext search outcome scores. Specifically, the linear character of the low scoring group suggests that path stratum will be negatively correlated with a subjects’ hypertext search score since low scoring subjects seemed more likely to adopt linear navigational paths. Conversely, since the compactness of a bidirectional star pattern (characteristic of the paths of more successful subjects) tends to approach 1 as the number of nodes increases, while both bidirectional cycles and linear patterns (characteristic of less successful subjects) approach values less than 1 [3], it appears likely that path compactness will be positively associated with users’ hypertext search scores. The research hypotheses that will be explored in the quantitative analysis that follows will therefore involve one-tailed, directional tests of significance of the following research hypotheses: 1) The path compactness metric will correlate significantly, in a positive fashion, with subjects’ hypertext search scores, and 2) The path stratum metric will correlate significantly, in an inverse fashion, with subjects’ hypertext search scores. Analysis Based on Path Metrics
The purpose of this section is to present results of analyses carried out to determine if the predictions made on the basis of the graphical analysis hold up under quantitative analysis. As noted earlier, subjects’ outcome measures are based on numbers of questions answered correctly using a hypertext student advising handbook. Pearson correlation coefficients were determined relating a number of experimental variables and hypertext search scores, including path compactness and path stratum. Results of the analyses are indicated in Table 1, with significant correlations (" < .05) flagged. Note that, of the variables examined, only path compactness and path stratum correlated significantly with the hypertext search measure.
Figure 5: Group path matrix (3 3 pi ) for low ability hypertext readers for path transition frequencies $ 3.
The graphical analysis carried out provides fairly compelling, if informal, evidence in support of distinctive navigational patterns associated with hypertext search outcome measures. More effective hypertext search is associated with a shallow hierarchical path diagram that results from subjects making repeated trips back to the main table of contents in order to make decisions about how to locate information in the electronic handbook. Less
66
Moreover, these correlations were as expected, with compactness exhibiting a significant positive correlation and stratum exhibiting a significant inverse correlation. These analyses suggest that the observed relationship is not likely to be the result of chance, and thus support the interpretation of path diagrams and the proposed metrics as reflecting empirically meaningful and potentially useful measures of hypertext navigation.
scrutiny. Although prior work has identified qualitative features similar to those noted here, informal characterizations such as “loopiness” and “spikiness” [34] can now be related to objectively assessed metrics. Another important feature of the methods proposed is that they are based on information that is immediately and unobtrusively available during reading, something that is not generally true of outcome measures. Given the demonstrated association of path information and outcome measures, it may be possible to apply real-time path data in generating user models that will lead to more effective adaptive hypertext systems. It may also be possible to apply these metrics in designing user paths to meet particular objectives or needs of users. Even in the absence of immediate applications, however, it will be important to explore these more direct measures of user movement, given the interest in, and widespread use of, less direct measures.
Correlations of Various Experimental Variables with Hypertext Search Scores r p n Print Ability .210 .137 29 Pages viewed -.006 .955 89 Order of path matrix -.011 .921 89 Path compactness .239* .012† 89 Path stratum -.205* .027† 89 * p < .05; † Indicates a one-tailed test of association. All other tests are two-tailed.
While the results of the present study are relatively clear-cut, three limitations suggest that these findings should be considered preliminary. One limitation has to do with the strength of the observed association between path metrics and search success. A second limitation has to do with the choice that has been made with regard to normalization, and a third set of related limitations is associated with the generalizability of findings, given constraints imposed by the design of the study and the experimental materials.
Table 1. Correlations (with p values and subjects) for experimental variables and the hypertext search scores.
GENERAL DISCUSSION AND LIMITATIONS
Results of the empirical validation suggest that the proposed methods and metrics can be productively applied in assessing user navigation. Moreover, the results reported suggest that navigational patterns and their associated metrics may be useful as indirect measures of user strategy and perhaps even of users’ success in cognitively “modeling” the domain represented by a hypertext. If, as cognitive flexibility theory suggests, learning in hypertext materials involves the cognitive reconstruction of a domain space through repeated traversals across that space, the paths users choose are sure to have a powerful influence on learning outcomes. In the present study, subjects who adopted shallow, hierarchical search strategies that more accurately “modeled” the organization of the hypertext materials were more successful in their search, while those who adopted more linear paths through the materials were less successful. In effect, more successful subjects recognized and took advantage of the structure of the domain space by returning to the higher ground of the table of contents and the broader cognitive view it afforded of the domain.
Although the observed association between the proposed metrics and search success is not likely to be due to chance, the strength of the association is not great. A weak association remains of significant interest, but it also suggests that this variable should be considered within a larger explanatory context. Regarding normalization, it is relevant to note that Botafogo et al. [3] recognize the general nature of the normalization problem in their work establishing structural metrics. In response to this problem, they suggest that alternative normalization procedures be considered, particularly for the stratum metric. They note, for instance, that since stratum depends on LAP, a measure that is O(n3) for matrices of order n, it may be problematic to compare networks that have large differences in numbers of nodes. Given this, the question arises whether the variation in the order of path matrices across subjects is sufficient to raise concerns about the analyses that have been carried out.
That more successful hypertext users recognize and take advantage of the structure of the materials they are using is not, in itself, very surprising. That is, after all, the purpose of graphic overviews, site maps, and other techniques that have been shown to promote more effective use of hypertext. What is important about the methods and metrics proposed is that they are not merely ad hoc constructions, but are grounded in a widely used conceptual framework, and that they hold up under both qualitative and quantitative
Two circumstances of the present study suggest, however, that the problem of normalization has not compromised the specific results reported. One circumstance is that although there was variation in the size of the path matrices used to calculate path stratum values, there was no significant correlation between subjects’ search scores and the size of their associated path matrices ( Pearson r = -.011, p = .921). Path matrices varied, but there
67
is no evidence of a systematic variation that might influence the relationship noted between the outcome measure and path stratum.
researchers a number of important benefits. One benefit is that these methods and metrics support more direct analysis of user movement in hypertext than has been possible before. A second benefit is that the concepts and computational framework these methods and metrics are based on are natural extensions of prior methods and metrics developed to analyze the structure of hypertext, and thus support a more general perspective that encompasses both structure and navigation in hypertext. Finally, there are both informal and quantitative reasons for confidence in the adequacy of these methods since the metrics that have been proposed are clearly related to the graphical displays developed and these metrics have been shown to have significant empirical association with success in a hypertext search task.
The second circumstance is related to the observation ([3], pp. 169-170) that differences in stratum values can result when index and reference nodes are excluded from the stratum calculation, the implication being that the presence of prominent nodes can distort the stratum metric. In an effort to determine whether this should be a source of concern in the present study, path stratum values were recalculated excluding index and reference nodes identified as those whose in- and out-degrees differed from their respective means by more than one standard deviation. Recalculation of path stratum values and reanalysis of the association between observed path stratum and search scores remained significant, with only a very minor deviation from prior results. As noted in Table 1, analysis across all nodes resulted in an r = -.205. Reanalysis with index and reference nodes excluded resulted in an r = -.200, suggesting that the path stratum metric had not been influenced significantly by unusual user movement across specific links.
ACKNOWLEDGMENT
This work was supported in part by an Indiana University Summer Faculty Fellowship. The author would also like to thank Mr. Michael Mancini for his assistance collecting data and four anonymous reviewers for suggestions and comments that contributed to the revision of this manuscript. REFERENCES
A limitation having to do with the design of the validation study arises because the investigation has focused on the relationship between user paths and outcome measures from a strictly correlational perspective. Had user movement been more carefully controlled so that a path “factor” could be established, a stronger inference regarding the contribution of user movement to search success might have been possible. That, however, must be addressed in future research. For the present, we must be satisfied with the observation that user movement and search success are significantly associated, without clear understanding about how and why these measures are related. Finally, it is important to note that the present investigation is limited to a test of the proposed methods and metrics utilizing a single hypertext using a specific browser interface. The findings reported are consistent with prior work [4, 34, 35] that suggests hierarchical patterns of movement benefit readers unfamiliar with the material presented but larger questions remain. It is, for instance, still unclear if the proposed methods and metrics will work equally well in other hypertext structures and under different browsing conditions. While it is apparent that the observed efficacy of navigational patterns reflects structural features of the hypertext itself, which inevitably sets conditions within which users must operate, it is not clear how specific hypertext structures influence user movement and the metrics proposed. Like the limitation related to the design of the study, this question requires further empirical work. These limitations notwithstanding, the proposed methods and metrics afford hypertext developers and
68
1.
Astleitner, H. & Leutner, D. (1996). Applying standard network analysis to hypermedia systems: Implications for learning. Journal of Educational Computing Research, 14(3), 285-303.
2.
Bartram, L., Ho, A., Dill, J., & Henigman, F. (1995). The continuous zoom: A constrained fisheye technique for viewing and navigating large information spaces. Proceedings, User Interface and Software Technology ‘95. ACM. New York, 207-215.
3.
Botafogo, R. A., Rivlin, E., & Shneiderman, B. (1992). Structural analysis of hypertexts: Identifying hierarchies and useful metrics. ACM Transactions on Information Systems, 10(2), 142-180.
4.
Canter, D., Rivers, R., & Storrs, G. (1985). Characterizing user navigation through complex data structures. Behaviour and Information Technology, 4(2), 93-102.
5.
Cardle, N. T. (1994). A hypercard on Celtic history to assess navigability measures for hypertext. MSc. Dissertation. Institute of Information Technology, University of Nottingham, UK.
6.
Chang, C. & McDaniel, E. D. (1995). Informal search strategies in loosely structured settings. Journal of Educational Computing Research, 12(1), 95-107.
7.
Chen, C. (1997). Structuralizing and visualizing the
WWW by generalised similarity analysis. In Mark Bernstein, Leslie Carr, & Kasper Østerbye (Eds.), Proceedings of the Eighth ACM Conference on Hypertext - Hypertext ‘97, 177-186. New York: ACM.
17. Lawless, K. A. & Kulikowich, J. M. (1996). Understanding hypertext navigation through cluster analysis. Journal of Educational Computing Research, 14(4), 385-399.
8.
Chen, C. & Rada, R. (1996). Interacting with hypertext: A meta-analysis of experimental studies. Human-Computer Interaction, 11, 125-156.
9.
Cockburn, A. & Jones, S. (1996). Which way now? Analysing and easing inadequacies in WWW navigation. International Journal of Human-Computer Studies, 45, 105-129.
18. McKnight, C., Dillon, A., & Richardson, J. (1990). A comparison of linear and hypertext formats in information retrieval. In R. McAleese & C. Green (Eds.), Hypertext: State of the art (pp. 10-19). Oxford: Intellect. 19. Melara, G. E. (1996). Investigating learning styles on different hypertext environments: Hierarchical-like and network-like structures. Journal of Educational Computing Research, 14(4), 313-328.
10. Eklund, J. & Zeiliger, R. (1996). Navigating the web: Possibilities and practicalities for adaptive navigational support [On-line]. Available: http://www.scu.edu/sponsored/ausweb/ausweb96/tech/ eklund1/paper.html.
20. Misanchuk, E. R. & Schwier, R. A. (1992). Representing interactive multimedia and hypermedia audit trails. Journal of Educational Multimedia and Hypermedia, 1, 355-372.
11. Ellson, J., Koutsofios, E., & North, S. (1998). GraphViz 1.3 [Computer software]. Murray hill, NJ: Lucent Technologies. Available: http://www.research.att.com/sw/tools/graphviz/.
21. Mukherjea, S., Foley, J. D., & Hudson, S. (1995). Visualizing complex hypermedia networks through multiple hierarchical views [On-line]. Available:http://www.acm.org/sigs/sigchi/sigchi95/el ectronic/documnts/papers/sm_bdy.htm.
12. Furnas, G. (1986). Generalized fisheye views, Proceedings of CHI ‘86, Human Factors in Computing Systems, Boston, April, 1986, 16-23.
22. Neves, F. D. (1997). The Aleph: A tool to spatially represent user knowledge about the WWW docuverse. In Mark Bernstein, Leslie Carr, & Kasper Østerbye (Eds.), Proceedings of the Eighth ACM Conference on Hypertext - Hypertext ‘97, 197-207. New York: ACM.
13. Gloor, P. A. (1991). Cybermap, Yet another way of navigating in hyperspace. In Proceedings of the Third ACM Conference on Hypertext, Hypertext ‘91. San Antonio, Texas, December, 1991, 107-121.
23. Nielsen, J. (1989). The matters that really matter for hypertext usability. Proceedings of the ACM conference on hypertext - Hypertext ‘89, 239-248. New York: ACM.
14. Hill, G., Hutchings, G., James, R., Loades, S., Halé, J., Hatzopulous, M. (1997). Exploiting serendipity amongst users to provide support for hypertext navigation. In Mark Bernstein, Leslie Carr, & Kasper Østerbye (Eds.), Proceedings of the Eighth ACM Conference on Hypertext - Hypertext ‘97, 212-213. New York: ACM.
24. Nielsen, J. (1990). Hypertext and hypermedia. London: Academic Press. 25. Pirolli, P., Pitkow, J., & Rao, R. (1996). Silk from a sow’s ear: Extracting usable structures from the web [On-line]. Available:http://www.acm.org/ sigchi/chi96/proceedings/papers/Pirolli2/pp2.html.
15. Husemann, H., Petersen, J., Kanty, C., Kochs, H., & Hase, P. (1997). A user adaptive navigation metaphor to connect and rate the coherence of terms and complex objects. In Mark Bernstein, Leslie Carr, & Kasper Østerbye (Eds.), Proceedings of the Eighth ACM Conference on Hypertext - Hypertext ‘97, 177-186. New York: ACM.
26. Qiu, L. (1994). Frequency distributions of hypertext path patterns: A pragmatic approach. Information Processing & management, 30(1), 131-140.
16. Jacobson, M. & Spiro, R. (1995). Hypertext learning environments, cognitive flexibility, and the transfer of complex knowledge: An empirical investigation. Journal of Educational Computing Research, 12(4), 301-333.
27. Rivlin, E., Botafogo, R., & Shneiderman, B. (1994). Navigating in hyperspace: Designing a structure-based toolbox. Communications of the ACM, 37(2), 87-96. 28. Sarker, M. & Brown, M. H. (1994). Graphical fisheye views, Communications of the ACM, 37, 12, July,
69
1994, 73-84. 29. Schroeder, E. E., & Grabowski, B. L. (1995). Patterns of exploration and learning with hypermedia. Journal of Educational Computing Research, 13(4), 313-335. 30. Smith, P. A. (1996). Towards a practical measure of hypertext usability. Interacting with Computers, 8(4), 365-381. 31. Spiro, R. & Jehng, J. (1990). Cognitive flexibility and hypertext: Theory and technology for the nonlinear and multidimensional traversal of complex subject matter. In Don Nix and Rand Spiro (Eds.), Cognition, Education, Multimedia. Hillsdale, NJ: Lawrence Erlbaum. 32. Utting, K. & Yankelovich, N. (1989). Context and orientation hypermedia networks. ACM Transactions on Office Information Systems, 7(1), 58-84. 33. Wolfram, S. (1994). Mathematica (Version 2.2) [Computer software]. New York: Addison Wesley. 34.
Leventhal, L. M., Teasley, B. M., Instone, K., Rohlman, D. S., & Farhat, J. (1993). Sleuthing in HyperHolmesTM: an evaluation of using hypertext vs. a book to answer questions. Behaviour & Information Technology, 12(3), 149-164.
35. Simpson, A. & McKnight, C. (1990). Navigation in hypertext: structural cues and mental maps. In R. McAleese and C. Green (Eds.), Hypertext: State of the art. Intellect: Oxford.
70