Markus Glatter, Jian Huang, Sean Ahern, Jamison Daniel, and. Aidong Lu. Visualizing temporal patterns in large multivariate. d t. i t t l tt t hi. Vi li ti d C.
Visualizing Temporal Patterns in Large Multivariate Data using Textual Pattern Matching Markus Glatter, Jian Huang, Sean Ahern, Jamison Daniel, and Aidong Lu
Publications • Markus Glatter, Colin Mollenhour, Jian Huang, and Jinzhu Gao. Scalable data servers for large multivariate volume visualization. Visualization and Computer Graphics, IEEE Transactions on, 12(5):1291 – 1298, Sept. – Oct. 2006. • Markus Glatter, Jian Huang, Sean Ahern, Jamison Daniel, and Aidong Lu. Visualizing temporal patterns in large multivariate d t using data i textual t t l pattern tt matching. t hi Vi Visualization li ti and dC Computer t Graphics, IEEE Transactions on, Oct. 2008.
Concept-driven Visualization • Today’s data has • more bytes y than manageable g at any y one time • more aspects than comprehensible by a human brain at one time
• More exploratory needs • High level qualitative visual guidance • “Computer aided visual summaries” ?
Concept-driven Data Reduction • An additional benefit of concept-driven visualization, if done right, is the great potential it offers for data reduction. • Data reduction that incorporates concepts is a very hard task to perform in parallel • Almost random user access • Uncertainty in user concepts during visual exploration
Overview • Implement an efficient parallel data management and selection system. • Design a regular expression framework to enable concept-driven exploration of data data. y using g a formal language g g approach, pp , we blend rigor g with • By expressiveness and flexibility in query-driven visualization. • E Enable bl scientists i ti t tto expose titime-varying i multivariate lti i t relationships l ti hi iin large data sets.
Related Work • Large data management in visualization • Data p partitioning g ((blocks, “bricks”)) • Efficient searching using tree-based data structures: • Interval tree, k-d tree quad-tree, octree, etc. • Bitmap indexing
• ((Programming) g g) languages g g in visualization: • More versatile and flexible compared to GUIs. • Alter GPU shader programs on the fly: “Scout” • VTK provides Tcl/Tk and Python bindings. bindings
Data Organization • Large data sets need to be partitioned for data distribution and loadbalancing. • Break up data set into data items containing • spatial and temporal location (x,y,z,t), • a value for each data variable variable. •
e.g. {x=1; y=2; z=3; t=10; density=2.7; extropy=.7}
• Implications • Yields increase in total data size! • Number of data items can be enormous! • But: Load-balancing can be applied on the level of data items.
Query-Driven Data Selection • Compound range queries are defined by: {∀x|lb(i) ≤ x(i) ≤ ub(i), i ∈[0, k-1]} lb ub lb, b - lower l and d upper b bound, d k - number b off attributes tt ib t
• E.g. [x:min-max][y:min-max][z:min-max] [t:7-7][density:min-2.0][entropy:.5-.9] retrieves ti allll d data t it items iin titime step t 7 with ith a d density it value l llower th than 2.0 and an entropy value between .5 and .9 .
Load-balancing • Optimal or near-optimal load-balancing desired for all possible range queries. • Heuristic: Data items with similar attribute values need to be stored on different servers. • Idea: Traverse the high high-dimensional dimensional value space in a locality localitypreserving manner and distribute data items in a round-robin fashion.
pressure
data distribution
entropy temperature
Creating Meta Data • Each data server hosts a portion of the data set as data items in a sorted list. • On top, a complete M-ary search tree of depth N 100) and thousands of time steps. • At a compression rate of 20 only 25 nodes (4GB each) can support interactive compound query on 2TB of data data.
Concept-Driven Exploration • Simple range queries are data-driven. g is concept-oriented p and incorporates p • Human domain knowledge uncertainty. • M Meta-queries t i acceptt partially ti ll d defined fi d patterns tt and d expand d th them iinto t a series of range queries. • Similar to Unix’ glob() expanding m*.pdf to actual file names.
[-.4~.4]*T[.4~max]?*
Results - Meta-queries • Data set: Global climate modeling, 71 variables from a global land surface model, monthly data over 100 years on a 256x128 grid. • Data Organization: Use relative temporal change instead of original values, over the course of one year per data item. • Query: User can query for one or more variables changing over time time, can establish “events”, and color-code spatial locations by event time.
[-.4~.4]*T[.4~max]?*
Results - Meta-queries
2050
2051
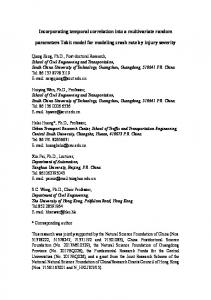
2052 “Green-Up”: p Northern Hemisphere p colored by y month of event in variable ELAI Query: ELAI:[-.4~.4]*T[.4~max]?*
Results - Meta-queries
2050
2051
2052 “First Snow”: Northern Hemisphere p colored by y month of event in variable FSNO Query: FSNO:???[min~.07]*T[.07~max]?*
Comparison with Traditional Visualization Techniques
“Green-Up” in 2050 Northern Hemisphere colored by p y month of event in variable ELAI: [-0.4-.4]*T[.4-max]?*
Complexity of Meta Queries • Many cases could lead to exponential problem spaces • Fortunately, the data access patterns are not random (except in rare cases)
Acknowledgements •
•
This work was supported by and used resources of The University of Tennessee, the National Center for Computational Science (NCCS) at Oak Rid Ridge N ti National l Laboratory L b t (ORNL) and (ORNL), d the th Office Offi off Science S i off the th U.S. US Department of Energy, Contract No. DE-AC05-00OR22725. Climate data provided by John Drake, David Erickson, and Forrest Hoffman, from the Carbon-Land Model Intercomparison Project (C-LAMP), partially sponsored by DOE SciDAC and the Climate Change Research Division of the Office of Biological and Environmental Research.