results of the Web search engines are generally shown as multiple ... based on keywords, we also support image search. Vi- ... tionâ and âsoftwareâ respectively.
Visualizing
the Results
of Multimedia
Web Search Engines
Sougata Mukherjea, Kyoji Hirata and Yoshinori C&C Research Labs, NEC USA Inc. E-mails: {sougata,hirata,hara}Qccrl.sj.nec.com
Abstract
The image search facility allows the user to search for images from an internal database in our server that are similar to an user-specified image. For image search we use the content-oriented image retrieval (COIR) Th e chosen image is matched with the library [l]. database images based on their colors and shapes. Each database image is given a match rate which is a combination of its shape and its color match rate. Images with a high total match rate are retrieved and the user can start a search by selecting one of these images.
Search engines are very useful because they allow the user to retrieve documents of interest from the WorldWide Web. However, if the user’s query results in lots of records to be retrieved, just listing the results is not very user-friendly. We are developing a system that allows the visualization of the results. Visualizations of both text and image search are generated on the j?y based on the search results.
1
Introduction 3
With the explosive growth of information that is available through the World-Wide Web, it is becoming increasingly difficult for the users to find the information of interest. Therefore, various searching mechanisms that allow the user to retrieve documents of interest are becoming very popular and useful. However, the results of the Web search engines are generally shown as multiple windows of scrolled lists. Scrolling through these lists to find the really useful information is very A better method of displaying the search tedious. results is needed. We have been developing a system that allows the visualization of the results of Web searches. The visualizations are generated on the fly using Virtual Reality Modeling Language (VRML). Instead of just allowing the searching of Web documents based on keywords, we also support image search. Visualizations of the results of the image search are also possible.
2
Hara
Search
Visualization
After the image or the text search the user has the option of visualizing the results. For visualization, VRML code is generated which can be displayed on any VRML browser (like SGI’s Webspace Navigator and Microsoft’s Internet Explorer). In the visualizations we bind visual attributes to information attributes to allow the important information about the retrieved records to be represented visually. The user can change the default bindings using a forms interface. Two kinds of visualizations are provided. 3.1
Tabular
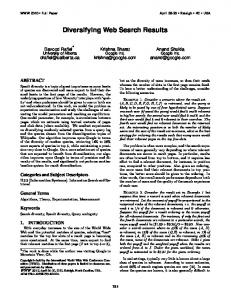
Figure 1 shows a bird’s eye view of a tabular visualization of the search results for the keywords “visualization”, “information” and “software”. In this visualization, cubes represent the documents and their colors represent the domains. The cubes are placed from left to right and front to back based on the document’s total number of keyword matches. The width, height, and depth of the cubes are mapped to the frequency of the keywords “visualization”, “information” and “software” respectively. The visualization shows that most of the cubes have small widths. Thus, it is obvious that most documents that are retrieved don’t have anything to do with “visualization” (since width is mapped to the frequency of that keyword).
Engines
For text search we use the publicly available Aliweb index [2] which allows the user to find Web documents based on keywords. Like other popular Web search engines, the results are displayed as a scrolled list. Obviously, looking at all the retrieved documents in this manner is not very user-friendly.
FORCOLORPLATE SEE PAGEBOY 64 0-8186-7668-X/96
$5.00 0 1996 IEEE
Proceedings of the 1996 IEEE Symposium on Information Visualization (INFOVIS '96) 0-8186-7668-X/96 $10.00 © 1996 IEEE
Visualization
Figure 1: A bird’s eye view of a tabular visualization of the results of a text search. Cubes representing retrieved documents are placed from left to right and front to back based on their total number of keyword matches. The width, height and depth of the cubes are matched to the frequency of individual keywords.
Figure 2: The lhs shows a scatter plot visualization different match rates. The rhs view shows zooming
of the results of an image search. The 3 axes are mapped in on images with the maximum shape similarity.
4
If the user is actually interested in information and software visualization, she should look for documents with width and either height or depth. The user can navigate through the 3D space to look for the interesting documents. Zooming in to parts of the space is also allowed. 3.2
Scatter
Conclusion
We have described one of the first systems that tries to visualize the results of the Web search engines. Future work is planned along various directions. Firstly, we need to improve the visualizations based on usability studies. To allow user interaction and animation we plan to use VRML 2.0. To visualize a larger number of records and to handle network delays, we also need to improve the efficiency of the code. (At present, to visualize 500 records it took about 2 seconds on a SGI Indigo2 and 5 seconds on a PC with a 133 MHz Pentium processor.) We believe that effective visualizations of the search results would increase the usefulness of Web search engines.
plot Visualization
The left hand side of Figure 2 shows a scatter plot visualization of an image search result. In this visualization, the shape match rate has been mapped to the X axis, color match rate to the Y axis and total match rate to the 2 axis. Thus, the shape and color match rate of any image is understandable from the visualization. For example, images on the upper right of the screen (with high values of both z and y) represents the most similar images. Colors represent the image type. Different categories of clip arts are mapped to different colors. Various viewpoints are provided to allow the user to zoom in on different important positions in the space. For example, the right hand side of Figure 2 shows zooming in on images with the maximum shape similarity. Note that since showing all the images together is very slow, the actual image is shown only if the user comes close to the cube. Also note that clicking on a cube initiates a search with the image that cube represents.
References
PI K.
Hirata, Y. Hara, N. Shibata, and F. Hirabayashi. Media-based Navigation for Hypermedia Systems. In Proceedings of Hypeded ‘93 Conference, Seattle, WA, November 1993.
[2] M. Koster. ALIWEB - Archie-like Indexing in the Web. In Proceedings of the First International World- Wide Web Conference, Geneva, Switzerland, May 1994.
65
Proceedings of the 1996 IEEE Symposium on Information Visualization (INFOVIS '96) 0-8186-7668-X/96 $10.00 © 1996 IEEE
to