aspectj. 6. Gregor Kiczales, Erik Hilsdale, Jim Hugunin, Mik. Kersten, Jeffrey Palm, and William G. Griswold. An overview of AspectJ. Lecture Notes in Computer.
VizScript: Visualizing Complex Interactions in Multi-Agent Systems ∗
Jing Jin, Rajiv T. Maheswaran, Romeo Sanchez and Pedro Szekely Information Sciences Institute, University of Southern California 4676 Admiralty Way Suite 1001, Marina del Rey, CA 90292 +1-310-822-1511 {jing,maheswar,rsanchez,pszekely}@isi.edu
ABSTRACT
We address the problem of users creating visualizations to debug and understand multi-agent systems. The key challenges are that (1) needs arise dynamically, i.e., it is difficult to know a priori what visualizations one wants, (2) extensive expertise on the system, the algorithms and visualization tools are often needed for implementation, and (3) agents can be running in a distributed environment. We have developed VizScript, a collection of tools to expedite the process of creating visualizations. VizScript combines a generic application instrumentation, a knowledge base, and simple scene definition primitives with a reasoning system, to produce an easy to use visualization system. Using VizScript we were able to recreate the visualizations for a complex multi-agent system with an order-of-magnitude less effort than was required in a Java implementation. ACM Classification:
H5.2 [Information interfaces and
presentation]: Algorithms, Measurement, Performance, Design, Languages General terms:
Keywords: Software Visualization, Scripting Languages, Multi-Agent Systems, Rule-Based Systems INTRODUCTION
Understanding the behavior of complex software is challenging. Understanding the behavior of multi-agent systems is even more challenging given the additional timing and information sharing issues involved. We focus ∗ The
work presented here is funded by the DARPA COORDINATORS Program under contract FA8750-05-C-0032. The U.S.Government is authorized to reproduce and distribute reports for Governmental purposes notwithstanding any copyright annotation thereon. The views and conclusions contained herein are those of the authors and should not be interpreted as necessarily representing the official policies or endorsements, either expressed or implied, of any of the above organizations or any person connected with them. Permission to make digital or hard copies of all or part of this work for personal or classroom use is granted without fee provided that copies are not made or distributed for profit or commercial advantage and that copies bear this notice and the full citation on the first page. To copy otherwise, to republish, to post on servers or to redistribute to lists, requires prior specific permission and/or a fee. IUI’07, January 28–31, 2007, Honolulu, Hawaii, USA.. Copyright 2007 ACM 1-59593-481-2/07/0001 ...$5.00.
on building visualizations of multi-agent systems to help users understand the behavior and interactions among agents. While there are many tools to build visualizations of software [1, 8], visualizations still require significant effort to build. Visualization authors need to be familiar with the visualized software because they must instrument it to trigger visualization routines. They must also be familiar with the underlying graphics package in order to define the appropriate visualization. Our approach, embodied in a tool called VizScript, is to enable visualization authors to specify visualizations using rules of the form: when { }
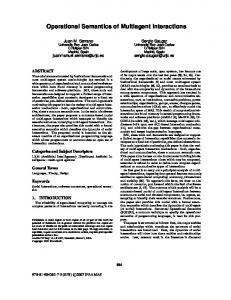
VizScript lowers the cost of creating visualizations by separating instrumentation and visualization so that authors don’t need to understand the underlying software in order to write the patterns that detect the interesting events to be visualized. In our approach, instrumented software produces a stream of records of the form (a, o, t, p, v). Such records announce that on time instant t, agent a knows that property p on object o has value v. Authors only need to understand the classes of objects in the application, their properties and values that properties can have. Software developers instrument the software to produce such a stream of records. This requires intimate knowledge of the software, which developers have, but does not require any knowledge of the visualization library. Instrumenting software is similar to adding print statements for debugging. Figure 1 shows two examples of the types of visualizations that VizScript can easily generate: graphs to show the evolution of numeric variables, and charts that show the evolution of nominal variables. Furthermore, VizScript supports the ability to play the visualizations back and forward in time to enable users to observe the state of the system at any time point. In order to make visualizations easy to write, it must be easy for authors to specify the patterns that detect interesting events in a stream of records that announce changes to individual object properties. We do this
by using a knowledge base that builds the objects one record at a time, and a production-system architecture that enables authors to define patterns to identify highlevel events as records are being added into the knowledge base. In addition, VizScript automates much of the bookkeeping involved in driving the graphics package (the details of this aspect of the system are beyond the scope of this short paper). In the next section, we present the high-level architecture of VizScript, and describe the details of our reasoning system. Later, we present an evaluation of the system by comparing the effort to build visualizations with and without the system, and end with related work, conclusions and directions for future work.
PER-AGENT LOG FILE
VizScript CONSOLIDATE LOGS
PER-AGENT LOG FILE CONSOLIDATED LOG
BUILD KNOWLEDGE BASE VizScript Script
KNOWLEDGE BASE
VizScript Script PATTERN MATCHER
VISUALIZATION COMMANDS (JOURNAL)
ARCHITECTURE OVERVIEW
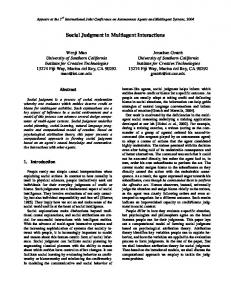
Figure 2 shows the architecture of the VizScript. The dotted line represents the VizScript interpreter. VizScript takes as input a collection of data streams and a collection of scripts that define the visualizations that the user wants to see. The data streams, one per agent, contain records that describe changes to the state of the agents. When VizScript is used in on-line mode, the streams are consumed as they are being produced by the agents. In off-line mode the streams are saved in files and loaded on demand. The VizScript output is a sequence of visualization commands that are fed to a graphics library to drive the display. The VizScript interpreter is independent of the graphics library, and could be used with different graphics packages. The scripts do depend on the graphics library as they explicitly invoke commands in it. The VizScript interpreter contains several components. The first component consolidates the data streams produced by multiple agents by using markers on the data
Figure 2: Components of the script interpreter.
stream to compensate for possible clock skew on records produced by different agents. The next component builds the knowledge base one record at a time, inserting relevant records into the knowledge-base and feeding them to the scripts. Scripts are defined using rules. The condition part of a rule is defined using a pattern that is matched against the contents of the knowledge-base. The actions are commands to the graphics library. VizScript LANGUAGE
VizScript is an interpreted language with an integrated knowledge base and pattern matcher. VizScript statements manipulate scalars and associative arrays using standard assignment, arithmetic, conditional and function call expressions found in many scripting languages. Functions are provided to invoke commands in the graphics library and to update the knowledge base. The interpreted language is similar to other scripting languages such as JavaScript [3]. The pattern matcher is similar to the pattern matcher in OPS5 [4]. A VizScript script consists of rules of the form: when Pattern where BooleanExpression{ Statement+ }
Patterns specify events of interest. A pattern is a Boolean combination of primitive patterns. VizScript supports conjunction, disjunction and negation. Primitive patterns are of the form (object property value). The object and value elements can be variables of the form ?x, or expressions, which evaluate to a scalar or an object in the knowledge base. The property is an expression, which when evaluated yields the name of a property in the knowledge base. Properties define relations between objects and values, providing the basis for the deductive mechanisms of VizScript. For example, the following are primitive patterns: Figure 1: Two visualizations created using VizScript.
("task1" "probability" ?p) (?x "probability" ?p)
The optional where clause of the when statement allows definition of additional constraints that cannot be expressed through unification of pattern variables (e.g., inequality of two variables), and it needs to be satisfied by the different variable bindings of the pattern. A binding is an assignment of values to the variables in a pattern that make the pattern true. A pattern can have multiple bindings when multiple assignments of variables satisfy the pattern. VizScript computes all bindings when it evaluates patterns against the knowledge base, and then executes the body of the when statement once for each possible set of variable bindings. In the example, the first pattern will have a single binding that binds ?p to the "probability" of the object "task1". The second pattern will typically produce multiple bindings consisting of pairs of objects and probabilities. There will be one pair for each object with a defined "probability" property. 1 VizScript processes the consolidated input stream one record at a time. For each record it first adds the record to the knowledge base, and then it evaluates the when statements with primitive patterns that refer to the property just added to the knowledge base. It binds variables in those primitive patterns to the object and value of the record just added. For example, suppose that the following record is added to the knowledge base: ("agent1" 0 "task1" "probability" 0.3)
Consider the following when statements: when when when when
(?x "probability" ?p) { ... } (?x "importance" ?i) { ... } ("task2" "probability" ?p) { ... } (?x "probability" 0) { ... }
VizScript would evaluate the first when statement because it contains the property "probability". It would bind ?x to "task1" and ?p to 0.3. It would not evaluate the second statement because it does not mention "probability". It would not evaluate the third statement because even though it mentions "probability", it requires the object to be "task2". It would not evaluate the fourth statement because that statement requires "probability" equal to zero. After binding pattern variables based on the record just added to the knowledge base, VizScript computes bindings for any variables that are still unbound in the pattern by matching against the full contents of the knowledge base. As mentioned before, the bindings must also satisfy the BooleanExpression in the where clause of the when statement, if it has been defined, to finally execute the body of the rule. 1 VizScript has also support to represent multi-valued properties, in which each property relation could lead to multiple values for the same object.
To query the knowledge base by the pattern matcher, VizScript introduces a let statement. Unlike the when statement, the bindings it produces are not required to contain the record just added. The following example illustrates the use of the let statement in one of our visualizations. The visualization is a Gantt chart specified as a table of color chips with a row for each agent and a column for each simulation pulse, which can be seen in the second example of Figure 1. The table cells show the priority of the activities being executed. when ("clock" "starfieldPulse" ?pulse) { let (?activity "type" "Primitive") && (?activity "executionStatus" "qualityChanging") && (?activity "executingPriority" ?p) { addCell(?activity."ownerAgent", ?pulse, color[?p]); } }
The when statement is triggered when the simulation clock advances. The let statement fetches all "Primitive" activities with status "qualityChanging", binding ?p to the execution priority. The action paints the corresponding cells with a color denoting the priority. EVALUATION
We developed VizScript because we need powerful, easy to use visualizations tools to help us understand, debug and develop a large multi-agent application. The visualizations are used by many team members every day. Our evaluation is based on our experience re-implementing our visualizations using VizScript. Because we rely on our visualizations to make progress on our multi-agent system, the VizScript visualizations must be at least as good as our previous, custom Java implementations: Capability: the new visualizations are either equivalent or more detailed than the old ones. Instrumentation cost: negligible in both implementations. Off-line mode: supported in VizScript, but not in the old implementation. Rendering: the VizScript visualizations often take three times longer to render than the custom Java implementations (e.g., about 30 seconds instead of 10 seconds for a medium size 10 agent scenario). Even though the rendering costs are higher, the off-line mode supports a concept of operation that compensates for the slower performance. Without off-line support we had to run simulations interactively in order to visualize them. We had to wait for both the simulation and the visualization to run. With off-line support we can run many simulations in batch mode and select the most interesting ones to visualize. We don’t have to wait for the simulations to run, which often takes significantly longer than the time to visualize the results. We have not ran user studies yet, so we cannot yet prove that VizScript is easy to use. However, preliminary ex-
Visualization Quality View Subjective View Agent View Probability View Execution View
Lines of Code Original VizScript 122 5 141 21 190 47 258 23 1214 93
Savings Factor 24.40 6.71 4.04 11.22 13.05
Table 1: Effective Lines of Code for Visualizations
perience with VizScript is very encouraging. We measured the lines of code required to implement five different visualizations using the old custom Java approach and the new VizScript approach. Table 1 shows that VizScript enables approximately an order-of-magnitude reduction in the number of lines necessary to create these visualizations. Three additional points are worth noting. First, a useful visualization can be specified in about one page of VizScript code; second, two of the four visualizations were not re-implemented by the developers of the original custom-Java visualizations; and third, VizScript proved to be practical for data streams containing over one million data records.
RELATED WORK
Demetrescu, Finocchi and Stasko [2] proposed two ways to bind visualizations to the actual software objects. Our approach is similar to their Interesting Event method, but we provide a reasoning system between the software and the visualization scheme, which simplifies instrumentation also making the approach more generic. Khaled, Noble and Biddle [5] presented a system called InspectJ, which is a program visualization system that uses AspectJ [6] to automatically collect program monitoring information for visualization. However, the main disadvantages of this approach is that it needs the program execution to feed the visualization system, precluding its use in off-line analysis. Tominski and Schumann [9] argued that today’s visualization techniques often do not distinguish between the different properties of the data, thus visualizing all aspects of it. They proposed an approach similar to VizScript in which users specify those aspects of the data that will be monitored, and use events once a particular pattern is detected to draw the visualizations. They use XML to define event templates, mapping them later to SQL queries. Our approach is more flexible, since the VizScript scripting language and knowledge base can be seen as a deductive system making inferences on the data set with respect to time, producing composite and aggregated data visualizations. Poutakidis, Padgham and Winikoff [7] argued that although existing debuggers provide essential infrastructure, they cannot effectively filter the information presented to the programmer. Our approach turns out to be a good solution to this problem, since users can easily focus on any aspect of the system at any particular point in time.
CONCLUSIONS
We address the problem of generating dynamic visualizations for large and complex distributed systems. We developed VizScript, an efficient and flexible collection of tools, which expedites the process of building visualizations for complex multi-agent systems. By combining a generic instrumentation, a knowledge base, and language primitives with a reasoning system, VizScript is able to greatly reduce the time and effort required to produce useful visualizations. We showed that the number of lines of code needed to create visualizations using VizScript represents approximately an order-ofmagnitude reduction in effort. VizScript is a promising and effective approach to creating dynamic visualizations for complex, large distributed systems. Ongoing work focuses on further scale-up to data streams with several million records and on patterns to support temporal reasoning. REFERENCES
1. Sarita Bassil and Rudolf Keller. Software visualization tools: Survey and analysis. In 9th. International Workshop on Program Comprehension (IWPC’01), pages 7–17, 2001. 2. Camil Demetrescu, Irene Finocchi, and John T. Stasko. Specifying algorithm visualizations: Interesting events or state mapping? In Revised Lectures on Software Visualization, International Seminar, pages 16–30, London, UK, 2002. Springer-Verlag. 3. David Flanagan. JavaScript: The Definitive Guide. O’Reilly Media, 5 edition edition, August 2006. 4. Charles Forgy. Rete: A fast algorithm for the many pattern/many object pattern match problem. Artificial Intelligence, 19:17–37, 1982. 5. Rilla Khaled, James Noble, and Robert Biddle. Inspect j: Program monitoring for visualisation using aspectj. 6. Gregor Kiczales, Erik Hilsdale, Jim Hugunin, Mik Kersten, Jeffrey Palm, and William G. Griswold. An overview of AspectJ. Lecture Notes in Computer Science, 2072:327–355, 2001. 7. David Poutakidis, Lin Padgham, and Michael Winikoff. Debugging multi-agent systems using design artifacts: the case of interaction protocols. In AAMAS ’02: Proceedings of the first international joint conference on Autonomous agents and multiagent systems, pages 960–967, New York, NY, USA, 2002. ACM Press. 8. John T. Stasko. Tango: A framework and system for algorithm animation. Computer, 23(9):27–39, 1990. 9. Christian Tominski and Heidrun Schumann. An event-based approach to visualization. In IV ’04: Proceedings of the Information Visualisation, Eighth International Conference on (IV’04), pages 101–107, Washington, DC, USA, 2004.