Volume Interaction Techniques in the Virtual Simulation of Radiotherapy Treatment Planning Wenli Cai, Grigorios Karangelis, and Georgios Sakas Fraunhofer Institute for Computer Graphics Rundeturmstrasse 6, D-64283 Darmstadt Germany
Abstract Patient
The simulation of Radiotherapy Treatment Planning (RTP) is a normal procedure in oncology clinics carried out on the Simulator. The Virtual Simulation of RTP replaces the real Simulator with a virtual one, and uses the 3D CT data set of a patient, including the external patient’s skin landmarks, instead of a real patient body. In this paper, we present a VS, named EXOMIO, which is based on volume rendering techniques, including DRR, MIP, gradient surface, and iso-surface, to simulate not only the real Simulator motion and display, but supply the physicians with different visualisation tools to observe the relationship between tumour site and its surroundings. Besides the commonly used interaction techniques, some volume interaction techniques on volume rendering images are introduced in detail: a novel interactive landmarks registration method, the display of beam projection on patient skin, interactive delineation, and interactive field setting on DRR image. As a result, interaction based on volume rendering images supplies a more realistic and accurate working environment for Virtual Simulation. Keywords: Volume Visualization, Volume Rendering,
Simulator
Current RTP System
Physician
Physicist
Treatment Machine
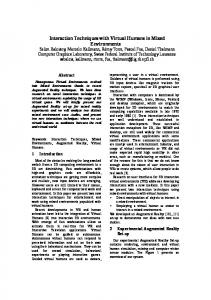
Figure 1: Simulator and RTP System Interaction, Radiotherapy
1. INTRODUCTION Radiotherapy Treatment Planning (RTP) is a procedure to plan the irradiation treatment which is usually simulated on a conventional Simulator before apply it on the patient. Its goal is to deliver the adequate irradiation dose to a tumour site without causing sever damage to surrounding normal, healthy tissues. Usually, first the physicians locate the tumour position and its relationship to surrounding tissues with CT slices and X-ray films shot from Simulator. Then, physicists calculate the RTP parameters and dose distribution, see Figure 1. In fact all current RTP systems are designed for the physicist, not the physician. The advances in computer graphics, especially in scientific visualisation, have stimulated the development of Virtual
Interactive Window & Control Panel Virtual Simulator BEV’s DRR
CT Slices OEV’s Navigator Figure 2: User Interface of EXOMIO
International Conference Graphicon 1999, Moscow, Russia, http://www.graphicon.ru/
Simulator (VS) systems (software), which is a new generation of RTP systems and physician oriented. VS systems assist physicians to detect the tumour site from different viewpoints, to design irradiation beam shape and orientation, to evaluate the treatment, to calculate the dose distribution around tumour, finally to make an effective and accurate plan. Such new generation RTP systems involve high-end visualisation and computational abilities. Except a small number of dedicated Virtual Simulator (VS) systems, such as AcQsim[PICK], Advantage Sim[GE], Pro-Sim[Prowess], and PLATO VSS[Nucletron], some RTP systems are now available in commercial market, including VS functionality [HaPu97]. The major weaknesses or deficiencies of current RTP systems come from their rendering methods, since most of them use surface rendering rather than volume rendering. All target objects (tumours) and other critical organs are required to be modelled with interactive contouring slice by slice. As it is mentioned in [MePu94], this process is the most time consuming step in RTP. Due to this heavy modelling work, usually only a few slices (ca 10-20 slices, compared to a bigger number, at least 50, scanned by the CT) of each patient are involved in RTP. Only the modelled objects are displayed. However, this limitation is critical for a successful RTP, especially the accuracy of the rendering images. The sizes of the segmentation objects are not accurate and some of small but critical organs sometimes may be neglected. Their quality is much worse than the images produced by the Simulator, especially the lack of high quality X-ray images which physicians are familiar to work with during RTP. The VS can simulate all the motions of the physical Simulator and display the digital reconstructed radiograph (DRR) which is usually observed on the Simulator screen (X-ray image). Physicians can work in the virtual environment as they work on the real machine since the virtual working environment is compatible to their working style on the real Simulator. Physicians interactively work with the high quality DRR images, to define the irradiation beam and blocks, to control the Simulator, to find the appropriate gantry position, to investigate the tumour and other tissues. Another benefit is that all of the planning procedures are performed without the presence of the patient. In one word, the VS will supply the physicians with more functions than the real Simulator so as to produce an effective and efficient irradiation therapy plan. In this paper, we present a Virtual Simulator, called EXOMIO, developed under the co-operation of Fraunhofer Institute for Computer Graphics and Städtische Kliniken Offenbach. In the next sections, the system architecture and some key interaction techniques during implementation are discussed in details, especially the interaction in volume rendering images.
2. SYSTEM OVERVIEW EXOMIO is designed according to the international standard for Radiotherapy Equipment (CEI IEC 1217). All movements of the virtual machine are in consistent with the real Simulator. In VS, instead of the physical patient’s body, a virtual patient’s body is reconstructed and rendered from the patient’s CT data, in DICOM 3 format. A X-ray image in beam's eye view (BEV) and a surface image in observer's eye view (OEV) are both rendered. Accordingly, two windows, BEV window and OEV window, are designed in EXOMIO, see Figure 2. In addition, CT slice window display the anatomy information in detail and a simulator machine window shows the machine’s motion in general. The basic working procedure of RTP in EXOMIO is, 1.
Digitalise patient (including landmarks) by the spiral CT.
2.
Transfer patient’s CT data to the VS via DICOM server.
3.
Register patient in the VS using landmarks.
4.
Delineate clinical target volume (CTV) on the CT slices.
5.
Design the beam shape and orientation in BEV and OEV windows.
6.
Transfer the treatment plan from the VS to the treatment machine, and move patient to the treatment room.
7.
Carry out the planned treatment.
In the above procedure, step 1-2 are finished in CT room, step 3-7 are done in VS. The final step is performed in the irradiation treatment room. In the RTP procedure there are several coordinate systems to localise patient in the world coordinate system (in different rooms), which are the CT machine, the Simulator, and the Irradiation treatment coordinate system. Three coordinate systems must be consistent with each other in order to ensure the correctness of treatment parameters. This consistence is implemented physically by the laser systems installed in all machine rooms and the landmarks attached on the patient’s skin. In each room, three laser beams are installed to form the three coordinate axes, which is called "fixed coordinate system" (see CEI IEC 1217). All motions of the Simulator and the irradiation machine are defined based on the fixed coordinate system At the first step of the RTP procedure, the projection of the laser beams on the patient body are drawn using a marker on the patient’s skin. Then, among the next steps, such as the CT scan, the planning verification, and the irradiation treatment, the laser coordinates in each machine room are required to meet these landmarks on the patient’s skin so as
International Conference Graphicon 1999, Moscow, Russia, http://www.graphicon.ru/
to recover the patient initial position. The consistence of the coordinate systems is the basic requirement for a correct treatment planning. The VS simulates the working environment of the real Simulator using the following functionality: Two rendering views: “beam’s eye view” (BEV) and “observer’s eye view” (OEV). Volume rendering for Digital Reconstructed Radiography (DRR) and Maximum Intensity Projection (MIP) images, surface reconstruction. Patient skin marks registration on the CT slices or on the surface reconstructed model of the patient in the OEV window. Interactive beam projection display on the patient skin. Clinical target volume (CTV) delineation by manually contouring on key slices and by interpolating the intermediate positions. 2D margin extension of the CTV on the BEV window or 3D margin extension of the CTV to create the planning target volume (PTV) Irradiation Field setting on the DRR image, automatic setting of the iso-centre to a given Source to Skin Distance (SSD), bary-centre or iso-centric. Automatic & dynamic beam adaptation (collimating) at the PTV size, mirroring of beam positions and also mirroring of blocks shape. Manually block design on the DRR, automatic block adaptation between PTV and collimator. Display of the PTV, beam, blocks, iso-centre, and reference point in the slices window in different CT scan directions, i.e. transaxial, coronal and sagittal. Rendering of the volume within the irradiation beam. Oblique cut through the volume. Hardcopy printout including planning parameters. EXOMIO is developed based on InViVo library [Saka93] , which is composed of 6 modules: System basic modules, I/O module, Rendering module, Contouring module, Simulator module, and ObliqueCut module. The rendering context in EXOMIO is, more than one volume data set in one application two different rendering parameter sets (BEV: perspective projection and OEV: parallel projection) to each data volume.
EXOMIO supports two kinds of volume illumination methods: DRR images [Cai99] and maximum intensity projection (MIP) [SaGS95], and two kinds of surface illumination methods: gradient surface and iso-surface [Levo88]. All images in EXOMIO are rendered by different volume rendering algorithms. DRR with which physicians are familiar to is required. In contrast to X-ray, the MIP projection, physically impossible on a real Simulator, makes it easier for the physician to distinguish between soft and hard tissues (e.g. bones). In addition, two geometrical objects, "Volume in beam" and "whole volume", can be rendered to compare the tissue within and outside of the beam. Volume in beam is calculated by the intersection of volume cube and beam pyramid. Different illumination methods can be combined together to distinguish different objects in rendering. In Figure 3, the volume in beam is rendered by MIP and the delineated target volume is rendered by gradient surface. Two images are mixed to display the relationship between these two body areas. The system is implemented in Sun and IRIS workstation under UNIX environment, including ANSI C, XWindow, and OpenGL graphics library. Two rendering quality modes are supplied: preview mode and high quality mode. Basically, the rendering speed is below 1 second per frame in preview mode and about 2 seconds per frame in high quality mode (in SUN Ultra60 workstation), respectively. This rendering speed is fast enough to support all the interactions presented in the next sections in real time.
3. INTERACTIVE REGISTRATION
LANDMARKS
As previously mentioned, patient’s position must be identical in the different world coordinators, i.e. in the CT room, the Simulator room, and in the treatment machine room. In VS, this registration is finished by placing landmarks on the patient’s skin. During the CT scan, the projection of the laser beams in the CT room are marked by aluminium on patient’s skin. After scanning, these aluminium marks are visible on the CT slices, see three white points on patient body in Figure 4, which are indicated by three circles. These landmarks define the of irradiation iso-centre. Before treatment planning, patient must be registered at the location of these three landmarks. All the treatment parameters of the VS are defined based on the registered iso-centre position calculated from the three landmarks. The interactive landmarks registration is based on the OEV rendering image. The three landmarks can be visualised in OEV window using gradient surface volume rendering, see Figure 5(a). During volume rendering, a corresponding Zbuffer is generated to record the first visible voxel along the viewing direction. Thus, it is possible to detect the rendered object position in the rendering image.
International Conference Graphicon 1999, Moscow, Russia, http://www.graphicon.ru/
Figure 3: Volume in Beam and Target Volume
Figure 4: Trans-axial slice containing landmarks (which are indicated in the circle)
(a) Skin marks (OEV)
(b) Iso-centre in axial slice
Different viewing direction and data scaling can be adjusted in order to find a “good” viewing direction to render the landmarks clearly, i.e. through interaction to find a clear rendering of landmarks. In the rendering image, landmarks are selected by lying the centre of red cross on the centre of mark, see Figure 5(a). The corresponding position in CT slice is displayed by a red box in slice window, see Figure 5(b). After fixation of the three marks, i.e. Left Mark, Middle Mark and Right Mark, the iso-centre is calculated by evaluating the cross point of three marks. In detail, it is Calculating the coronal plane of iso-centre by averaging the coronal planes of Right Mask and Left Mask. Calculating the iso-centre by intersecting the line through the Middle Mask and the calculated coronal plane. After calculating the iso-centre coordinates, the volume data is moved to the iso-centre as the original point and all gantry parameters are initiated. In Figure 5(c), a gradient surface image in the BEV is rendered to evaluate the patient position after registration. The middle landmark is
(c) BEV after register Figure 5: Marks and patient registration located at the centre of the collimator. The movement is calculated in Eq. 1. MovementX = (IsoCentreX - ResolutionU / 2.0 ) /ResolutionU MovementY = (IsoCentreY - ResolutionV / 2.0 ) /ResolutionV MovementZ = (IsoCentreZ - ResolutionW / 2.0 ) /ResolutionW
International Conference Graphicon 1999, Moscow, Russia, http://www.graphicon.ru/
Eq. 1
In the interactive iso-centre setting, the most important technique is to transform the image point to data point, i.e. to find the coordinates of the red cross point in Figure 5(a) in volume data space. Since gradient surface is represented by opacity calculated from gradient, an aliased surface will be detected around the noise points due to the relative large gradient around them, if we only consider the first visible voxel along the ray as the Z-buffered voxel. In order to prevent from the noise effects, an window Z-buffer value detection is used instead of point sampling in Z-buffer, such as 3×3 window. In this case, it is more accurate to sample the mask in a window while the rendered mask plane is perpendicular to the view direction.
4. BEAM BODY
PROJECTION
ON
PATIENT
Beam projection on patient body is to show the beam projection area on the patient skin, i.e. displaying the beam projection on the patient skin in the OEV window. Physicians can detect the beam size and position on the patient body by directly investigating the beam projection on the skin, which makes the navigation more realistic like in the Simulator room. Considering that the beam is originated from the irradiation source, the projection area of the beam on the patient skin is the area which is illuminated by the beam. That is to say, the beam projection area is the intersection of the beam volume and the patient skin surface, see Figure 6. Beam Source Patient Skin
Beam Screen Beam Projection Area
Figure 6: Beam Projection Area Because there is no geometry model in the system, all the images are rendered by volume rendering methods. One solution is to render two images: “volume in beam” and “whole volume”, then mix them by overlapping the “volume in beam” on the “whole volume”. But this is a very time consuming method, since it needs two times of volume rendering. Another method, which will be described in the following, is to use Z-buffer and Shadow buffer to detect the objects in beam. Considering the irradiation source is a light source, the beam projection area is the surfaces in the OEV rendering, which are visible in the view of beam. If we create a Zbuffer in the OEV rendering and a Shadow buffer in the beam view, the projection area is the pixels in the Z-buffer which are visible in the Shadow buffer too.
Similar to the method in section 3, a Z-buffer is created during skin gradient surface rendering in the OEV window, which keeps the first visible voxel along the viewing direction. Then, a shadow buffer is created of size of the BEV window and set the buffer by the collimator and blocks. If the pixel is outside the collimator or covered by blocks, then its Shadow buffer is set to inaccessible. After evaluating the transformation matrix of the BEV (perspective projection), we project each voxel in the Zbuffer to the beam Shadow buffer. If the corresponding pixel in Shadow buffer is inaccessible, the voxel in Zbuffer is outside the beam projection. The visibility of each voxel is determined by the stored beam depth in Shadow buffer. The beam depth is the distance from the irradiation source to the projected voxel. If the beam depth of current voxel is larger than the reserved value in the Shadow buffer, current voxel is hidden by the voxel in the Shadow buffer along the beam direction. Otherwise, current voxel is located before the voxel in the Shadow buffer. Finally, the Shadow buffer keeps all the voxels which are visible along the BEV. And the corresponding pixels of the visible voxels in the Shadow buffer are lightened in the OEV window to distinguish it from other non-irradiated voxels. The basic algorithm suffers from the aliasing due to the following fact: Voxel has a size in space: one voxel maybe hit by several rays in OEV. When it is projected to the beam buffer, its projection covers the same pixel in the Shadow buffer. But finally, only one value is kept in the Shadow buffer. It means only one pixel is lightened. The solution is: The floating point sampling location (fixed float point) are used to reserve in Z-buffer, i.e. a more accurate point instead of the integer voxel position. Another buffer of size of the OEV window, called Voxel buffer, is created to keep the voxel list which is projected on the same pixel in Shadow buffer and have the same beam depth. The data structures of three buffers are: struct { long u, v, w; /* the sampling point in volume – fixed float point */
International Conference Graphicon 1999, Moscow, Russia, http://www.graphicon.ru/
long surf-intensity; /* the illumination intensity of current pixel */ } Z-buffer; /*OEV window size */ struct { short x, y; /* the coordinate of screen Z-buffer */ long depth; /* distance to irradiation source
*/
long surf_pos; /* voxel position */ } Shadow-buffer; /* BEV window size */ struct { short x, y; /* the next pixel in Z-buffer which has the same beam depth and projected to the same pixel in Shadow-buffer */ } Voxel-buffer; /* OEV windgaow size */
Figure 7: Beam projection on patient skin
During comparison of the beam depth of current voxel with the reserved beam depth in Shadow-buffer: If the beam depth of current voxel < the beam depth in Shadow-buffer; then the voxel list in Voxel-buffer started by (x, y) in Shadow-buffer are deleted and the new (x, y) is the current Z-buffer pixel. If the beam depth of current voxel = the beam depth in Shadow-buffer; then the current pixel is inserted into the list of Voxel-buffer. After comparison, the visible pixel list in Shadow-buffer and Voxel-buffer are traversed and corresponding pixels in OEV window are lightened, see Figure 7. In Figure 7 and Figure 8, the red cross is the projection of the iso-center. In Figure 7, we can see the red cross matches the landmarks on the patient skin after interactive registration. In Figure 8 down, blocks are designed on the DRR image. When blocks are considered, the irradiation field is shaped and its projection on the patient skin gives us a hints to see its relationship with the PTV, see Figure 8 up image. The introduced method is fast enough to interaction. When only the beam parameters are changed, such as the size of collimator, the rotation angel of collimator, the new blocks, only the different part of the OEV image are lightened without the re-rendering of BEV and OEV. When other machine parameters are changed and the viewing angel of OEV is not changed, only BEV is re-rendered.
5. INTERACTIVE DELINEATION The CTV is delineated by contouring object in key slices. The object contours among key slices are interpolated by the contours on the next and last key slices, see Figure 9. The contoured objects are represented internally by a ValidVol volume. Different rendering methods can be
Figure 8: Beam projection with blocks and PTV applied to distinguish the voxels inside the CTV and outside the CTV, see Figure 3.
International Conference Graphicon 1999, Moscow, Russia, http://www.graphicon.ru/
Key Slice A
Interpolated Slice
Table Height
Key Slice
B C
Figure 9: Contouring and Interpolation Figure 11: Gradient opacity for skin detection
6. INTERACTIVE FIELD SETTING After delineation, the target volume is visualised on DRR. Interactive field setting supplies the physicians with the following functions, draw an irradiation field directly on DRR image, to design an irradiation field covering the target volume by mouse dragging, see Figure 12. move the drawn field to the iso-centre automatically by iso-centric setting (set the iso-centre at the middle of the patient’s body) or SSD setting (set iso-centre based
Figure 12: Interactive field drawing directly on DRR image
on Source to Skin Distance, for example SSD 100 sets the iso-centre at the patient’s skin since the distance between iso-centre to source is 100 cm), see Figure 10. Within automatic iso-centre setting, we have to detect the patient skin along the iso-centre axis. Therefore, we calculate the opacity through the volume along the isocentre axis in a region of 3×3 or 5×5. In SSD, only the first intersection point of iso-centre axis and skin is detected by calculating the first visible voxel (opacity is larger than a threshold) along iso-centre axis. In iso-centric setting, two intersection points, one enter point and another exit point of iso-centre axis, are required in order to calculate the middle point of the patient, which corresponds to the first and last visible voxel along the iso-centre axis, see Figure 11. If the red line is the iso-centre axis, the first and last visible voxles are voxel A and voxel C respectively. In this case, voxel A is correct but voxel C is not correct because it is on the CT table rather the patient skin. This problem is solved by a CT table height setting. After data loading, the CT table height is set by the user, see the green line in Figure 11. Since the CT table is re-equipped to the plane table, the table height in all slices is the same. The intersection points of iso-centre axis and patient are required above the table height. Thus, point B rather C is selected as the exit point of iso-centre axis. In Figure 11, point A is for SSD setting, (Point A + Point B)/2 is used to calculated the iso-centric setting, i.e. at the middle of patient body.
7. CLINICAL EVALUATION
(a) iso-centric setting
(b) SSD100 setting
Figure 10: Automatic Iso-centre Setting
The first prototype EXOMIO system has been installed at the Stätische Kliniken Offenbach in February 1998. This first version aims to train and make the doctors familiar with the idea of the virtual simulation. Their comments and suggestions have been used to improve the system’s functionality. An updated version has been installed at the end of 1998. At the oncology clinic the validity and accuracy of the EXOMIO system have been measured. All of the CT data sets used for our validation and accuracy
International Conference Graphicon 1999, Moscow, Russia, http://www.graphicon.ru/
measurements, produced from a SIEMENS Plus 4 spiral CT system. The Plus 4 system is able to produce one slice in 0.75 sec. This means to scan an area of 300mm using 3mm slice thickness 75sec are need. A cubic phantom of size 120x120mm, which was available from the clinic, was initially used to check the accuracy of EXOMIO. The phantom was scanned using 3mm slice thickness. The total number of produced slices was 90, in square CT matrices of 512x512 pixels. Using this data set the system volume coordinates, the machine movements, and all of the system algorithms have been tested. The system error concerning the volume coordinates, the machine movements, and the interactive landmarks registration was at ±1mm. The algorithms automatic SSD settings, the automatic translation of the PTV’s center of gravity to the iso-center, the automatic adaptation of the collimator size and angle and the automatic block adaptation gave an error of ±1mm. The number of patients RTP simulated by EXOMIO was 127, see Table 1. In all of the cases the slice thickness used during CT scanning of the patient remains constant at 3mm and the number of slices was variable from 63 to 125 depending on the case study. The error measured in above cases was within ±3 mm. It should be mentioned that the slice thickness is an important factor to the system accuracy. An interesting point during the validation of the automatic beam adaptation algorithm was the fact that in some cases the produced fields had asymmetrical shape due to the PTV gravity. To eliminate this effect we use the center of the geometric gravity of the PTV instead of the center of gravity. N o. C ases 15 12 11 13 24 13 15 17 7 127
C a s e S tu d y B ra in T u m o u rs H e a d & N e c k T u m o u rs B re a s t T u m o u rs B ro n c h ia l C a rc in o m a R e c ta l C a rc in o m a P ro s ta te C a rc in o m a C e rvix C a rc in o m a B o n e M e ta s ta s is L ive r M e ta s ta s is T o ta l
Table 1: Simulated Studies in EXOMIO
8. CONCLUSIONS AND FUTURE WORKS In this paper, we presented EXOMIO, a Virtual Simulator in RTP. Different to the available systems, EXOMIO is based on volume rendering techniques. In addition to the general system overview, we emphasise the interaction on volume rending images, especially on DRR image and gradient surface image. Some key techniques developed based on the interaction are introduced. We concluded,
Volume rendering gives us a method to generate high quality and accurate rendering images for VS, especially realistic DRR and gradient surface rendering. The speed of volume rendering is fast enough to guarantee all the interactions in VS in real time. Interaction based on volume rendering images enhances significantly the reality of VS working environment. Registration by interaction on gradient surface rendering image is a novel interactive registration method. The display of beam projection area on patient skin is a new application of shadow buffer, and it greatly enhances the reality of virtual simulation. The simulation of RTP cases using EXOMIO in comparison to the real Simulator is at least two times faster, depending on the case study. The accuracy of the simulation process has been improved about 2mm using EXOMIO, since the real Simulator provides ±5mm accuracy. VS reduces the laborious efforts to the whole process of the RTP simulation. The following new features will be integrated into the system in the future, Porting to Window NT DICOM RT as Input and Output Dose Visualisation [CaSa99] Integration
9. REFERENCE [BeSh98] Bedford, J., and Shentall, G. A digital method for computing target margins in radiotherapy. Medical Physics, 25:224-231, 1998 [BPRG97] Belshi R., Pontvert D., Rosenwald J. C., Gaboriaud G. Automatic three-dimensional expansion of structures applied to determination of the clinical target volume in conformal radiotherapy. Int. J. Radiation Oncology Biol. Phys., 37(3):689-696, 1997. [Cai99] Cai, W. Transfer functions in DRR volume rendering. CARS'99, Paris, France, June 23-26, 1999 [CaSa99] Cai, W. and Sakas, G. Data intermixing and multi-volume rendering. EUROGRAPHICS'99, Milan, Italy, September 7-11,1999 [HaPu97] Harms B., and Purdy A., Evaluating commercially available three dimensional radiotherapy
International Conference Graphicon 1999, Moscow, Russia, http://www.graphicon.ru/
treatment planning system. Oncology, 7(1): 83-94, 1997
Seminars
in
Radiation
[KBWD98] Khoo S., Bedford L., Webb S., and Dearnaley P. Comparison of 2D and 3D algorithms for adding a margin to the gross tumour volume in the conformal radiotherapy planning of prostate cancer. Int. J. Radiation Oncology Biol. Phys., 42(3): 673-679, 1998
Computing & Medical Imaging" department. His research topics include medical modelling, reconstruction, visualisation & volume rendering, multimedia user interfaces & telecommunication. E-mail:
[email protected]
[Levo88] Levoy, M. Display of surface from volume data. IEEE CG&A, 8(5), 1988 [MePu94] Meyer J., Purdy J. (eds) 3-D Conformal radiotherapy. A new Era in the Irradiation of Cancer. Karger Verlag, 1994 [SaGS95] Sakas, G., Grimm, M. and Savopoulos, A. Optimised maximum intensity projection (MIP), Rendering Techniques'95, Springer Verlag :51-63, 1995 [Saka93] Sakas, G. Interactive volume rendering of large fields. The Visual Computer, 9(8):425-438, August 1993 [PICK] http://www.picker.com [GE]
http://www.ge.com
[Prowess] http://www.prowess.com [Nucletron] http://www.nucletron.com/
Author(s): Wenli Cai: Wenli Cai received his B.S. degree at Zhejiang University in 1988 and his M.S. degree at Shanghai University of Science and Technology in 1991, both on Computer Science. He joined the State Key Lab of CAD&CG at Zhejiang University as the principle researcher on Scientific Visualisation in 1991. From 1995, he has been the associate professor of Zhejiang University. From January 1997 he has begun his work in FhG-IGD. His current research is on Medical Visualisation, especially on volume rendering and radiotherapy treatment planning. E-mail:
[email protected] Grigorios Karangelis: Grigorios Karangelis received his B.S. degree in Technological Educational Institute of Athens in the department of Technology of Medical Instruments in 1996 and his M.Sc degree in University of Dundee in the Biomedical Instrumentation Engineering in 1997. From 1997, he started his research work in FhGIGD. His research interests are 3D Conformal Radiotherapy, Medical Image Processing, and Medical Imaging and Visualization. E-mail:
[email protected] Georgios Sakas: Georgios Sakas received a Diploma in Computer Engineering (1987) and a PhD in Computer Graphics (1992) from the Technical University of Darmstadt. Since 1992 he is with the Fraunhofer Institute for Computer Graphics where he is heading the “Cognitive
International Conference Graphicon 1999, Moscow, Russia, http://www.graphicon.ru/