Abstract. In this paper we present WALTy (Web Application Load- based Testing tool), a set of tools that allows the perfor- mance analysis of web applications by ...
WALTy: A User Behavior Tailored Tool for Evaluating Web Application Performance G. Ruffo, R. Schifanella, and M. Sereno Dipartimento di Informatica Universit`a degli Studi di Torino Corso Svizzera, 185 - 10149 Torino (ITALY)
Abstract In this paper we present WALTy (Web Application Loadbased Testing tool), a set of tools that allows the performance analysis of web applications by means of a scalable what-if analysis on the test bed. The proposed approach is based on a workload characterization generated from information extracted from log files. The workload is generated by using of Customer Behavior Model Graphs (CBMG), that are derived by extracting information from the web application log files. In this manner the synthetic workload used to evaluate the web application under test is representative of the real traffic that the web application has to serve. One of the most common critics to this approach is that synthetic workload produced by web stressing tools is far from being realistic. The use of the CBMGs might be useful to overcome this critic.
R. Politi CSP Sc.a.r.l. c/o Villa Gualino Viale Settimio Severo, 65 - 10133 Torino (ITALY)
ticular, stressing tools make what-if analysis practical in real systems, because workload intensity can be scaled to analyst hypothesis, i.e., a workload emulating the activity of N users with pre-defined behaviors can be replicated, in order to monitor a set of performance parameters during test. Such workload is based on sequences of objectrequests and/or analytical characterization, but sometimes they are poorly scalable by the analyst; in fact, in many stressing framework, we can just replicate a (set of) manually or randomly generated sessions, losing in objectivity and representativeness. The main scope of this paper is to present a methodology based on the generation of a representative traffic. To address this task, we implemented WALTy, a set of tools using Customer Behavior Model Graphs for characterizing web user profiles and for generating virtual users web sessions.
1.1
1
Introduction
One of the main important steps in Capacity Planning is performance prediction: the goal is to estimate performance measures of a web farm under test for a given set of parameters (i.e., response time, throughput, cpu and ram utilization, number of I/O disk accesses, and so on). There are two approaches to predict performance: it is possible to use a benchmarking suite to perform load and stress tests, and/or use a performance model. A performance model predicts the performance of a web system as function of system description and workload parameters. The models can be either simulative or analytical. By using these models, performance measures such as response times, throughput, disk storage and computational resource consumption, can be derived. These measures can be used to plan an adequate capacity for the web system. On the other side, benchmarking and stressing suites are largely used in the industry for testing existing architectures with expected traffic. In par-
Related Works
The literature on workload characterization of web application is quite vast and therefore it is difficult to provide here a comprehensive summary of previous contributions. In this section we only summarize some of the approaches that have been successfully used so far in this field and that are most closely related to our work. Benchmarking tools are intended to evaluate the performance of a given web server by using a well-defined and often standardized workload model when performance objectives and workloads are measurable and repeatable on different system infrastructures. The most important examples are SpecWeb99 [3], Surge [10], TPC-W [16], WebStone [5] and WebBench [4]. Load testing tools, instead, evaluate the performance of a specific web site on the basis of actual users behavior, they capture real user requests for further replay where a set of test parameters can be modified. Httperf [18] developed at Hewlett-Packard, WebAppLoader [21], openSTA [2], Mercury Load Runner [1], S-Client [9] and Geist [14] are some
Proceedings of the Third IEEE International Symposium on Network Computing and Applications (NCA’04) 0-7695-2242-4/04 $ 20.00 IEEE
interesting proposals. All applications mentioned above may differ on the characterization of the request stream: SpecWeb99, WebStone, WebBench, TPC-W use a file-list based approach, Surge is an analytical distribution driven tool where mathematical distributions represent the main characteristics of the workload. Finally, httperf, Geist and OpenSTA, use a trace-based or an hybrid approach (see Section 3 for an approach classification). Some stressing tools, e.g. S-Client, do not aim to provide a realistic workload characterization. Moreover, benchmarking tools like SPECWeb99, WebStone, WebBench provide a limited characterization and others attempt to provide a realistic workload at least for a specific class of web site. For instance, TPC-W specifies an e-commerce workload that simulates customers browsing the site and buying products. Finally, characterization in some tools, e.g. httperf or Geist, greatly depends on a set of configuration parameters. The goal of improving web performance can be achieved if web workload is well understood (see [20] for a survey of WWW characterizations). The nature of web traffic has been deeply investigated. The first set of invariants is proposed in [7], and in [13] a discussion about the self-similar nature of the web traffic is presented. In [17] two important models for the characterization of user sessions are introduced: the Customer Behavior Model Graph (CBMG) and the Customer Visit Model (CVM). Unlike traditional workload characterizations, these graphbased models are specifically introduced for e-commerce sites, where user sessions are represented in terms of navigational patterns. These models can be obtained from the http logs available at the server side. One of the novelties of the tool presented in this paper is that it uses a characterization of user behaviors, i.e., the CBMGs not only for e-commerce sites but also for other types of http servers. In this case the main problem that we need to address is the extraction and/or the classification of information from those that can be collected from http logs. Moreover, CBMG states are clearly defined for an ecommerce site (e.g., Home, Exit, Browse, Add to Basket, Pay, as discussed in [15]). On the contrary, for a generic service, definition of states is somehow not trivially generalizable. As a consequence, CBMG states must be defined ad hoc when needed.
1.2
Outline and Contribution of the paper
In this paper, we focus on a particular application field of web mining [11], which is Capacity Planning and Web Performance. In particular, in the next section, we present how a CBMG for each user profile can be extracted from log files and other available data. The whole framework is intro-
Entry Browse
Registration
Download Exit
main entrances of the site static (sometimes with volatile content) pages containing advertising information, on-line catalogues, latest news, . . . user enters his own reserved area or he registers herself by means of dynamic pages (e.g., cgi-bin, php scripts, and so on) registered user consults the list of available resources and downloads them user leaves the site, navigating elsewhere or closing the connection;
Table 1. CBMG states of a generic service duced in Section 3, and WALTy tool is shown as composed of two main modules: CBMGBuilder aims at the extraction of CBMGs from log files; CBMG2Traffic is the traffic generation module, that produces a trace-based synthetic workload on the basis of the given CBMG descriptions of the user sessions and using a modified version of httperf tool. This module implements and extends the original proposal described in [8], where a given CBMG was used to assist the analyst to select an existing session. More realistically, WALTy uses a CBMG to generate many different sessions characterized by the same profile. In Section 4, a set of experiments will be presented. Section 5 concludes the paper outlining some future developments.
2
The Customer Behavior Model Graph
The CBMG is a state transition graph proposed for workload characterization of e-Commerce sites. In this paper we show that such a model may have a wider field of applications. We will use a CBMG to represent every session, and in a second phase a clustering algorithm is used to gather together identified sessions. This is useful for obtaining a representation of a user profile, corresponding to group of users with similar navigational patterns. Such models can be used for analyzing e-business services [17], for capacity planning tasks, or also for replicating representative workload for the given site, when a stressing test is going to be performed [8]. A CBMG is a graph where each node represents a possible state. For the sake of simplicity, a state can be defined as a collection of (static or dynamic) pages, having similar functionalities. For example, if the site under test provides a public area about the company’s activities, and a download area is reserved to registered users, each (static or dynamic) page can be assigned to one of the states in Table 1. Such states must be defined by the analyst, because sites may have different purposes, and a functional categorization of different pages must be performed by an human expert. Of course, the number of states can degenerate in the number of existing pages (i.e., a state for each page), but, in general, the number od states should be limited. Existing links between pages belonging to different
Proceedings of the Third IEEE International Symposium on Network Computing and Applications (NCA’04) 0-7695-2242-4/04 $ 20.00 IEEE
states, are represented like graph transitions. The weight associated to each arc in the graph represents the transition probability (Figure 1). Formally, a CBMG is represented by a pair (P, Z) of n× n matrices, where n is the number of considered states, P = [pij ] contains the transition probabilities between states, and Z = [zij ] represents the average server side think times between states1 . A CBMG model is highly scalable: the 0.1
0.75
Browse
Browse 0.8
0.15
0.2
0.3
0.2 0.7
0.1
Entry 0.2
Registration/ 0.8 Login
Exit
Entry
0.7
Registration/ 0.2 Login
Exit
0.7 (a)
Download
0.6
Download
0.4
Figure 1. CBMGs representing two typical users of the given service: (a) an occasional visitor, (b) a registered user
number of states changes from site to site and it can be fixed before generating the model from log files. In principle, the number of states can change also when a site is modified, as well as the definition of the states. In these cases, the model can be regenerated; however, this happens only when the site is strongly modified and this modification influences the entire site structure. Normally, modifications affect only a (set of) page(s): we need to upgrade only the corresponding state definition, which is made of a list of pages. This workload characterization is built by using two (Web Mining) phases: (1) pre-processing, and (2) clustering. In the following, we use a fine-grained description, focusing on the pre-processing and the clustering phase. As a consequence, four different sub-processes are described: 1. Merging and filtering web logs: a Web site may be composed of several servers. All the log files in the cluster are merged together. Moreover, log entries not influencing the identification of user sessions, can be filtered out (for instance, requests of embedded objects, as images, video clip, and so on)2 . 2. Getting sessions: log files contain request-oriented information. During this phase, data are transformed 1 In a server log file, a transition can be detected as two successive page-requests of the same user session. The server think time is defined as the difference between corresponding consecutive arrival times, minus the server execution time. 2 Resulting CBMGs will be used in WALTy to emulate representative traffic. A stressing tool should generate synthetic load due to images, video clips and other embedded objects requests. However, embedded objects can be filtered out during data cleaning. In fact, our tool will make a request for each embedded object, when the traffic generator asks for a given web page.
(b)
into a session-oriented format. If we have information extracted from log files in the Common Log Format, a session can be only characterized by a sequence of requests from the same IP-address. If there is a pause longer than a certain amount of time (on average 30 minutes3 , depending upon the web site) since a request from the same IP-address and the next, then the session is considered closed. After this process, a Request Log File can be generated, where each session is identified by an unique ID and it is represented by a sequence of page-requests. This session identification is, of course, not really representative, and a successive analysis is awkward. But if session information is available, session tracking techniques can be used as well. In Section 3.1 our session identification approach is explained in more detail. 3. Transforming Sessions: Let us assume that n is the number of different states. For each session S, we create a point XS = (CS , WS ), where CS = [cij ] is a n × n matrix of transition counts between states i and j, and WS = [wij ] is a n × n matrix of accumulated server-side think times; 4. CMBGs clustering: from all XS points, a number of CBMGs is generated. A K-means clustering algorithm is adopted in order to find a relatively small number of CMBGs that models different sessions with similar navigational patterns4 . As pointed out in [15] (where algorithm seen above are explained in detail), the CBMG gives other useful information. One of the most important is the average number of visits Vj to each state j. This value can be calculated by solving the following equations: V1 = 1n � Vk × pkj Vj = k=1
− → Other parameters can be derived from vector V : average session length, is the number of states visited by an �average n−1 user for each visit: k=1 Vk . Moreover, each Vi is an interesting metric, because it represents the ratio between the number of visitors that entered the i state, w.r.t. the total number of visits. For example, 3 According to IFABC Global Web Standards (www.ifabc.org) an User Session (or a Visit) is a “series of one or more Page Impressions, served to one User, which ends when there is a gap of 30 minutes or more between successive Page Impressions for that User.”. 4 In literature there are many Pattern Recognition and Clustering algorithms that can be used for such goal, and a further research study should be conducted in order to select the solution that best fits this domain. In our tool, we implemented a basic K-means methodology as proposed in [15].
Proceedings of the Third IEEE International Symposium on Network Computing and Applications (NCA’04) 0-7695-2242-4/04 $ 20.00 IEEE
in a e-Commerce site, the buy to visit ratio is equal to Vp , where p is the given Pay state5 ; i.e., Vp is the ratio between the number of customers who effectively buy from the Web store and the total number of visits.
3
A Framework based on Representative Workload Generation
Many methodologies, techniques and tools have been developed to support capacity planning and performance prediction. The given approach involves performing load, stability and stress test using workload generators to provide a synthetic workload: web stressing tools use scripts describing user sessions to simulate so called Virtual Users (VU) browsing the web site. Four metrics are used to evaluate the web site performance (requests served per second, throughput in bytes per second, round-trip time, errors) and many parameters can be measured to detect system bottlenecks (e.g., CPU and RAM utilization, I/O Disks access, Network traffic). There are two kind of benchmarking approaches: the absolute benchmarking (or just benchmarking) approach differs from application benchmarking (or just load testing [6]) in the workload model used to test the architecture: since the scope is to provide comparable results for different platforms (hardware, operating system, supporting middleware) the generated workload will always be the same, provided it is scalable enough to cope with systems ranging from single processor machines to cluster of servers (i.e., Web Farm). Conversely, the aim of load testing is to highlight bottlenecks and points of failure and the workload should be generated accordingly. One of the most common objections to the approaches developed, is that synthetic workload produced by web stressing tools is far from being representative of the real traffic. Three main approaches can be identified for the characterization of the request stream: • trace based: the characteristics of the Web workload is based on pre-recorded trace logs (e.g., LoadRunner by Mercury Interactive, OpenSta [2], httperf [18], WebAppLoader [21]); • file list based: the tools provides a list of Web objects with their access frequencies. During workload generation, the next object to be retrieved is chosen on the basis of its access frequency (e.g., SpecWeb suite [3]); • analytical distribution driven: the Web workload characteristics are specified by means of mathematical distributions (e.g., Surge [28]). 5 In an e-Commerce domain, possible states are: Entry, Browse, Search, Add to Cart, Select, Pay and Exit, as described in [15].
In general, stressing clients replicate a (set of) artificial session(s) or navigational patterns. Depending on the given stressing tool, virtual users are assigned to: 1. randomly generated user sessions; 2. manually generated user sessions; 3. user sessions extracted from log files. Relevant drawbacks to these approaches are, respectively, (1) impossibility to generate a realistic workload, (2) subjectivity, (3) lack of scalability. An acceptable solution might be to provide every single VU a profile. Such a profile, can be represented by means of a CBMG. In a common trace-based stressing framework, scripts are generated to describe the behavior of each VU. These scripts can be used to emulate a browser, sending a server sequences of GET (or POST) requests for pages and embedded objects. Between successive requests, the virtual user can be configured to wait a given interval of time (client think time). When scripts (i.e., virtual users navigational patterns) are defined, the given stressing tool activates a load generator module. It provides means to generate a synthetic workload according to the recorded scripts. A stressing client is a load generator that runs a test; during a test session, stressing clients execute one or more scripts by means of each VU. We can assign many VUs to each script, batch them in time and number according to our needs of analysis and measurement. Moreover, each stressing client includes a performance collector for gathering the client’s performance parameters and it can be integrated with a SNMP agent for sending measures to the master stressing client. In other words, each stressing client outputs a synthetic http workload which reflects the given scripts. This workload is replicated for each VU assigned to the given stressing client. The test can be distributed to a plurality of stressing clients, that under the master stressing client control, can launch generated http Workload against the targeted web farm via the Internet or a LAN. The master stressing client usually includes an SNMP manager, and it collects the performance measurements of the system under test and of the other stressing clients via SNMP protocol. Finally, it produces a report of performances observed during the test. Httperf [18] can be used in such a scenario, and we integrated it in our tool. In the following, we describe the fundamental steps of our tool: (1) How CBMG are extracted from log files and (2) How CBMGs are used to generate httperf virtual users behaviors.
3.1
CBMGBuilder: from log files to CBMGs
In this section we focus on the first component of WALTy: the creation of CBMGs from input data. Because
Proceedings of the Third IEEE International Symposium on Network Computing and Applications (NCA’04) 0-7695-2242-4/04 $ 20.00 IEEE
a Customer Behavior Model Graph is a session-based representation of a user navigational pattern, session identification from data is a central topic, because web logs format is inherently hits-oriented. In general, server side logs include client IP address (machine originating the request, maybe a proxy), user ID (if authentication is needed), time/date, request (URI, method and protocol), status (action performed by the server), bytes transferred, referrer and user agent (operative system and browser used by the client). As this information is uncomplete (hidden request parameters using the POST method) and not entirely reliable, these information should be integrated using packet sniffers and, where available, application server log files. Depending on the data actually available for the analysis, typical arising problems in user behavior reconstruction include: multiple server sessions associated to a single IP client address (as in the case of users accessing a site through a proxy); multiple IP addresses associated to multiple server sessions (the so called mega-proxy problem); user accessing the web from a plurality of machines; a user using a plurality of user agents to access the Web. Assuming that the user has been identified, the associated click-stream has to be divided in sessions. The first relevant problem is the identification of the session termination. Other relevant issues are the need to access application and content server information and the integration with proxy server logged information relative to cached resources access. A wide range of ad hoc techniques have been implemented and adopted by the community to identify a web session [12, 19]: cookies, user authentication, URL rewriting, and so on. Unluckily, no one of these proposals is clearly superior than the others, and the definition of a new standard is missing. Moreover, logging procedures are not uniformly defined. In such a domain, it is important to define a scalable and integrated methodology to session identification. This methodology should be scalable in order to handle with any new data source without modifying the core application or rewriting and recompiling the code. As a second important feature, this approach should integrate many different input formats in a common framework. Last, new schemes and formats should be easily included in this environment, when they appear to the analyst. Proposed methodology is composed of the following steps: • Data model definition: an abstract data model is defined. This includes any specific information necessary for a correct execution of the implemented application. Obviously, it is strongly dependent on the particular domain of interest. In such context, we defined the CBMG Input Format (CIF) that is made of the following fields: sessionID, timestamp, request, executionTime. The sessionID is an alphanumeric
string that uniquely identifies a session. If the source is a log file in the standard Common Log Format, this field is not directly available; instead, we have the IP address and, as previously discussed, the application of a session-identification heuristic is necessary for reproducing a realistic situation. On the other hand, if the source is a servlet filter, the session can be identified correctly without further analysis. The timestamp relates to the moment when the request is received by the web server, whereas the request contains the required resource. Finally, the executionTime is an estimation of the time that the server spends to complete the request; if this information is not available, (i.e., when the source is in the standard Common Log Format), we assume a null value. • Kernel-Module scheme implementation: Such as in the object-oriented paradigm, we need a kernel-module scheme. Let the kernel be a core module implementing an abstract service (e.g. translation of an undefined input format to our data model); when we need to deal with a new instance of the service (e.g. translation of the Common Log Format to our data model), a new module implementing the given feature is just added to the kernel6 . Kernel KernelClass
InterfaceModule
- obj: InterfaceModule
+ translate(): void
+ myMethod(): void
Module ImplModule + translate(): void
ImplModule2 + translate(): void
Figure 2. Kernel-Module scheme Figure 2 shows how Kernel class manages the abstract method myMethod. It uses translate method declared in InterfaceModule interface. But, translate method is implemented in different modules, e.g. ImplModule and ImplModule2, according to the requirements of the specific application. These classes are defined as plugins for the application. A plug-in performs the simple task of transforming the format of a generic source file into the data model previously defined (e.g., CIF). • Plug-in implementation: when a new file format is encountered or a session identification technique is intro6 For example, the Java language uses this mechanism to implement the Swing graphic library or all the operations involving Collection objects.
Proceedings of the Third IEEE International Symposium on Network Computing and Applications (NCA’04) 0-7695-2242-4/04 $ 20.00 IEEE
duced, a new plug-in must be implemented, in order to handle the conversion to the defined data model. This plug-in is added to the kernel module as previously discussed. This process permits a simple and practical management of several session identification mechanisms, shifting the format conversion problem at implemented plug-ins. CBMGBuilder module is implemented merely using input file with CIF syntax and allow the creation, installation and deletion of a plug-in. CBMG building process is made of other fundamental steps, in addition to session identification: • States definition: as described in Section 2, a state is a collection of (static or dynamic) pages, having similar functionalities. The problem is to map a physical resource into a logical state. CBMGBuilder let the user define a state by means of a set of rules. Each rule has three main components: a directory, a resource name and an extension. Simple regular expressions can be adopted as well. For instance, state Browse can be defined by means of the following rules: {information/*.*,*/*.html}, that matches with all the files contained in directory information, and all the files with extension .html. • Embedded objects definition: in the pre-processing phase (see Section 2), embedded objects should be filtered out. In WALTy, embedded objects are defined by a set of rules and using the syntax adopted for states definition, e.g., {*/*.gif, */*.jpg, */*.swf}. • General parameters specification: in order to create a set of CBMGs that represents the behavior of a user’s web site, WALTy allow the user to specify the following parameters: – number of clusters: each CBMG models the navigational pattern of a given session. We need clusters of CBMG to model a generic user profile. The analyst can properly configure the number of profiles (i.e., clusters). – Session Time Limit (STL): two successive requests from the source, should be lesser than given STL to be labelled with the same Session ID. – Session Entry Limit: it specifies the minimum number of requests in a session. It goes without saying that the rules above must be described by an analyst who studied carefully the site. As a consequence, she can properly set up the number of states and their definitions, the number of clusters (i.e., user profiles), the rules for filtering out hits concerning embedded objects, and so on.
3.2
Generating Representative Web Traffic from CBMG
When a CBMG is generated for each user profile, the next step in the emulation process is traffic generation. As in the general trace-based framework previously described, traffic is generated by means of a sequence of http-requests, with a think time between two successive requests. This Section describes how to generate such a sequence from CBMGs. Let us suppose that the clustering phase returned m profiles {Φi }, where i = 1, ..., m. Each profile is a CBMG defined as a pair (P, Z) of matrices n x n, where n is the number of states (see Section 2). Observe that each profile Φi , corresponds to a set of sessions {Si1 , Si2 , ..., Sip }. Let us indicate the cardinality of this set of sessions with |Φi |. Moreover, let us define the Representativeness of profile Φi , as the value: |Φi | , ρ(Φi ) = m � (|Φi |) i=1
which is the rate of the number of sessions corresponding to profile Φi , w.r.t., the total number of sessions. When generating traffic to our system under test (SUT), profiles Φi are used to properly set up the behaviors of virtual users. In Figure 3, a set of different clients is used to run several clusters of virtual users, that are defined by means of different profiles. WALTy clienti
WALTy clientj
profile Φi
profile Φj
... N*ρ(Φi) sessions
N*ρ(Φj) sessions stats
Workload Generator
Workload Generator HTTP requests
statistics
HTTP requests
statistics
HTTP requests
SUT
Figure 3. Stressing framework based on WALTy clients Observe that value ρ(Φi ) is very important to our analysis, because it gives a way to calculate a representative number of virtual users running with the same profiles. For ex-
Proceedings of the Third IEEE International Symposium on Network Computing and Applications (NCA’04) 0-7695-2242-4/04 $ 20.00 IEEE
ample, if we want to start a test made of N virtual users accessing the server, we can parallelize stressing clients jobs as it follows: client i, that emulates sessions with profile Φi , runs N ∗ ρ(Φi ) virtual users, with i = 1, ..., m. WALTy allows further scalability: in fact, we can perform a fine-grained test, changing relative profiles percentage, e.g., we can run experiments responding to questions like “what does it happens when users with profile ρ(Φ3 ) grows in number w.r.t. other classes of users?”. As a consequence, the framework can be generalized: client i runs N ∗ fi ∗ ρ(Φi ) virtual users, where 0 < fi < 1, if we want to reduce the representativeness of Φi , and fi > 1, if we want to strengthen it. To let the total number of virtual users be equal to N , the following further constraint must hold7 : m � fi ∗ ρ(Φi ) = 1.
Algorithm: CBMGtoSession input output
: A profile Φi = (P, Z), and resource set L : A session
begin Session ← ∅; State ← Entry; while State �= Exit do Page ← SelectPage(State, LState ); PageProperties ← SetPageProperties(Page); NextState ← SelectNextState(State, P); ThinkTime ← EstimateThinkTime(State, NextState, Z); Request ← CreateRequest(Page, PageProperties, ThinkTime); Session ← Session ∪ {Request}; State ← NextState; end return Session; end
Algorithm 1: Generation of a user session from a CBMG specification
i=1
Another interesting feature of WALTy, is given by the natural scalability of a profile characterization model. In fact, the analyst can perform a what-if analysis at transition level, changing values in matrices P and Z. For example, the analyst may be interested in the consequences of a navigational behavior alteration, e.g., if a new link is planned to be published in the home page, a different navigation of the occasional visitor is reasonably expectable. Finally, we describe how a session can be generated from a CBMG. The procedure described in Algorithm 1, takes as input parameter a CBMG profile and the set L = {L2 , ..., Ln−1 }, where Li is the list of objects (e.g., html files, cgi-bin, . . . ) belonging to the i-th state8 . The cbmg2session procedure returns a session, made of a sequence of httperf requests9 . The httperf request syntax is the following: URL [par-list] think = value method = POST,GET,HEAD [data = byte-sequence];
where par-list is the list of parameters defined by means of attribute/value pairs: attribute1 = value1 : attribute2 = value2 : ...;
think is the think time that will elapse before next request; and data is the byte-sequence sent to the server when a POST method is executed. Algorithm 1 describes the generation of a new session from a CBMG. Such generation takes advance of the following functions: 7 In
fact, m
m
N ∗ fi ∗ ρ(Φi ) = N ∗
N = i=1
fi ∗ ρ(Φi ) = N ∗ 1 i=1
. 8 Observe that, by definition, the entry and the exit state are empty, i.e., L1 = Ln = ∅ 9 We considered the session-oriented workload generation httperf syntax [18]
• SelectPage(S, LS ): given a state S and the corresponding list of objects LS , this procedure selects an object (i.e., or simply a page) that belongs to LS with a simple ranking criterion, i.e., pages that are frequently accessed, are likely to be selected. In other words, it is not a random choice, but it is a popularity driven page selection. • SetPageProperties(Page): In order to create a well formed httperf request, WALTy associates the given page to the following set of properties: – Method: The HTTP method (GET, HEAD, POST) should be selected, in order to properly send the request for the given page. – Data: in the case of a POST method, a bytesequence to be sent to the server is allocated. – Parameters-list: if selected resource is a dynamic page (e.g. php script, jsp page, . . . ) needing a list of input parameters, WALTy will append to the request a sequence of (name=value) items. This sequence starts with a question mark “?”, and each item is separated by a colon “:”. These parameters should be previously defined by the analyst by means of a simple menu. • SelectNextState(S,P): It returns the next state to be visited during this session. The current state S is given as input to the procedure together with matrix P . The random selection is weighted by means of transition probabilities contained in P . • EstimateThinkTime(S,N,Z): A think time should also be defined in the httperf request. This value is extracted from matrix Z, i.e., the server side think time
Proceedings of the Third IEEE International Symposium on Network Computing and Applications (NCA’04) 0-7695-2242-4/04 $ 20.00 IEEE
corresponding to the transition from “old” state S to next state N 10 .
4
IT Area
Experimentation and activities of the Information Society methodologies
Institutional Area
Information about company structure and institutional activities
An Illustrative Case Study
IP Telephony Area
10 Observe that, by default, the web logs give timestamps that allow to obtain the distance from two consecutive client requests composed by these quantities: client think time, communication delay of network, and service time of server. If appropriately configured, web logs can give the value of service time. Moreover, the informations stored in web logs are inherently insufficient to calculate the exact value of client think time without modifying completely the client implementation to track this value. For this reason, the solution adopted in our tool uses only the informations available from web log files, i.e. the value extracted from matrix Z. 11 The choice of the number of clusters is up to the analyst. This value
Institutional News General IP Telephony IT Multimedia
Multimedia
Exit
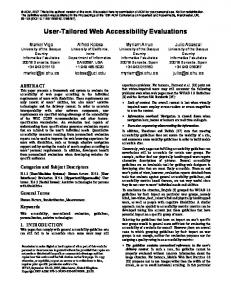
The CBMGBuilder module provides the CBMG characterization of the web application under test and it allows to derive other different measures such as the average number of visits for each state of the CBMG, and the average session length expressed in terms of number of states (of the CBMG) visited during a session (see Section 2). In the following, we provide an example of the possible investigations allowed by using the tool WALTy. We analyze the web server of the CSP, an italian research and development company. A simple logical map of this web site is depicted in Figure 5. The map identifies in a simple manner the “macro-areas” of this web server. The areas correspond (in most of the cases) to the different type of activities of this institution. We analyzed the web server log files collected during the period from April 11-st until September 16-th 2003. During the CBMG derivation phase we identify four different profiles11 of web-server users that correspond to four
Entry Institutional News General IP Telephony IT Multimedia Exit
0 0 0 0 0 0 0 0
0.02 0.53 0.13 0.03 0.04 0.02 0.06 0
0.42 0.19 0.29 0.9 0.11 0.06 0.03 0
0.56 0.06 0.04 0.06 0.2 0.05 0.06 0
0 0 0 0 0.59 0.03 0 0
0 0 0 0 0.03 0.8 0 0
0 0.03 0 0 0.03 0 0.72 0
0 0.19 0.54 0.01 0 0.04 0.13 0
Multimedia
Figure 4. Measurement intervals
IT
tend
IT
t2
IP Telephony
(Tlast)
IP Telephony
t1
last byte
General
first byte (Tfirst)
General
tstart
(Tconn)
different CBMGs. The representativeness of these CBMG are: ρ(Φ1 ) = 0.03, ρ(Φ2 ) = 0.68, ρ(Φ3 ) = 0.28, and ρ(Φ4 ) = 0.01. Figure 6 graphically shows one of these CBMGs and Table 2 reports its transition probabilities (upper matrix) and the server think time (lower matrix).
News
set up connection
(Tresp)
Figure 5. Logical map of the web server under test
News
response time
News and Press Area
News and articles about company activities
Institutional
(Ttrans)
General Area
General informations about the company
Institutional
transaction time
CSP site
Voice over IP research
Entry
In this section, we first present (some of) the measures that can be derived by using the tool. Figure 4 shows the measures that can be derived by using the module CMBG2Traffic. In particular, we can define several time intervals: the time required to set up the TCP connection Tconn (interval [t1 , tstart ]) , the time to receive the first byte of the server response (interval [t2 , t1 ]), the time to receive the last byte of the server response (interval [tend , t2 ]). From this we can derive the response time Tresp (interval [tend , t1 ]) and the transaction time Ttrans (interval [tend , tstart ]).
Multimedia Area
Development of all necessary multimedia components of product creation
36.3 49.7 63.9 185.6 80.7 89.5
93.8 78 11.4 505 476.8 324.4
115.8 229.9 144.2 96 176.1 169
0 0 0 28 319.9 0
0 0 0 381.4 28.8 0
33.8 0 0 251.2 0 31.4
Table 2. CBMG Φ3 : Transition probabilities and think times matrices We performed a simple experiment to verify that the synthetic workload generated by using the CBMGs matches the peculiarities of the original workload. In particular, we collected the log files obtained by using the synthetic workload, and then we compared the CBMG-based measures (i.e. 4, in our set of experiments) can be automatically calculated by algorithms (well known in the Pattern Recognition literature) that are not included in the present version of our tool.
Proceedings of the Third IEEE International Symposium on Network Computing and Applications (NCA’04) 0-7695-2242-4/04 $ 20.00 IEEE
based approach in other cases we obtained greater values). Our experiments allow to stat the following concluding remarks: the results that can be obtained by using web performance tools, where workload is composed by user sessions, strongly depend on the chosen virtual user behavior. The choice of the appropriate session description(s) is a delicate task. On the other hand, the approach we propose in this paper tries to propose a workload generation that does depend on the “real” user navigational patterns.
5
Figure 6. CBMG Φ3 has been derived from the analysis of the log file of the web server under test
derived from the original log files with those derived by using the synthetic workload. In all the cases, and for different virtual user inter-arrival distributions (exponential, uniform, truncated pareto), the values of the two versions of the CBMG-based measures are very closed (the differences are less than 5%). The aim of the next set of experiments is to provide an example of possible investigations that can be performed by using our tool. For each experiment we generated a CBMG-based workload with a different number of virtual users N and a duration of 10 minutes. The average session length of the CBMG used for the experiment is equal to 3. In our experiments the number of virtual users N ranges in the interval [3000-3900]. We summarized in Figure 7 the obtained results. In particular, the figure presents measures Ttrans and Tresp , obtained by using the CBMGbased workload. By using the Simple Network Management Protocol (SNMP) we can also access measures such as CPU, memory, and disk usage, that are not reported here for brevity. The main question that arises concerns the advantages of using the CBMG-based method we proposed. To provide an answer to this question, we perform several different experiments with workload composed of user sessions (for instance, sessions recorded by capturing real user navigational patterns). In particular, we used user sessions with a length equal to the average session length of the CBMG used for the experiments (i.e., 3). Although we use user sessions having the same length, we observed completely different behaviors (i.e., in some cases we obtained measures smaller than those obtained by using the CMBG-
Conclusion and Future Work
In this paper, we presented WALTy, a set of tools designed for testing Web applications by means of user profiling, traffic characterization, synthetic workload generation and monitoring agents. WALTy applies the general stressing methodology, but differently from other existing tools, it does not replicate to the system under test a (subjective) randomly or manually selected testing session, but it generates synthetic workload in an objective way, and in terms of the adopted user profile characterization. In other words, such a tool allows the following methodological steps: 1. identification of the case study and logical analysis of the site under test; 2. identification of logical states of the site, and consequent mapping of the web objects (e.g., pages, php scripts, and so on) to the states; 3. analysis of the physical system (e.g., how many servers in the web farm, which connection bandwidth, which computational and memorization resources, . . . ); 4. automatic creation of Customer Behavior Model Graphs from log files; 5. analysis of CBMGs (e.g., average session length, average number of visits, . . . ); 6. setting up of the test plant, i.e., replication of the system under test in an experimental environment; 7. generation of synthetic workload to replicated system by means of virtual user sessions extracted from CBMGs; 8. collection of monitored data and reporting. Several additional features are currently under development. In particular, we are improving measure collection modules to allow a more user friendly interface of WALTy. Moreover, we are implementing a reporting module that allows the derivation of performance measures via web interface. We are also implementing a module that allows to help
Proceedings of the Third IEEE International Symposium on Network Computing and Applications (NCA’04) 0-7695-2242-4/04 $ 20.00 IEEE
350
Ttrans
6000
300
5000
250 Time (msec)
Time (msec)
7000
4000
200
3000
150
2000
100
1000
50
0 3000
3200
3400
3600
3800
4000
0 3000
Tfirst 3200
3400
N
3600
3800
4000
N
Figure 7. Numerical results derived for different values of N virtual users and for different measures: Ttrans (left plot), and Tresp (right plot)
the preparation of experiments that use multiple client machines. Another development concerns the integration into WALTy gui of a module that uses the SNMP protocol to obtain measures related with the usage of server resources. The tool is made available under General Purpose Licence, and can be asked to the authors of this paper.
Acknowledgments This work has been supported by the Italian Minister of Research (MIUR), within the project WebMinds (FIRB).
References [1] LoadRunner by Mercury Interactive. http://www.mercuryinteractive.com/products/loadrunner/. [2] OpenSTA (Open System Testing Architecture). http://www.opensta.org. [3] Standard Performance Evaluation Corporation. http://www.specbench.org. [4] Webbench. www.veritest.com/benchmarks/webbench/ webbench.asp. [5] Webstone. http://www.mindcraft.com/webstone/. [6] M. Andreolini, V. Cardellini, and M. Colajanni. Benchmarking models and tools for distributed web-server systems. In M. C. Calzarossa and S. T. eds., editors, Performance Evaluation of Complex Systems: Techniques and Tools, volume LNCS 2459, pages 208–235. Springer-Verlag, September 2002. [7] M. F. Arlitt and C. L. Williamson. Web Server Workload Characterization: The Search for Invariants. In Proc. of ACM SIGMETRICS ’96, pages 126–137, 1996. [8] G. Ballocca, P. Politi, G. Ruffo, and V. Russo. Benchmarking a site with realistic workload. In Proc. of the 5th IEEE Workshop on Workload Characterization (WWC-5). IEEE Press, November 2002. [9] G. Banga and P. Druschel. Measuring the capacity of a web server. In USENIX Symposium on Internet Technologies and Systems, 1997.
[10] P. Barford and M. E. Crovella. Generating Representative Web Workloads for Network and Server Performance Evaluation. In Proc. of ACM SIGMETRICS ’98, pages 151–160, 1998. [11] R. Cooley, B. Mobasher, and J. Srivastava. Web Mining: Information and Pattern Discovery on the Word Wide Web. Technical report, Dept. of Computer Science, University of Minnesota, Minneapolis, MN, USA, 1997. [12] R. Cooley, B. Mobasher, and J. Srivastava. Data preparation for mining world wide web browsing patterns. Knowledge and Information Systems, 1(1):5–32, 1999. [13] M. Crovella and A. Bestavros. Self-Similarity in World Wide Web Traffic: Evidence and Possible Causes. IEEE/ACM Transaction on Networking, 5(6), Dec 1997. [14] K. Kant, V. Tewari, and R. Iyer. Geist: A generator for ecommerce internet server traffic. [15] D. Menasc´e, V. A. Almeida, R. Fonseca, and M. A. Mendes. A methodology for workload characterization of e-commerce sites. In Proc. of ACM Conf. on E-Commerce, Nov 1999. [16] D. A. Menasce. Tpc-w: a benchmark for e-commerce. IEEE Internet Computing, May-June 2002. [17] D. A. Menasc´e, A. V. Almeida, R. Fonseca, and M. A. Mendes. Scaling for E-business: Technologies, Models and Performance and Capacity Planning. Prentice Hall, 2000. [18] D. Mosberger and T. Jin. httperf: A Tool for Measuring Web Server Performance. In In Proc. of First Workshop on Internet Server Performance, pages 59–67. ACM, 1998. [19] J. Pitkow. In search of reliable usage data on the WWW. Computer Networks and ISDN Systems, 29(8–13):1343– 1355, 1997. [20] J. E. Pitkow. Summary of WWW Characterizations. Computer Networks and ISDN Systems, 30(1–7):551–558, 1998. [21] K. Wolter and K. Kasprowicz. WebAppLoader: A Simulation Tool Set for Evaluating Web Application Performance. In In Proc. of TOOLS 2003, volume LNCS 2794, pages 47– 62, Urbana, Illinois, USA, 2003. Springer-Verlag.
Proceedings of the Third IEEE International Symposium on Network Computing and Applications (NCA’04) 0-7695-2242-4/04 $ 20.00 IEEE