WestminsterResearch http://www.wmin.ac.uk/westminsterresearch WapMetrics: a tool for computing UML design metrics for Web applications. Emad Ghosheh Sue E. Black School of Electronics and Computer Science
Copyright © [2009] IEEE. Reprinted from the IEEE/ACS International Conference on Computer Systems and Applications (AICCSA 2009). IEEE, pp. 682-689. ISBN 9781424438075. This material is posted here with permission of the IEEE. Such permission of the IEEE does not in any way imply IEEE endorsement of any of the University of Westminster's products or services. Personal use of this material is permitted. However, permission to reprint/republish this material for advertising or promotional purposes or for creating new collective works for resale or redistribution to servers or lists, or to reuse any copyrighted component of this work in other works must be obtained from the IEEE. By choosing to view this document, you agree to all provisions of the copyright laws protecting it.
The WestminsterResearch online digital archive at the University of Westminster aims to make the research output of the University available to a wider audience. Copyright and Moral Rights remain with the authors and/or copyright owners. Users are permitted to download and/or print one copy for non-commercial private study or research. Further distribution and any use of material from within this archive for profit-making enterprises or for commercial gain is strictly forbidden.
Whilst further distribution of specific materials from within this archive is forbidden, you may freely distribute the URL of the University of Westminster Eprints (http://www.wmin.ac.uk/westminsterresearch). In case of abuse or copyright appearing without permission e-mail
[email protected].
WapMetrics: a tool for computing UML Design Metrics for Web Applications Emad Ghosheh University of Westminster Department of Information and Software Systems London HA1 3TP, UK
[email protected]
Abstract
in choosing between different designs based on the maintainability of the design. Thirdly, by identifying the risky components of a system since some studies show that most faults occur in only few components of a software system [12, 28]. Fourthly, by establishing design and programming guidelines for software components. This can be done by establishing values that are acceptable or unacceptable and taking action on the components with unacceptable values. This means providing a threshold of software product metrics to provide an early warnings of the system [11]. Fifthly, by making system level prediction where the maintainability of all components can be predicted by aggregating maintainability of single components. This can be used to predict the effort it will take to develop the whole software system [11]. Design metrics have been used by [4, 27, 25, 32, 22] for measuring the quality of software systems. This paper describes a tool for computing early metrics from UML class diagrams based on Web Application Extension (WAE) for UML. The remainder of this paper is organized as follows: Section 2 gives a review of web application modeling using UML and discusses related research. Section 3 describes the different components of the WapMetrics tool. Section 4 shows the usefulness and effectiveness of the tool by conducting a case study. Finally, section 5 provides some conclusions and describes future work to be undertaken.
Many companies are still asking how to assess and predict the maintenance cost of their software. Measures of software maintenance cost can be taken either late or early in the development process. Early measures of software maintenance cost are beneficial because they can help in allocating project resources efficiently, predicting the effort of maintenance tasks and controlling the maintenance process. This paper describes a tool for computing early metrics from UML class diagrams based on the Web Application Extension (WAE) for UML. A case study is used to show the usefulness and effectiveness of the tool. Keywords: Web applications, metrics, maintainability, UML.
1
Introduction
It has been measured that in the maintenance phase software professionals spend at least half of their time analyzing software to understand it [10]. In addition, the cost of software maintenance accounts for a large proportion of the overall cost of a software system [33]. It is very important for companies to assess and predict the maintenance cost of their software. In this paper a tool called WapMetrics for measuring UML design metrics for web applications is introduced. WapMetrics provides an automated way to measure UML metrics and has the ability to show the results in different output formats. We decided to use UML design metrics rather than source code metrics for measuring maintainability as many studies have shown that early metrics are much more useful [5, 7]. Design metrics can be useful in the following ways. Firstly, by predicting the maintenance effort and cost of maintenance tasks which helps by providing accurate estimates that can help in allocating the correct project resources to maintenance tasks [13]. Secondly, by comparing design documents which can help
978-1-4244-3806-8/09/$25.00 © 2009 IEEE
Sue Black University of Westminster Head of Department of Information and Software Systems London HA1 3TP, UK
[email protected]
2 2.1
Background & Related Work Web Application Modeling using the Unified Modeling Language(UML)
Modeling is a technique used to represent complex systems at different levels of abstraction, and helps in managing complexity. UML is an object-oriented language [9] that can be used to model object-oriented systems. Web applications are not inherently object-oriented, therefore, it is
682
Authorized licensed use limited to: University of Westminster. Downloaded on March 11,2010 at 06:10:37 EST from IEEE Xplore. Restrictions apply.
difficult to use UML to model web applications, but UML has now been enhanced with extensions to capture the various elements of web applications. Conallen proposed an extension of UML for web applications [9], The important elements of Conallen’s model are as follows: [9]:
They are categorized into the following categories: Size metrics(NServerP, NClientP, NWebP, NFormP, NFormE), Complexity metrics (NLinkR, NSubmitR, NBuildsR, NForwardR, NIncludeR), Coupling metrics(WebControlCoupling, WebDataCoupling), Reusability metrics(WebReusability). All the metrics are direct metrics except for WebControlCoupling, WebDataCoupling, and WebReusability which are indirect metrics. All these metrics were defined in the authors previous study [17], while the following (NC, NA, NM, NAssoc, NAgg) metrics were defined in the study carried by Genero [14] on class diagram metrics for object oriented applications. We have used the metrics in several studies: In [17] the pet store web application version 1.3.1 was used. The pet store web application is available at the Sun web site [2]. It is a sample application that provides customers with online shopping. A customer can browse the pet store site, look at the catalog and add shopping items to the shopping cart. The pet store application is an example of a typical e-commerce web application. The subjects were taking a summer course in 2006 at the Information Technology department at the university of Illinois. We used two sub-characteristics of maintainability, understandability time and modifiability time to measure maintainability. The study showed the usefulness, and simplicity of using the UML metrics in measuring maintainability. In [18] a web application from the telecommunication Operational Support System (OSS) domain is used to study the relationships between the metrics and maintenance effort measured by number of Lines of Code(LOC). The exploratory experiment showed that higher size metrics, higher structural complexity metrics, and higher coupling metrics result in higher maintenance effort
• Web Page: A web page is the primary element of a web application. It is modeled with two separate stereotyped classes, the client page and the server page. The client page contains client side scripts and user interface formatting. The server page contains server methods and page scoped variables. • Relationships: The model defines the following relations between different components: builds, redirects, links, submit, includes, and forwards. The builds relationship is a directional relationship from the server page to the client page. It shows the HTML output coming from the server page. The redirects relationship is a directional relationship that requests a resource from a another resource. The links relationship is an association between client pages and server or client pages. It models the anchor element in HTML. The links relationship can have parameters which are modeled as attributes in the relationship. The submit relationship is a relationship between the form and the server page that processes it. The include relationship is a directional association between a server page and another client or server page. The forward relationship is a directional relationship between a server page and a client or server page. This presents delegating the server request to another page. • Forms: Forms are defined to separate the form processing from the client page. The form element contains field elements. Forms are contained in client pages. Each form submits to a different action page.
2.2
• Components: Components run on the client or server page. ActiveX controls and Applets are examples of components.
Related Work
One of the main concerns of system stakeholders is to increase the maintainability of the software system. Maintainability can be defined as: The ease with which a software system or component can be modified to correct faults, improve performance or other attributes, or adapt to a changed environment [3]. Maintainability can be assessed by measuring some of the sub-characteristics of maintainability such as understandability, analyzability, modifiability and testability. Kiewkanya et al [25] measured maintainability by measuring both modifiability and understandability. In Coleman et al [8] the maintainability has been quantified in the Maintainability Index . The Maintainability Index is measured as a function of directly measurable attributes A1 through An as shown in Equation 1:
• Scriplet: A scriplet contains references to components and controls that are re-used by client pages. • Framesets: A frameset divides the user interface into multiple views each containing one web page. Frames can contain more than one client page, but they must contain at least one client page. • XML: An XML element is a hierarchical data representation that can be passed back and forth between client and server pages. Table 1 shows the different metrics that are used in the WapMetrics tool. The metrics use the different components of Conallen’s model as units of measurement.
683 Authorized licensed use limited to: University of Westminster. Downloaded on March 11,2010 at 06:10:37 EST from IEEE Xplore. Restrictions apply.
Metric Type Size
Structural Complexity
Control Coupling
Data Coupling
Reusability
NC NA NM NAssoc NAgg
Description Total number of server pages (NServerP) Total number of client pages (NClientP) Total number of web pages (NWebP)=(NServerP + NClientP) Total number of form pages (NFormP) Total number of form elements (NFormE) Total number of client scripts components (NClientC) Total number of link relationships (NLinkR)
generating facility that details all the four kinds of metrics data in the XML format. UMP is built on top of Rational Rose and uses the BasicScript language [24]. Fast&Serious [6] estimates the size of a project in terms of source lines of code. Fast&Serious starts by analyzing the class diagrams to determine the estimation method to be used: rough (Fast) or a detailed (Serious) estimation method. This is determined using other UML diagrams such as use cases, sequence diagrams, and state diagrams. Both tools, can only be applied to Rational Rose models. In addition, there is no way to add new metrics without reprogramming the tools. Metrics from XMI [30] measures object oriented metrics from XMI [29] representations. The tool does not support user defined metrics and the results of the measurement can not be exported in an easy to use format. Their approach is similar to our approach in computing UML class diagram metrics from XMI [29] representations. But it is not possible to measure our metrics with their tool. Our tool differs in the type of metrics used, it computes metrics based on Conallen’s model for web applications. In addition, our tool presents the results in the following output formats: XML, pdf, excel, rtf and csv.
Total number of Submit relationships (NSubmitR) Total number of builds relationships (NbuildsR) Total number of forward relationships(NForwardR) Total number of include relationships(NIncludeR) Total number of use tag relationships(NUseTagR) Number of relationships over number of web pages: WebControlCoupling = (NLinkR + NSubmitR + NbuildsR + NForwardR + NIncludeR + NUseTagR )/ NWebP) Number of data exchanged over number of server pages: WebDataCoupling = (NFormE / NServerP ) Number of include relationships over number of web pages: WebReusability = (NIncludeR / NWebP ) Total number of classes Total number of attributes Total number of methods Total number of associations Total number of aggregation relationships
3
It is important to have an automated tool for computing UML metrics from design diagrams. WapMetrics is a web tool that takes UML diagrams in XMI [29] format as input and produces the results in HTML format. The WapMetrics tool has the following features: • WapMetrics tool is independent form the CASE tool used to build the models. It takes an XMI file as input. The XMI file describes the UML model in a standard way. The XMI input allows the exchange of model information in a standard way regardless of the CASE tool used to create the XMI file.
Table 1. Web Application Design Metrics
M = f (A1 , A2 , ...., An )
WapMetrics Tool
• WapMetrics can measure and calculate web application metrics from UML diagrams based on the Conallen model. Most of the other tools concentrate on UML metric for object-oriented applications.
(1)
The measure (M ) is called a Maintainability Index which can differ depending on the attributes being used in the measurement, Fioravanti et al [13] used effort for measuring maintainability. In our research we have used the metrics defined in Table 1 for measuring maintainability of web applications. For the authors previous research on this topic please refer to [21, 15, 17, 18, 20, 19, 16]. There are several UML metric tools that have been built for measuring metrics from UML diagrams. UML Metrics Producer (UMP) [26] was developed to measure some early metrics to predict various characteristics at the earlier stages of the software life cycle. UMP measures four categories of UML metrics: model, class, use case and message metrics. UMP is only 1152 lines of code including comments. UMP has a report
• WapMetrics is a web application that can be deployed on a central server and used by many users without installing it on the client machines. This makes it easy to maintain and deploy enhancements to the WapMetrics tool. • An important feature of WapMetrics tool is interoperability. The outcome of WapMetrics is user friendly and easy usable by other tools. WapMetrics allows the output to be exported in several formats: HTML, XML, pdf, excel, rtf and csv. This allows the output
684 Authorized licensed use limited to: University of Westminster. Downloaded on March 11,2010 at 06:10:37 EST from IEEE Xplore. Restrictions apply.
to be used for statistical reporting and the results to be presented in graphs and other formats. The WapMetrics tool architecture is composed of three components: 1. Presentation Component 2. Controller Component 3. Business Component The Presentation Component is responsible for getting the input from the user and displaying the results in HTML. The Controller Components is mainly responsible for communicating back and forth between the Presentation Component and the Business Component. The Business Component is responsible for the parsing and computation of the metrics. Figure 1 shows the architecture components of the WapMetrics tool.
Figure 2. WapMetrics MainScreen
Figure 3. WapMetrics Results Screen model in XML [29] format. Many UML design tools are able to export their design to the XMI format which makes the tool interoperable with a wide range of UML design tools. The email input allows the user to get an email with the results once processing is done. The user does not need to wait for the processing to complete in case it takes long time. The email input is validated on the client side using JavaScript to make sure the email has the correct format. Figure 3 shows part of the results screen which is implemented using JSP [23] and the display tag [31]. The results screen allows the user to export the result in different output formats. The result can be exported in XML, pdf, excel, rtf and csv formats.
3.2
The controller component is the communication medium between the presentation component and business component. The controller component is implemented totally in Java and provides some validation on the input data. The controller component carries out the validation on the XMI input file to make sure it is well formatted. If it finds errors in the format, it displays an error message to the presentation component, otherwise it passes the data to the business component for further processing.
Figure 1. WapMetrics Tool Architecture
3.1
Controller Component
Presentation Component
The presentation component provides the user interface for starting the WapMetrics tool. The presentation component has been implemented with Java, JSP, JavaScript, HTML and stylesheets. Figure 2 shows the main screen which has two inputs: XMI [29] input and email input. The XMI input is the input file that contains the design of the
3.3
Business Component
The business component is the main component of the application. It is responsible for the extraction, analysis and
685 Authorized licensed use limited to: University of Westminster. Downloaded on March 11,2010 at 06:10:37 EST from IEEE Xplore. Restrictions apply.
4.1
display of the results of the metrics computation. The business component is composed of three parts: the parser, metrics processor, and metric computor. The parser is a wrapper of the SAX parser. It extracts the data from the XMI input file and puts the data in object classes. It creates an Array which has all the diagrams as elements. The array is passed to the metric processor which extracts all the diagrams and calls the corresponding method on the metric computor. The metric computor implements the algorithms for computing all the metrics defined in Table 1.
4
Introduction
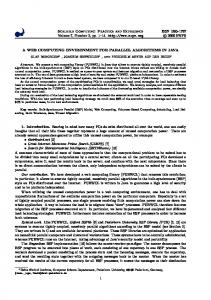
We will use Claros [1]in our case study. Claros is an open source project with the goal of providing an easy to use personal information suite for its users. This case study uses Claros inTouch version 2.1 [1]. Claros inTouch is an Ajax communication suite having the following components: webmail, address, book, post-it notes, calendar, webdisk, built-in instant messenger and rss reader. It is an open source web application using web 2.0 technologies. Figure 4 shows the home screen for Claros which has tabs for the Mail, Contacts, Notes, and chat components. In our study we will use the Contacts component shown in Figure 5. The Contacts component allows the user to add a new contact, save contact, send mail to contact, delete contact and save contact as vCard. The Contacts components stores general information about the user, home address and work address.
Case Study
4.2
Data Collection
The WapMetrics tool takes as input class diagrams in XMI format. Unfortunately, there were no preexisting class diagrams for the Claros web application. So, we decided to set up a running claros web application to help us understand, and reverse engineer the Contacts component of Claros. To run Claros successfully we had to install the following components: Java 1.5 or higher which can be downloaded from the SUN website [2], Tomcat5.x webserver which can be donwloaded from the apache website [1], MySQL for the database which can be downloaded from the MySQL download center [1]. After setting up all the software components, Claros source code was downloaded and added to the web folder in Tomcat. Finally, we started the webserver and opened the home page for the Claros web application. For generating the class diagram for the Claros web application we used IBM Rational Rose Enterprise Edition [24]. Rational Rose has a visual modeling component. It can create the design artifacts of a software system. The Web Modeler component in Rational Rose supports Conallen’s extension for web applications. The Web Modeler component was used to generate the class diagram for the Contacts components in the Claros web application. Appendix Figure 6 shows the class diagram for the Contacts component. The generated class diagram was validated by comparing the running Claros web application and the source code with the class diagram. After the class diagram was validated, Unisys Rose XML [24] was used to export the UML class diagrams into XML Metadata Interchange (XMI) [29]. The WapMetrics tool was used to compute the metrics defined in Table 1 from the XMI input file.
Figure 4. Claros Home Screen [1]
Figure 5. Claros Contacts Screen [1]
686 Authorized licensed use limited to: University of Westminster. Downloaded on March 11,2010 at 06:10:37 EST from IEEE Xplore. Restrictions apply.
4.3
• Lines of Code Changed: The total number of lines added and deleted during a maintenance task is used to measure maintainability. We have conducted several case studies to show the relationship between our metrics and Lines of Code Changed.
Results Metric Name NServerP NClientP NWebP NFormP NFormE NClientC NLinkR NSubmitR NbuildsR NForwardR NIncludeR NUseTagR WebControlCoupling WebDataCoupling WebReusability NC NA NM NAssoc NAgg
Value 4 1 5 1 36 19 7 1 1 0 3 0 2.4 9 0.6 14 60 130 26 2
• Fault-Proneness: Fault-proneness is defined as the probability of detecting a fault in a UML class diagram. We have conducted case studies using open source web applications to study the relationship between our metrics and fault-proneness. We are using statistical analysis to determine the relationship between our metrics and the different maintainability measurements defined above. In the development process the software analyst can allocate more resources for those class diagrams that have high maintenance cost.
5
Conclusion and Future Work
Web applications have evolved into complex applications that have high maintenance cost. The high cost is due to the inherent characteristics of web applications, to the rapid evolution of the Internet, and to the pressing market which imposes short development cycles and frequent modifications. In order to control the maintenance cost of web applications, we have defined several design metrics for web applications as shown in Table 1. We also have conducted several empirical case to show the usefulness of the metrics [15, 17, 18, 20, 19, 16]. Our main goal in this paper is to show how the WapMetrics tool can be used to compute UML design metrics for web applications. We provide an automated way for measuring the metrics from UML class diagrams so that project managers, team leaders and developers can have an early warning on any delays or potentially risky software components. This study has introduced WapMetrics, a tool for measuring UML design metrics for web applications. The tool has been validated through a case study showing the usefulness of the tool. The results give a first indication of the usefulness of the WapMetrics tool. In the future, we will consider extending our tool to compute user defined metrics. We will carry out further testing and validation and provide the source online for the benefit of the research community.
Table 2. Claros Contacts Component Results Table 2 shows the results of applying the WapMetrics tool on the class diagram shown in Figure 6. Our results have been validated by computing the metrics manually from the class diagrams and comparing the output to results from the WapMetrics tool. As shown in Table 2 the Contacts component has four server pages (NServerP). The number of form elements (NFormE) is thirty six which is quite high for a single form page. The number of client components (NClientC) is nineteen. This is expected since Claros is an Ajax application and uses a lot of Javascript. The number of methods and attributes in the controller, model and service classes is also high. The Claros Contacts component has many classes with sixty attributes and one hundred and thirty methods. This means that there is a considerable amount of development effort needed on the Java side of the Contacts component. The metrics results from WapMetrics were as expected since the Contacts component is one of the biggest components in Claros. In our research the metrics are used to measure maintainability using:
References
• Understandability and Modifiability: Maintainability is measured using two important characteristics of maintainability namely understandability and modifiability. We have conducted several empirical studies to show the relationship between our metrics and understandability time and modifiability time.
[1] Claros. Website. http://www.claros.org/web/ home.do. [2] Sun. Website. http://www.java.sun.com. [3] P. Bhatt, G. Shroff, and A. Misra. Dynamics of software maintenance. ACM SIGSOFT Software Engineering Notes, 29(4):1–5, 2004.
687 Authorized licensed use limited to: University of Westminster. Downloaded on March 11,2010 at 06:10:37 EST from IEEE Xplore. Restrictions apply.
[4] L. Briand, C. Bunse, and J. Daly. A controlled experiment for evaluating quality guidelines on the maintainability of object-oriented designs. IEEE Transactions on Software Engineering, 27(06):513–530, 2001. [5] L. Briand and J. Wurst. Modeling development effort in object-oriented systems using design properties. IEEE Transactions on Software Engineering, 27(11):963–986, 2001. [6] M. Carbone and G. Santucci. Fast&serious: a UML based metric for effort estimation. In 6th ECOOP Workshop on Quantitative Approaches in Object-Oriented Software Engineering, 2002. [7] D. Card, K. El-Emam, and B. Scalzo. Measurement of object-oriented software development projects. Software Productivity Consortium NFP, 2001. [8] D. Coleman, D. Ash, B. Lowther, and P. Oman. Using metrics to evaluate software system maintainability. IEEE Computer, 27(8):44–49, 1994. [9] J. Conallen. Building Web Applications with UML. AddisonWesley, 2 edition, 2003. [10] T. Corbi. Program understanding: challenge for the 1990s. IBM Systems Journal, 28(2):294–306, 1989. [11] K. EL-Emam. A methodology for validating software product metrics. Technical Report NRC 44142, National Research Council Canada, 2000. [12] N. Fenton and N. Ohlsson. Quantitative analysis of faults and failures in a complex software system. IEEE Transactions on Software Engineering, 26(8):797–814, 2000. [13] F. Fioravanti and P. Nesi. Estimation and prediction metrics for adaptive maintenance effort of object-oriented systems. IEEE Transactions on Software Engineering, 27(12):1062– 1084, 2001. [14] M. Genero, M. Piattini, and C. Calero. Empirical validation of class diagram metrics. In Proceedings of the 2002 International Symposium on Empirical Software Engineering, pages 195–203. IEEE Computer Society Press, 2002. [15] E. Ghosheh and S. Black. An introduction of UML design metrics for web applications. In Proceedings of the Annual Mphil-PhD Research Workshop, pages 38–41. Harrow School of Computer Science University of Westminster, 2007. [16] E. Ghosheh and S. Black. Empirical validation of UML class diagram metrics through an industrial case study. Journal of Electronics & Computer Science (JECS), 10(4):63–74, 2008. [17] E. Ghosheh, S. Black, and J. Qaddour. An introduction of new UML design metrics for web applications. International Journal of Computer & Information Science, 8(4):600–609, 2007. [18] E. Ghosheh, S. Black, and J. Qaddour. Design metrics for web application maintainability measurement. In Proceedings of the 6th IEEE/ACS International Conference on Computer Systems and Applications, pages 778–784. IEEE Computer Society Press, 2008. [19] E. Ghosheh, S. Black, and J. Qaddour. A general evaluation criteria for web applications maintainability models. In Proceedings of the IEEE Region 5 Technical, Professional, and Student Conference, pages 1–6. IEEE Computer Society Press, 2008.
[20] E. Ghosheh, S. Black, and J. Qaddour. An industrial study using UML design metrics for web applications. In Computer and Information Science, volume 131 of Studies in Computational Intelligence, chapter 20, pages 231–241. Springer-Verlag, 2008. [21] E. Ghosheh, J. Qaddour, M. Kuofie, and S. Black. A comparative analysis of maintainability approaches for web applications. In Proceedings of the 4th IEEE/ACS International Conference on Computer Systems and Applications, page 247. IEEE Computer Society Press, 2006. [22] T. Gymothy, R. Ferenc, and I. Siket. Empirical validation of object-oriented metrics on open source software for fault prediction. IEEE Transactions on Software Engineering, 31(10):897–910, 2005. [23] M. Hall. Core Servlets and Java Server Pages. Upper Saddle River, 1 edition, 2000. Rational Rose Enterprise Edition. Web[24] IBM. site. http://www-306.ibm.com/software/ awdtools/developer/rose/index.html. [25] M. Kiewkanya, N. Jindasawat, and P. Muenchaisri. A methodology for constructing maintainability model of object-oriented design. In Proceedings of the 4th International Conference on Quality Software, pages 206–213. IEEE Computer Society Press, 2004. [26] H. Kim and C. Boldyreff. Developing software metrics applicable to UML models. In Proceedings of QAOOSE’2002. QAOOSE 2002, 2002. [27] M. Mario, E. Manso, and G. Cantone. Building UML class diagram maintainability prediction models based on early metrics. In Proceedings of the 9th International Software Metrics Symposium, pages 263–278. IEEE Computer Society Press, 2003. [28] K.-H. Moller and D. Paulish. An empirical investigation of software fault distribution. In Proceedings of the 4th International Software Metrics Symposium, pages 82–90. IEEE Computer Society Press, 1993. [29] OMG. Xml Metadata Interchange. Website. http:// www.omg.org/. [30] T. Paterson, C. Russell, and R. Dewar. Object-oriented software design metrics from XMI. Technical Report HWMACS-TR-0008, School of Mathematical and Computer Sciences, Heriot-Watt University, Edinburgh, Scotland, UK, 2003. [31] O. Source. Display tag. Website. http://displaytag. sourceforge.net/11/. [32] R. Subramanyam and M. Krishnan. Empirical analysis of ck metrics for object-oriented design complexity: Implications for software defects. IEEE Transactions on Software Engineering, 29(04):297–310, 2003. [33] N. Wilde and R. Huitt. Maintenance support for objectoriented programs. IEEE Transactions on Software Engineering, 18(12):1038–1044, 1992.
6
Appendix
688 Authorized licensed use limited to: University of Westminster. Downloaded on March 11,2010 at 06:10:37 EST from IEEE Xplore. Restrictions apply.
Figure 6. Claros Contacts Class Diagram
689 Authorized licensed use limited to: University of Westminster. Downloaded on March 11,2010 at 06:10:37 EST from IEEE Xplore. Restrictions apply.