Str. 120
Rynek Energii
Nr 3(112) - 2014
WEB SERVER'S PERFORMANCE PREDICTION WITH USING SPATIAL ECONOMETRIC METHODS Leszek Borzemski, Anna Kamińska-Chuchmała Key words: Web performance, smart metering, spatial prediction, spatial econometric methods Summary. In this paper spatial econometric methods were applied in the important real-life performance prediction problem. The authors use these methods to create spatial econometric models for Web server’s performance prediction. Data for prediction were obtained from active measurement experiment performed by MWING system. The analysis of results and impact of various factors on the accuracy of prediction were conducted. In conclusions the perspective use of econometric methods in considered field is summarized and future plans of research were given.
1. INTRODUCTION Recently, the more attention should be pay on Web server’s performance, because of increased use of Internet network. Web prevalence in both, the business and social communication significantly increased network traffic and thus affect the performance of Web servers. It becomes possible to use the Internet in communication, such as smart metering to sending data from smart meter of end-user to network operator’s. This allows the storage of these data in network operator’s Web servers. Thus, it appears that the issue of analyzing performance of such Web servers is of significant importance. Especially the performance of given Web server should be predicted. For such prediction spatial methods like spatial econometric methods are necessary. Thanks to them one can say about autocorrelation between spatial data and how they are diverse. It will be helpful in analyzing future demand of Web server. In this paper the Web server’s performance prediction was conducted with spatial econometric methods. Next section include the description of these methods. After that the measurement experiment was discussed from which the data base was created. The following section contains analyzes of input data. Next, models of Web server’s predictions and results are given, followed by the conclusions section.
2. SPATIAL ECONOMETRIC METHODS Spatial econometrics is an young domain formulated in 1970s, which can be divided into two groups [1]: spatial dependence (or autocorrelation) and spatial heterogeneity. Moreover the characteristic features of spatial econometric methods are: the asymmetry in spatial relations, the importance of explanatory factors located in other spaces, the role of spatial interdependence in spatial models, and differentiation between ex post and ex ante interaction and explicit modeling of space [2]. A standard ordinary least squares regression
(Classic Regression Model CRM) has the following form: y x ,
(1)
where y are dependent variables, x are independent variables, β is model’s coefficient and is a random component. If is decomposed into a spatially lagged term for the dependent variable – which is correlated with the dependent variable – and an independent error term: wy ,
(2)
then the formulation for spatially lagged dependent variables could be written: y x wy
(3)
where ρ is autoregressive parameter, w is the weight matrix and ~ N(0,σ2I). This equation wrote in matrix notation is named Spatial Lag Model (SLM) or Spatial Autoregressive Model (SAR). If, however, we specify this differently: ( I w) ,
(4)
where I is the identity matrix, we get: y x ,
(5)
which is a spatial error formulation called Spatial Error Model (SEM), where ξ is a random component, λ is a parameter of model and ~ N(0,σ2I). These methods together with neighborhood matrix could give a very good estimation of considered regression models. Additionally spatial econometric methods give a possibility to see heterogeneity of spatial data and their autocorrelation. Therefore, authors propose to use spatial econometric methods to research Web server's performance. This kind of research requires spatial methods of analysis of such data.
Nr 3(112) - 2014
Rynek Energii
Currently, to the best of authors knowledge the spatial econometrics approach to Web performance prediction as presented in this paper is unique, leaving no similar problem statement in the literature.
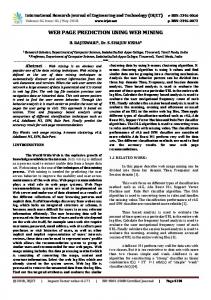
3. MWING EXPERIMENT The data for research was obtained in active experiments performed by the Multiagent Internet Measurement System (Multi agent Web pING - MWING) developed in author’s Institute [3,4]. In this experiment Web transactions issued by HTTP agent located in Wrocław (Poland) and targeting Web servers in Europe (see figure 1) were monitored.
Fig 1. An active measurement experiment - MWING
Agent was in academic campus of Wrocław University of Technology. Web performance was measured by total downloading time of rfc1945.txt file, which size was 138 kB. The database contains the information about a server's geographical location which the agent targeted, the web performance index which is the total downloading time of rfc1945.txt file, and the timestamp of taking a measurement. The measurements were done between 3th and 16th of December 2012 and they were taken every day at the same time at the hour from 6:00 a.m. to 10:00 p.m.
Str. 121
6 seconds only with one exception for 05 p.m. Variance equals about 2 provides only slightly changeability through the examined data. Minimum time of download file equals 0s indicates on moments with lack of communications between agent in Wrocław and given Web server in Europe. It could be caused by problems with packages on trace or with overloading Web server. Table 1 Fundamental statistics of download times from Web servers between 3-16.12.2012 for particularly hours Hour Mean, Max, s Min, St. VaSkews s Dev. riance ness s s2 06 a.m. 1.48 20.65 0 2.55 6.49 4.56 07 a.m. 1.42 15.09 0 1.94 3.77 3.69 08 a.m. 1.28 4.98 0 1.42 2.02 1.61 09 a.m. 1.24 5.09 0 1.40 1.95 1.81 10 a.m. 1.35 5.78 0 1.44 2.09 1.63 11 a.m. 1.37 5.81 0 1.47 2.15 1.66 12 a.m. 1.28 5.00 0 1.42 2.02 1.68 01 p.m. 1.28 5.15 0 1.40 1.97 1.69 02 p.m. 1.33 5.49 0 1.45 2.09 1.64 03 p.m. 1.34 5.25 0 1.44 2.08 1.54 04 p.m. 1.36 6.14 0 1.43 2.05 1.56 05 p.m. 1.42 12.69 0 1.66 2.77 2.44 06 p.m. 1.36 5.81 0 1.45 2.10 1.49 07 p.m. 1.44 5.77 0 1.52 2.32 1.42 08 p.m. 1.40 5.35 0 1.46 2.14 1.41 09 p.m. 1.82 15.92 0 2.87 8.26 3.42 10 p.m. 1.74 26.43 0 3.14 9.88 5.04
Considering the hourly variability of Web servers performance in Europe it can be seen some outliers as Web servers. This situation is well illustrated in fig. 2.
4. DATA ANALYSIS The input data presented in table 1 were characterized by significant variability for particularly hours. Especially for border hours in morning: 06 a.m. and 07 a.m. and evening: 09 p.m. and 10 p.m. For example at 06 a.m. maximum value of download times of the text file from Web servers in Europe was equal 20.65s, where mean download time was equal only 1.48s. The larger dispersion of data was visible at 10 p.m., where difference between maximum and mean values was equal to 24.69s. In addition, high value of skewness coefficient (between 3 to 5) prove the changeability of the examined process and indicates big right side asymmetry of performance distribution for boundary moment of measurement. The measurements from 08 a.m. to 08 p.m. had moderate values where maximum were equal between 5 to
Fig.2. Cartogram of total download time for 6th December 2012 at 07 a.m.
This is a cartogram of total download file for 07 a.m. in 6th December 2012. This day in morning was high changeability through Web server performance: the half of research servers had too long time for response or did not answer to agent from Wrocław.
Str. 122
Rynek Energii
Bivariate Moran's I statistics were conducted to verify input data for prediction. In figure 3 is presented Moran’s I statistics between exemplary days 12th and 13th December 2012 for 09 a.m. Analysis of results points out the positive autocorrelation in input data is very small - only 0.056. During research autocorrelation between other days is similarly close to zero. These results from Moran's statistics indicates the large heterogeneity among Web servers for particularly days in given database.
Fig.3. Bivariate Moran's I statistics between 12th and 13th December 2012 for 09:00 a.m.
5. WEB SERVER'S PERFORMANCE PREDICTION WITH USING SPATIAL ECONOMETRIC METHODS Three types of models were used to predict the total download time of file from Web servers: CRM, SLM and SEM. Prediction was calculated with one day advance, i.e. on 16th December 2012 for hours from 06 a.m. to 10 p.m. Models assumed, that dependent variable was a day, which we want to predict and independent variables were the days of history in database (from 3th to 16th December 2012). To create matrix weights Euclidean distance was used. Threshold distance was equal 13.41º and variables for x and y coordinates was assumed as centroids. All predictions were performed with using OpenGeoDa software [5]. For comparison accuracy of prediction for used methods, in table 2 average prediction error for all considered hours are presented. One can see, that the best method for most predicted hours was SLM, only with exception for 11 a.m., 04 p.m., 06 p.m. and 09 p.m., where CRM method was better. However, that difference in prediction errors was equal between 0.3% to 5%. The high prediction error for 06 a.m. and 09 p.m.
Nr 3(112) - 2014
is consequence of high skewness of input data for this hours. On the other hand, very interesting situation is for 07 a.m. and 10 p.m., where despite of high changeability of data, the methods in quite good accuracy could predict future performance of Web servers.
Hour 06 a.m. 07 a.m. 08 a.m. 09 a.m. 10 a.m. 11 a.m. 12 a.m. 01 p.m. 02 p.m. 03 p.m. 04 p.m. 05 p.m. 06 p.m. 07 p.m. 08 p.m. 09 p.m. 10 p.m.
CRM 30.23 6.73 38.53 4.60 8.65 16.14 1.80 7.19 2.49 17.74 5.04 12.17 4.47 15.21 8.27 10.93 6.61
Table 2 Average percentage prediction error for all considered methods SLM SEM 29.22 30.31 5.79 9.86 17.39 38.56 3.93 3.77 6.29 16.12 21.13 40.00 0.60 2.21 4.20 10.01 2.36 2.51 6.26 25.01 5.70 32.15 11.27 15.19 7.81 6.63 3.33 16.74 2.26 22.96 11.22 15.67 5.32 6.61
For better analyzing, in figure 4 average predictions error for all hours in 16th December 2012 for CRM, SLM and SEM methods are presented.
Fig.4. Comparison prediction of accuracy for CRM, SLM and SEM methods
From figure 4, it is easy to see that the most of hours SLM method had the best accuracy of prediction. Significant impact on the accuracy of prediction have a behavior particularly of Web server. In figure 5 is presented Web server in Budapest (Hungary), which have the most unpredictable total download time of file
Nr 3(112) - 2014
Rynek Energii
from whole database during this considered two weeks of December.
Str. 123
predicted download times of Web servers in 16th December 2012 at 10 p.m.
Fig.7. Unique map of download time values from the Web server on 16.12.2012 at 10:00 p.m. determined with SLM Fig.5. Download time of file during two weeks between 06 a.m. to 10 p.m. for exemplary server in Budapest
Fig.6. Download time of file during two weeks at 08 a.m. for exemplary server in Brussels
Download time of file varied between 0 to almost 16 seconds. Moreover as one could see in figure 5, there are repeated daily behavior of this servers with one unpredictable peak in 6th December 2012. It is worth for considering and future research on the periodicity the Web servers and its influence on accuracy of prediction. In order to analyze the variability of Web server, in figure 6 is presented exemplary Web server from Brussels (Belgium) with total download time of file at 08 a.m. each day during the period 3-16.12.2012. Considering hourly behavior of Web servers, one could also claim that there is some periodicity situation. It is clearly seen from figure 6, that on Thursdays 6th and 13th December 2012 there were long time of response from this server (in contrary to other days), first time above 3 s and second time almost 2.5 s. Additionally, at the beginning of the week download time of file is stable and equal below 1 second. For better comparison of various behavior of all considered Web servers in Europe, in figure 7 are presented
Fig.8. Scatter diagram for 16th December 2012 at 04 p.m. made by SLM
The most loads of Web server were in Eindhoven (Holland) and Porto (Portugal), but also in Budapest (Hungary). Prediction error of forecast determined with SLM for presented in figure 7 results at 10 p.m. was equal 2.26%. The scatter diagram for day of prediction presented in figure 8 was computed by SLM. The average prediction error was equal 5.70%. Comparison of real and predicted values in scatter diagram confirmed the correctness of prediction. Only the values above 1 seconds had some outliers like unpredictable peaks during download file.
6. CONCLUSIONS In this paper spatial Web servers performance was research. The approach for predicting Web performance with using spatial econometric methods: CRM, SLM and SEM was proposed. Presented results indi-
Str. 124
Rynek Energii
cate how varied is behavior of Web servers and whole Internet, thus how difficult is prediction of such phenomenon. However econometric methods presented in paper could be helpful to prediction Web server performance and for spatial analysis of Internet and Web performance. The predictions were obtained with good accu-
Nr 3(112) - 2014
racy. Authors in their previous works [6], [7] were used geostatistical methods for spatial predictions of Web server performance. In future research it could be valuable research, which would consider the matching of accuracy and autocorrelation research from econometric methods and spatio-temporal predictions with random factor from geostatistical methods.
REFERENCES [1] Anselin L., Spatial Econometrics: Methods and Models, Kluwer Academic Publishers, Dordrecht, (1988) [2] Paelinck J.H.P., Klaassen L.H., Spatial Econometrics, Farnborough, Saxon House, (1979) [3] Bor zemski L., The Experimental Design for Data Mining to Discover Web Performance Issues in a Wide Area Network, Cybernetics and Systems: An International Journal, (2010), No. 41, 31-45 [4] Bor zemski L., Cichocki l., Kliber M., Fr as M., Nowak Z., MWING: a Multiagent System for Web Site Measurements, Lecture Notes in Computer Science, (2007), No. 4496, 278-287 [5] https://geodacenter.asu.edu [6] Bor zemski L., Kamińska -Chuchmała A., Distributed Web Systems Performance Forecasting Using Turning Bands Method, IEEE Transactions on Industrial Informatics, (2013), Vol. 9, Issue 1, 254-261 [7] Kamińska -Chuchmała A. , Performance of Internet Network Forecast and the Perspective of Application in Smart Metering Communications, Rynek Energii, 2012, No. 3(100), 39-43
PREDYKCJA WYDAJNOŚCI SERWERÓW WEBOWYCH Z WYKORZYSTANIEM PRZESTRZENNYCH METOD EKONOMETRYCZNYCH Słowa kluczowe: wydajność sieci Web, inteligentne opomiarowanie, przestrzenna prognoza, metody ekonometrii przestrzennej. Streszczenie. W pracy zastosowano metody ekonometrii przestrzennej do problemu predykcji wydajności serwerów webowych. Dane do obliczeń pozyskano z aktywnego eksperymentu pomiarowego opartego na systemie MWING. Przeprowadzono analizę wykonanych prognoz oraz rozpatrzono wpływ różnych czynników na dokładność prognozy. We wnioskach przedstawiono perspektywę dalszych możliwości zastosowań metod ekonometrii przestrzennej do badania wydajności sieci Internet. Leszek Borzemski, dr hab. inż., prof. nadzw. PWr, z-ca dyrektora Instytutu Informatyki i kierownik Zakładu Rozproszonych Systemów Komputerowych Instytutu Informatyki na Politechnice Wrocławskiej, e-mail:
[email protected] Anna Kamińska-Chuchmała, dr inż., adiunkt w Zakładzie Rozproszonych Systemów Komputerowych Instytutu Informatyki Politechniki Wrocławskiej; e-mail:
[email protected]