It is a complete system composed of software on PC and hardware connected to .... What does 'data storage qualification'
What is LOG Storm and what is it useful for? LOG Storm is a high-speed digital data logger used for recording and analyzing the activity from embedded electronic systems digital bus and data lines. It records long traces of data - actually collecting digital bus activity during hours or days - and extracts specific functional events occurring on embedded systems.
What is a 'high-speed digital data logger'? By definition, a 'data logger' (or 'data recorder') is a device that 'records data over time'. The nature of 'data' can be a physical value representing temperature or humidity, pressure, or any kind of 'data'. For LOG Storm, the 'data' are the bits and bytes on digital busses and logic lines of electronic embedded systems. LOG Storm implements a sampling mechanism, recording one digital value each period of its sampling frequency. In this regard, the basic mechanism of collecting elementary data is comparable to this of a logic analyzer. The terms 'data logger' and 'data acquisition' (DAQ) are often used interchangeably. Historically, data loggers have been stand-alone devices equipped with their own power supply (e.g. batteries) and a local storage capability. On the other hand, 'data acquisition' devices seem to be systematically associated to a PC, where the PC is used to configure and control the DAQ device and to receive, store and analyze the acquired data. Today, these boundaries are tending to blur. Some data loggers are even just software applications used, for instance, to record the activity from a communication port such as the Ethernet network adapter of the PC. Historically, 'data loggers' have utilized slow sampling rates - in the range of hertz and kilohertz. But LOG Storm is a 'high-speed digital data logger': - it samples data at up to 100 MHz - hence the 'high-speed' qualification - it records the activity from embedded electronic systems bus and digital line - as a data logger, it records this data over time - even during hours and days Actually, LOG Storm does not just 'acquire data'. It is a complete system composed of software on PC and hardware connected to the PC's USB port.
The combination of dedicated hardware and software on PC is the key to its unique benefits.
Byte Paradigm - Product paper - 2014 - v.2.00
Page 1
LOG Storm data logger collects digital bus traffic in order to troubleshoot embedded systems. Making sure that an embedded system board works properly is basically a careful investigation process. Understanding why an electronic board may be failing is difficult because such systems mix high complexity with limited visibility. Typical embedded systems make use of at least one microcontroller. As long as the functionality of such systems relies almost exclusively on the execution of software code, the debug process is essentially a matter of software tracing. With a good software emulator, tracing and troubleshooting the code can be very efficient. For most embedded systems, however, things get more complex because of the mix of components, which do not offer the level of visibility of a microcontroller. Hence, a typical embedded system is characterized by highly observable areas and others where what is actually happening is less clear.
Direct control from software Software-observable / accessible. Hardware probing is useful to check sequence and timings of events.
Indirectly observable from CPU / software by checking memory contents.
Non software-observable. Probing and history are useful for detecting the origin of bugs. Probing can reveal issues with peripherals, coprocessors or a bug in the CPU software. Specific FPGA firmware can be used for debug. Past surveys we have taken with engineers show that software emulators and oscilloscopes are chosen first for gaining initial visibility on digital embedded systems. Logic analyzers come in as a third choice. According to the same study, logic analyzers are not commonly available on an engineer's desk - essentially for cost saving reasons. One interesting result shows that even if engineers have a logic analyzer or can afford one, they report that this type of equipment is sometimes of little help. This is specifically the case when a functional bug is the result of a long sequence of events that mixes software- and non-software-observable parts of the embedded system. A logic analyzer simply
Byte Paradigm - Product paper - 2014 - v.2.00
Page 2
cannot record the complete history of events that has generated the observed bug. For that reason, the engineers we surveyed relied on less expensive equipment. They proceed their debug efforts by successive iterations of customized debug software.
In other words, embedded engineers mainly use software emulation and scopes because logic analyzers can be expensive AND do not always solve a very common problem: the need to understand the history of a specific event that occurs in an embedded system. The key for this understanding is recording sufficient relevant data. To illustrate this, we'll sketch an 'extreme' example that shows the fundamental differences between a logic analyzer and digital data logger. Let's assume that we suspect 'something wrong' happens 'sometimes' on a digital bus. This bus is shared by multiple components, each of them being addressed with specific messages. In the figure below, the color of the message designates a different destination component attached to the bus. After some general debugging, we come to the conclusion that a 'problematic message' (marked in red) happens sometimes after a yellow message. We have no idea when this occurs and we have no idea what this message is. Yellow, orange and blue messages are generated with our functional code, and hence, we are able to recognize them.
Case 1: Logic Analyzer Sampling Data
Rearming trigger
Sampling Data
Rearming trigger
Sampling Data
Rearming trigger
Problematic message is not seen Data is sampled until the LA memory is full (zones with green background). The bus is sampled even if there is no traffic on it. It is assumed that a problematic message occurs after 'yellow' message types. LA trigger is set to detect 'yellow messages'. Trigger is rearmed by software, after a recovery time. The 'problematic message' (red) is not seen because it occurs while the logic analyzer is re-arming its trigger.
Case 2: Digital Data Logger Sampling occurs when there is activity on the bus
Problematic message is detected Data is sampled only when bus is active. This extends the device storage capabilities. Sampling Start/Stop is managed by hardware (cycle-accurate / no recovery time)
Byte Paradigm - Product paper - 2014 - v.2.00
Page 3
In a second step, with a more precise start condition and an extended storage buffer, the digital data logger also allows viewing the timings of the faulty sequence.
By using a data storage qualifier (data filtering) and not just a trigger and a sampling window, a digital data logger is able to overcome the limitations of most logic analyzers1. From the above illustration, we can conclude that finding a specific event in a long sequence requires both a large storage capability AND the ability to qualify which data has to be stored. Such capabilities enable a better understanding of the history of events that have generated a functional bug. This allows to progressively narrow the search for the origin of the bug.
What does 'data storage qualification' mean for LOG Storm? This basically means that LOG Storm is able to filter the digital data of the bus being sampled. LOG Storm actually defines 2 ways of selecting the data that has to be recorded, illustrated on the right. 'Fixed length' trigger defines a START trigger condition and a capture length. LOG Storm starts recording data upon the detection of the START condition and collects the specified number of samples. After this, it waits until it detects a new START condition. Events occurring before the START condition can be recorded too, by defining a PREFETCH length. In addition, expressions defining which data is to be recorded can be setup (green area on the figure).
'Variable length' trigger does not define a capture length, but a STOP condition and optionally a POSTFETCH length. LOG Storm data logger stops after the POSTFETCH length and waits until a new START condition. Similarly to the fixed length trigger, a data capture condition can be defined.
1
This example refers to typical equipment. Some high end logic analyzers also have data storage qualification options. To be complete, we must also note that some logic analyzers implement compression algorithms on data, enabling them to save on their internal memory in some cases (data-dependent). This extends the total sampling time.
Byte Paradigm - Product paper - 2014 - v.2.00
Page 4
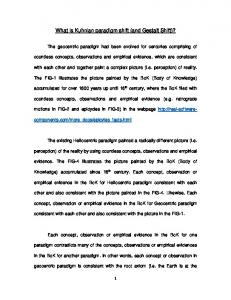
How does LOG Storm work? The bus to be observed is composed of multiple digital lines used for communication between components of an embedded system board. The communication logic lines use a digital standard for the signals - typically: LVCMOS 3.3V. Of all communication traffic, only the red areas have some interest. These areas are defined by a 'logic expression' built on the bus signal lines.
With this 'expression', LOG Storm is able to 'filter' the raw bus data and only collect what is relevant. This is also called 'data storage qualification'. You can choose to use this option or not; if you don't, all the samples are collected - like a logic analyzer.
100 MHz 20 bits
Using data storage qualification can be extremely useful: it reduces the total bandwidth required by LOG Storm; it helps focus on what is really interesting in the data flow. For instance, for functional debug, it is mostly useless to sample a bus when it is IDLE; it saves on memory resources and helps avoid overflow conditions.
LOG Storm is 'always-on'/ 'always recording': qualified data is continuously stored into the local memory buffer used as a FIFO data stored in the memory buffer permanently flows to the host PC through the USB 2.0 interface. data is eventually stored onto the PC hard disk, enabling gigabytes of recorded data.
2 to 8 MSample USB 2.0
Using a sampling speed as high as 100 MHz over long periods of time will quickly generate gigabytes of data. The actual throughput of a USB 2.0 connection can be as high as 20 MByte/s. This is the main bottleneck. To overcome this limitation, a 2 MSample or 8 MSample buffer is included in the LOG Storm device, allowing the sampling of large bursts at maximum sampling speed. Data collision can still occur. In such cases, sampled data are simply discarded, and the overflow condition is reported to LOG Storm Studio software. Data recording resumes as soon as space is available again in the LOG Storm memory buffer. Updating data storage qualification with a narrower condition can help overcome frequent overflows.
Byte Paradigm - Product paper - 2014 - v.2.00
Page 5
Data storage qualification can be useful for many purposes - for example:
You are using a specific serial protocol such as SPI, and you would like to monitor all the messages transmitted on this bus. Sampling serial data only when a specific slave select line is active allows you to extract this slave's specific interactions with the SPI master.
You are using a bus that streams data organized in packets. Each packet has a header and a payload, and you suspect that there is something wrong with one header. You just want to monitor the beginning of each packet. Adjusting your filtering option lets you detect the beginning of each packet and collect a limited data quantity from each packet to actually see the packet header
Unlimited data storage and PC-controlled LOG Storm is controlled from PC using a USB 2.0 connection.
This represents an advantage over bench-top and stand-alone instruments since the sampled data is continuously streamed to the PC hard disk and organized into multiple files. Gigabytes of trace digital trace data can be stored, organized and visualized with the help of LOG Storm Studio software. In addition, data can be viewed at bit level with an integrated digital waveform viewer.
Byte Paradigm - Product paper - 2014 - v.2.00
Page 6
Conclusion Through this article, we have shown how useful a high-speed digital data logger can be for troubleshooting complex digital embedded system. Together with software emulators, scopes and other test and debug equipment, LOG Storm offers a compact, no-compromise and easy-to-deploy data logging capability with huge storage capability, high sampling rate and rich data storage qualification capabilities. LOG Storm helps overcoming the limitations of more traditional instruments such as logic analyzers, especially for application requiring the monitoring of long sequences of functional data from digital busses.
Byte Paradigm - Product paper - 2014 - v.2.00
Page 7