What Makes Process Models Understandable? J. Mendling1 , H.A. Reijers2 , and J. Cardoso3 1
Vienna University of Economics and Business Administration Augasse 2-6, 1090 Vienna, Austria
[email protected] 2 Eindhoven University of Technology P.O. Box 513, 5600 MB Eindhoven, The Netherlands
[email protected] 3 University of Madeira 9000-390 Funchal, Portugal
[email protected]
Abstract. Despite that formal and informal quality aspects are of significant importance to business process modeling, there is only little empirical work reported on process model quality and its impact factors. In this paper we investigate understandability as a proxy for quality of process models and focus on its relations with personal and model characteristics. We used a questionnaire in classes at three European universities and generated several novel hypotheses from an exploratory data analysis. Furthermore, we interviewed practitioners to validate our findings. The results reveal that participants tend to exaggerate the differences in model understandability, that self-assessment of modeling competence appears to be invalid, and that the number of arcs in models has an important influence on understandability.
1
Introduction
Even though workflow and process modeling have been used extensively over the past 30 years, we know surprisingly little about the act of modeling and which factors contribute to a “good” process model in terms of human understandability. This observation contrasts with the large body of knowledge that is available for the formal analysis and verification of desirable properties, in particular for Petri nets. To guarantee a certain degree of design quality of the model artifact in a wider sense, several authors propose guidelines for the act of modeling (e.g. [1, 2]) but yet with little impact on modeling practice. Clearly, an empirical research agenda is required for acquiring new insights into quality (cf. [3]) and usage aspects (cf. [4]) of process modeling. Following this line of argumentation, a recent empirical study provides evidence that larger, real-world process models tend to have more formal flaws (such as e.g. deadlocks) than smaller models [5, 6]. One obvious hypothesis related to this phenomenon would be that human modelers loose track of the interrelations of large and complex models due to their limited cognitive capabilities (cf. [7]), and then introduce errors that they would not insert in a small model. There
2
are further factors such as the degrees of sequentiality, concurrency, or structuredness that presumably affect the understandability of a process model [8]. Validating such hypothetical relationships empirically would not only represent a major step forward towards understanding quality of process models beyond verification, but also provide a sound theoretical basis for defining guidelines for process modeling in general.
Process F
Process L Start
Start OR
A
A
B OR
AND
XOR
AND
C
D
XOR
AND
E
F
G
J
H
B
C
D
F
G
H
J
K
L
XOR
K
I
E
I
OR AND
AND
OR
L
XOR
N M
XOR XOR
AND XOR
S
O XOR
T
P U
R
S
V
W
XOR AND
W
O
XOR
XOR
V
N
R
P
Q
T
U
OR
Q XOR
XOR
End
End
M
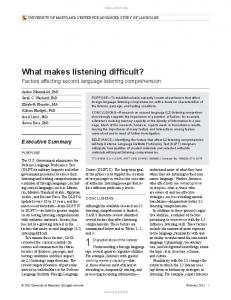
Fig. 1. Proces model F and process model L from the questionnaire
Since only little research has been conducted on quality aspects of process models so far [3], we approach this area with an experimental design focusing on the understandability of process models (not of process modeling languages). By having a questionnaire filled out by 73 students who followed courses on process modeling at the Eindhoven University of Technology, the University of Madeira, and the Vienna University of Economics and Business Administration, we aim to gain insight into empirical connections between personal and model characteristics and the ability of a person to understand a process model properly. Figure 1 shows two process models that were included in the questionnaire. Furthermore, we conducted interviews in order to contrast the findings of the questionnaire with expert opinions. In this context, our contribution is twofold. First, we provide an operationalization of understandability as well as of personal and model related factors that may influence process model understandability. Second, we contribute new findings to the still meagre body of empirical knowledge on process modeling. Against this background, the remainder of the paper is structured as follows. In Section 2 we discuss related work and identify a lack of empirically
3
validated insight on the understandability of process models. Then, Section 3 introduces the research design, i.e. in particular, the conceptualization of the questionnaire, the statistical analysis that can be applied on the acquired data, and the role of the expert interviews. In Section 4 we present the results of the analysis and the interviews. Section 5 concludes the paper, discusses limitations of the findings, and identifies open questions that need to be addressed by future research.
2
Related Work
There are basically three streams of research related to our work in the conceptual modeling area: top-down quality frameworks, bottom-up metrics related to quality aspects, and empirical surveys related to modeling techniques. One prominent top-down quality framework is the SEQUAL framework [9, 10]. It builds on semiotic theory and defines several quality aspects based on relationships between a model, a body of knowledge, a domain, a modeling language, and the activities of learning, taking action, and modeling. In essence, syntactic quality relates to model and modeling language; semantic quality to model, domain, and knowledge; and pragmatic quality relates to model and modeling and its ability to enable learning and action. Although the framework does not provide an operational definition of how to determine the various degrees of quality, it has been found useful for business process modeling in experiments [11]. The Guidelines of Modeling (GoM) [2] define an alternative quality framework that is inspired by general accounting principles. The guidelines include the six principles of correctness, clarity, relevance, comparability, economic efficiency, and systematic design. This framework was operationalized for EPCs and also tested in experiments [2]. Furthermore, there are authors (e.g. [3]) advocating a specification of a quality framework for conceptual modeling in compliance with the ISO 9126 standard [12] for software quality. A respective adaptation to business process modeling is reported in [13]. Our experiments addresses partial aspects for these frameworks. In particular, we focus on understandability of process models as an enabler of pragmatic quality (SEQUAL) and clarity (GoM). This requires us not only to ask about understandability, but also check whether models are interpreted correctly. This is in line with research of Gemino and Wand [14] who experimented on conclusions that people can draw from models. There is several work on bottom-up metrics related to quality aspects of process models, stemming from different research and partially isolated from each other (see [15–23] or for an overview [8]). Several of these contributions are theoretic without empirical validation. Most authors doing experiments focus on the relationship between metrics and quality aspects: Canfora et al. study the connection mainly between count metrics – for example, the number of tasks or splits – and maintainability of software process models [21]; Cardoso validates the correlation between control flow complexity and perceived complexity [24]; and Mendling et al. use metrics to predict control flow errors such as deadlocks in process models [6, 8]. The results reveal that an increase in size of a model
4
appears to have a negative impact on quality. This finding has an impact on the design of our questionnaire. To gain insights that are independent of process size, we keep the number of tasks constant and study which other factors might have an impact on understandability. Finally, there are some empirical surveys related to modeling techniques. In [25] the authors study how business process modeling languages have matured over time. While this is valuable research it does not reveal insights on single, concrete process models. The same holds for [26] who study the usability of UML. In [27] the authors also approach understandability, not of individual process models, but on the level of the modeling language. They find out that EPCs seem to be more understandable than Petri nets. Inspired by this survey we decided to use an EPC-like notation in our questionnaire to minimize the impact of the notation on understandability. To summarize, there is essentially one relation that seems to be confirmed by related research, and that is that larger models tend to be negatively connected with quality. The aim of our questionnaire is to enhance this rather limited body of knowledge.
3
Research Design
Only little research has been conducted on quality aspects of process models so far [3]. In particular, we identify the following six research questions related to the factors that might influence understandability of process models (cf. [27, 8, 28, 10]): 1. What personal factors (beyond general psychological and intellectual factors) have an influence? 2. Which model characteristics (e.g. number and type of splits) contribute to a good understandability? 3. How does the modeling purpose (e.g. documentation versus enactment) relate to understandability? 4. How is understandability related to knowledge about the domain that is described in the model? 5. Which differences in understandability exist when observing semantically equivalent models described in different modeling languages? 6. What is the impact of different visual layout strategies or graph drawing algorithms on understandability? We approach these questions with an experimental design focusing on personal and model characteristics (question 1 and 2). Furthermore, we strive to neutralize the influence of the other factors: related to question 3, we gathered a set of process models from practice that were all created for documentation purposes. To eliminate the influence of domain knowledge (question 4), we recoded the task labels to capital letters A to W . Based on the observation by [27] that EPCs appear to be easier to understand than Petri nets, we chose for an EPC-like notation without events. The participants received a short informal
5
description of the semantics similar to [29, p.25] (question 5). Finally, we drew all models in the same top-to-bottom style with the start element at the top and end element at the bottom (question 6). 3.1
Phases of the Experiment
The experiment was conducted in three phases. First, we collected a set of eight process models from practice with an equivalent number of tasks (25) and constructed two additional variants for each of them by changing the type of some routing elements (e.g. a particular XOR-split in a AND-split). For these 24 process models we built a questionnaire that measured the following variables: – theory: Students made a self-assessment of theoretical knowledge in business process modeling on a five point ordinal scale, – practice: Students made a self-assessment of practical experience in business process modeling on a four point ordinal scale, – perceived: For each model, students made an assessment of the perceived difficulty of the model, – score: For each model, students answered a set of eight closed questions about order, concurrency, exclusiveness, or repetition of tasks in the model and one open question where respondents were free to identify a model problem (if they felt there was any); from the answers we calculated score as the sum of correct answers to serve as an operationalization of understandability; i.e. score measures in how far the semantics of the model are interpreted correctly by the participant. – ranking: For all variants of the same model, students ranked these regarding their relative perceived understandability. For example, students were asked if process A was more difficult to understand than process B. The correct answers for the questions relating to score were determined with the EPC analysis tools introduced in [30]. While the closed answers were evaluated automatically, the open answers had to be interpreted and matched with the errors detected by the tools. The same EPC analysis tools were also used to calculate the set of metrics (cf. next section). For this first version of the questionnaire, we conducted a pre-test which led to a reduction of the model set to 12 process models, i.e. four models in three variants each, and a reformulation of some questions. We basically dropped the more simple models for preventing fatigue. Second, we created six versions of the questionnaire with different randomized order of models and variants for eliminating learning effects throughout the answering. The questionnaire was filled out in class settings at the various universities by 73 students in total. It led to a total of 847 complete model evaluations. At the time of the experiment, students were following or completing courses on process modeling at the Eindhoven University of Technology, the University of Madeira, and the Vienna University of Economics and Business Administration. Participation was voluntarily. The motivation for the students was the fact that they felt to be in a competitive situation with the
6
other universities, and that we informed them that the questionnaire would be a good exam preparation. The answers were coded and analyzed using the statistics software packages SPSS and Statgraphics. Third, we conducted interviews with experts in business process modeling to contrast our findings with insights from practitioners. This validation is of particular importance considering the insecure external validity of student experiments in information systems research (see [3]). 3.2
Hypothetical Relations between Factors and Understandability
This section discusses the hypothetical relation between the various factors and understandability. Table 1 gives an overview. In particular, we expect that the perceived difficulty of a process model (perceived) would be negatively connected with the score as an operationalization of actual understandability. The same positive connection is assumed with theory and practice while the count metrics #node, etc., and the diameter of the process model (i.e. the longest path) should be related to a lower understandability. The precise formulae for calculating these and the following metrics are presented in [8]. The sequentiality, i.e. the degree to which the model is constructed of task sequences, is expected to be positively connected with understandability. The same is expected for separability, which relates to the degree of articulation points in a model (i.e. nodes whose deletion separates the process model into multiple components), and structuredness, which relates to how far a process model is built by nesting blocks of matching join and split routing elements. Both connectivity and density relate arcs to nodes: the former by dividing #arcs by #nodes, the latter by dividing #arcs to the maximally possible number of arcs. The token split metric captures how many new tokens can be introduced by AND- and OR-splits. It should be negatively connected with understandability. The average and maximum connector degree refer to the number of input and output arcs of a routing element, which are expected to be negatively connected with score. The same expectation is there for potential routing elements’ mismatch, also calculated on the basis of their degree and summed up per routing element; for depth related to the nesting of structured blocks; for the control flow complexity metric as the number of choices that can be made at splits in the model; and for connector heterogeneity as the degree to which routing elements of different types appear in a model. In the subsequent section we contrast these hypothetical connections with the results of the questionnaire.
4
Results
This section presents the results of the questionnaire and interviews. We first analyze the distribution of score in Section 4.1 and discuss its connection with perceived difficulty in Section 4.2. Then, we analyze personal factors and their connection with score in Section 4.3. In Section 4.4 we consider the connection
7 Table 1. Hypothetical relation between factors and understandability factor score factor score perceived + connectivity – theory + density – practice + token splits – #nodes – av. connector degree – #arcs – max. connector degree – #tasks – mismatch – #connector – separability + #and (join, split) – depth – #xor (join, split) – structuredness + #or (join, split) – control flow complexity – diameter – connector heterogeneity – sequentiality +
of model-related factors operationalized by the set of metrics. The final part of this section is devoted to our interviews with modeling experts. 4.1
Distribution of Score
If we apply a standard grading scheme with 10% intervals1 there would have been 8 students having an A, 27 having a B, 21 with a C, 8 with a D, and 9 with an E. Beyond that, the mean score for all but one of the models ranges between 6.8 and 7.4 with 9 being the maximum, while one model has only a mean score of 5.5. To further examine the distribution of score across the models we applied both Kruskal-Wallis and Mood’s median tests at 95% confidence levels [31]. Both non-parametric tests focus on medians to determine differences between distributions, which is appropriate here because score displays significant deviations from a normal distribution. Interestingly, both test results point to the model with the low mean score being different from the other models (P-values ¿ 0.05). It is model L, which was already shown in Figure 1. When all models are compared with these tests excluding model L, no significant differences between the models can be observed with respect to score (P-values > 0.25). If we take a closer look at model L, it seems a little odd that this model has such a low score value. As we described in Section 3.1, the questionnaire includes four sets of models and each of these sets includes three slightly different models. Models in the same group differ only with respect to the type of routing elements. But each model in the group that L belongs to has only six routing elements, while the models in other groups contain two or three times this number. Also, the number of arcs in the L model group (37) is lower than that of the other groups (48, 57, and 59). So, L seems to come from a group of models that appears to be relatively easy to see through. Now the question rises why the other models in the same group as L do not show such a comparably 1
A’s for 90% score or better, B’s for 80%-90%, etc.; E’s for less than 60%.
8
low score value. In Figure 2 we display all three models. Note that only model fragments are displayed for ease of visualization. Observed from the top down, it is the type of the second logical routing element that actually distinguishes the three models from each other. For model L this is an XOR-split routing element, for the other models an AND-split and OR-split respectively.
XOR
XOR
AND
XOR
OR
O
XOR
O P
O P
Q
S
Q
S T
T
U
W
U
W
OR
M
P
Q
T
U
S
W
OR
M
OR
XOR
XOR
XOR
End
End
End
M
Fig. 2. Fragments of model variants J, K, and L (from left to right)
When considering the answers of the respondents on a detail level, two questions stand out as they received few correct answers for model L (¿ 20) and many correct answers (> 20) for the other two models. These questions are: – “If T is executed for a case, can U be executed for the same case?”, and – “Can T, M, and O all be executed for the same case?” It is clear to see that the distinguishing connectors in the two leftmost models, i.e. the AND-split and OR-split respectively, directly allow for the interleaved execution of T and U. But even for L – the rightmost model in Figure 2 – it is possible that T and U will be executed for the same case. However, this can only happen after a cycle through M. This is presumably overlooked by many respondents. Similarly with respect to the second question, many respondents failed to see that T, M, and O can be executed in the rightmost model (just as this is possible in the other two models of course). So, in general, there is no significant difference in score across the various models; the notable exception is model L which generated a low score value because of the subtle interplay between connector and model structure elements. 4.2
Relation between Perceived and Score
In addition to score we also analyzed the distribution of perceived. In particular, we used Kendall’s coefficient of agreement u [32, 31] to determine whether a ranking can be established by the perception of all participants. Interestingly,
9
for each of the four groups of variants a total ordering emerges from the respondents’ answers that is significant at a 95% confidence level. This result is confirmed by another part of our questionnaire in which we explicitly asked the respondents to rate the relative differences in understandability between three models from different groups. So, despite the fact that it was allowed to rate models as equally difficult to understand, respondents do see distinct differences in the understandability of models within each set and even across the sets. By now, we see different patterns emerging from the distributions of perceived and score. While models are perceived as distinctly different from each other, the actual numbers of correct answers they generate do not differ significantly. There is the notable exception of model L, with a very low score value and, indeed, model L is also perceived as the most difficult model to understand within its group. To investigate the (absence of the) relation between perceived and score closer, we determined the Pearson correlation coefficient between the variables for all complete 847 model evaluations we gathered. The correlation coefficient equals 0.234 with a P-value ¿ 0.05, which indicates a significant but relatively weak correlation at a 95% confidence interval. The insight that we derive from this part of our analysis is that there is a rather loose relation between perceived and score. Despite a significant statistical relation, respondents tend to exaggerate the differences in model understandability for models for which they do not produce significantly different numbers of correct answers. The variations in score also gives us two additional insights. First of all, as all models have the same number of tasks, the lack of significant differences in score across most models potentially points to the fact that model size is the primary factor that impacts model understandability. If so, it would be reasonable that models with equal numbers of tasks appear equally difficult to understand. For the remainder of the analysis we assume that the other factors under investigation (see Section 3.2) are indeed to be considered as of secondary importance. Secondly, it follows from our detailed analysis of model L that a single change in a model element can have a significant impact on a model’s understandability. So, despite the potentially dominant impact of size, the search for the additional impact factors is indeed relevant. 4.3
Personal Factors and Score
Before we undertook our experiment, we had no reason to expect differences in score between respondents with different university backgrounds. All respondents had received at least a basic training in the use of process modeling techniques at the time they took the questionnaire. Also, the exposure to process modeling in practice would be negligible for all involved respondents. To test the absence of such a difference, we computed the total score over the 12 models. For each respondent, this figure lies between 0 and 108, the latter being the theoretical maximum in case of answering all 9 questions for each of the 12 models correctly. For our respondents, total score ranges between 11 and 103 with an average value of 81.2. In Figure 3, total score is shown for all students in ascending order.
10
100
Total Score
80
60
40
20
0 1
4
7 10 13 16 19 22 25 28 31 34 37 40 43 46 49 52 55 58 61 64 67 70 73
Respondent nr.
Fig. 3. Total score for respondents
If no difference would exist between the three distributions of total score, students can be assumed to perform similarly across the three universities. To test this, we again applied the non-parametric Kruskal-Wallis test, because application of the Shapiro-Wilk W test indicates that with a 95% confidence total score is not normally distributed for any university. Contrary to expectations, the application of the Kruskal-Wallis test does indicate that there is a statistically significant difference among the medians at a 95% confidence level (P-value ¿ 0.05). In other words, differences exist in the ability of respondents to answer questions correctly across the three universities. Additional pairwise Mann-Whitney tests [31] indicate that respondents from Eindhoven perform significantly better than respondents from each of the other two universities (P-values ¿ 0.05), although the difference between the respondents from the universities of Vienna and Madeira is not significant (P-value = 0.061). In Figure 4, box plots are shown for TUe and non-TUe students. A retrospective analysis of the courses offered at the various universities revealed that the hours spent on actual modeling is the highest in Eindhoven, which may explain the noted difference. In particular, Eindhoven students have been explicitly and thoroughly taught about ‘soundness’ [33], a general correctness criterion for workflow nets. An alternative explanation is that Eindhoven students are graduate students where the students from Madeira and Vienna are still in their 3rd year of undergraduate studies. Interestingly, across the different universities different modeling techniques are taught. The Eindhoven students were trained in workflow nets (based on the Petri net formalism), the Vienna students in EPCs, and the Madeira students had knowledge of both the Petri net formalism and EPCs. So, the choice of our EPC-like notation does not obviously favor students who are familiar with EPCs. A search for other differences within the respondent population did not reveal any convincing factors. In particular, both the variables theory (0.203) and
11
non TUe
TUe
0
10 20 30 40 50 60 70 80 90 100 110
Fig. 4. Total score for TUe and non-TUe respondents
practice (0.070) do correlate weakly with total score, but these correlations are not significant at the 95% confidence level. The variables are neither very useful in the identification of clusters with differing total score performances. For example, the clearest identification of two different clusters that resulted from the application of various agglomerative clustering algorithms (e.g. nearest neighbor, media, Ward’s method) is shown in Figure 5. Here, the group average distance between clusters is used. It can be seen that most clusters extend across almost the entire range of theory and practice. So, these values have little relation with score. It suggests that, in the context of this study, students’ self-assessments are not valid.
Cluster Scatterplot Group Average Method,Squared Euclidean Cluster 1 2 Centroids Total score
Total score
Cluster Scatterplot Group Average Method,Squared Euclidean 110 100 90 80 70 60 50 40 30 20 10 0 1
2
3 Theory
4
5
Cluster 1 2 Centroids
110 100 90 80 70 60 50 40 30 20 10 0 1
2
3
4
Practice
(a) for theory and total score
(b) for practice and total score
Fig. 5. Cluster scatterplots
12
4.4
Metrics and Score
In this section, the search for secondary factors that have an impact on the understandability of process models is described. As explained in Section 3.2, we take a wide range of potential factors into consideration. To determine their power to explain variations in model understandability, we established for each model its average score (computed over the 73 respondents) and determined Pearson correlation coefficients with all potential factors. From the correlation coefficients, only the signs of #or joins, density, average connector degree, mismatch, and connector heterogenity correspond with the hypothesized influences as given in Table 1. However, only the correlation coefficients of density and average connector degree are significant at a 95% confidence level (see Table 2). Table 2. Factors with expected impact on understandability factor corr.coeff. P-value #or joins -0.330 0.295 density -0.618 0.032∗ av. connector degree -0.674 0.016∗ mismatch -0.438 0.154 connector heterogenity -0.312 0.323 ∗
significant at 95% confidence level
To deeper examine the value of the distinguished factors in explaining differences in score, we developed various linear regression models – even though it should be noted that the number of 12 different model observations is quite low for this purpose. We compared all 31 (= 25 − 1) linear regression models that take a non-empty subset into account of the factors shown in Table 2. To differentiate between the regression models, we used the adjusted R2 statistic that measures how the variability in the score is explained by each model. Within this setting, no multivariate regression model had acceptable t-values. The best adjusted R2 statistic equals 45% and belongs to the regression model that uses average connector degree – one of the factors that correlates significantly with average score. For this regression model, the Durbin-Watson statistic value indicates that there is no serial autocorrelation in the residuals at the 95% confidence level. In Figure 6 a plot is shown of the fitted model values using this regression model. Note that the outlying model L can be clearly identified at the bottom right corner. As stated, the number of models is too small to make any strong claims. Still, from the factors considered we see that the two factors which most convincingly relate to model understandability both concern the number of arcs in a process model. The average connector degree measures the model’s average of incoming/outcoming arcs per routing element, while density gives the ratio of
13
7.5
Score
7.1 6.7 6.3 5.9 5.5 3.4
3.6
3.8 4 AvCDegree
4.2
4.4
Fig. 6. Linear regression model (including 95% confidence levels)
existing arcs to the maximal number of arcs between the nodes in the model (i.e. when it would be completely connected). Both factors point to the negative effect of a relatively high number of arcs on a model’s understandability. 4.5
Expert interviews
To validate our results, we interviewed 12 professional process modellers on the insights gained from our questionnaire. On average this group possessed over 10 years of expertise in developing process models, mainly for documentation purposes, but most had experience with enactment models as well. The professionals are employed in 7 different companies, four of which being consultancy firms, two financials, and one utilities company. With respect to personal factors, the experts emphasized the value of subjects’ analytical skills and visual perceptiveness to understand process models. Aside from these mental faculties, both modeling experience and familiarity with the modeling technique at hand were mentioned often as being of positive influence. While the former aspect is explicitly confirmed by the findings from our questionnaire, we have no direct support for the second aspect. Next, we asked the experts whether users are capable of assessing their own ability to understand process models. Half of the experts predominantly thought so, while the others predominantly thought the opposite. In the former group, modeling experience and familiarity with the modeling technique were mentioned by almost all as important conditional factors. One of the experts from the latter group indicated that “people tend to overestimate themselves, particularly men”. Interestingly, one respondent indicated that people in general will be able
14
to understand what a model intends to communicate, but that it is hard to determine whether a model is completely correct. The image emerges that proper self-assessment with respect to model understandability is problematic to say the least, which is consistent with our findings. Finally, experts indicated a decreasing relevance of (a) model-related factors, (b) person-related factors, and (c) domain knowledge for the understanding of process models. The model-related factors that were mentioned most as positively influencing model understandability: unambiguity (7 times), simplicity (4 times), structuredness (4 times) and modularity (4 times). From the lessmentioned factors, the supposed positive effects of textual support is interesting to mention, i.e. well-chosen textual descriptions of model elements (3 times) and textual context information on the model in general (3 times). Part of the factors mentioned seem to overlap with the factors considered in this study (e.g. simplicity and structuredness), while others are food for further research (e.g. modularity and textual support).
5
Conclusions
We set out with this research to develop a better insight into the factors that make process models understandable for humans. From the six research questions in Section 3, we focused on the relations between personal and model characteristics (questions 1 and 2). Our findings suggest that personal factors indeed influence the ability to understand process models. In particular, it seems that the amount of theoretical modeling knowledge of the subjects may play a role here. At the same time, our respondents were not capable of a proper self-assessment with respect to their modeling proficiency. With respect to the model characteristics, our findings from the questionnaire seem to underline the insight that model size is of dominant importance on model understandability. Yet, small variations between models can lead to significant differences in their comprehensibility. This means that secondary explanatory factors are still missing from the picture. From our analysis of a wide set of candidate factors, the average connector degree is the most convincing factor that relates to model understandability, followed by a model’s density. Both factors point at the negative effect of a relatively high number of arcs on a model’s understandability. To counter the potentially limited validity of an experiment involving students, we interviewed a number of experienced process modelers. Their opinions generally supported our findings, while the interviews also generated further factors to investigate. Our research is characterized by other limitations, in particular the small set of models being considered and the limited set of participants. With larger sets in future replications of the experiment, we can investigate the impact of secondary factors in greater detail. The other directions for future research follow logically from the research questions we did not address yet. While we tried to neutralize the influences of the modeling purpose, knowledge of the domain, modeling language, and layout strategy, these are all issues that need further exploration.
15
References 1. Hoppenbrouwers, S., Proper, H., van der Weide, T.: A Fundamental View on the Process of Conceptual Modeling. In: Conceptual Modeling – ER 2005, 24th International Conference on Conceptual Modeling. Volume 3716 of Lecture Notes in Computer Science. (2005) 128–143 2. Becker, J., Rosemann, M., Uthmann, C.: Guidelines of Business Process Modeling. In van der Aalst, W., Desel, J., Oberweis, A., eds.: Business Process Management. Models, Techniques, and Empirical Studies. Springer, Berlin et al. (2000) 30–49 3. Moody, D.: Theoretical and practical issues in evaluating the quality of conceptual models: current state and future directions. Data & Knowledge Engineering 55 (2005) 243–276 4. Davies, I., Green, P., Rosemann, M., Indulska, M., Gallo, S.: How do practitioners use conceptual modeling in practice? Data & Knowledge Engineering 58 (2006) 358–380 5. Mendling, J., Moser, M., Neumann, G., Verbeek, H., Dongen, B., Aalst, W.: Faulty EPCs in the SAP Reference Model. In S. Dustdar, J.F., Sheth, A., eds.: Proceedings of BPM 2006. Volume 4102 of Lecture Notes in Computer Science., Vienna, Austria, Springer-Verlag (2006) 451457 6. Mendling, J., Moser, M., Neumann, G., Verbeek, H., Dongen, B., Aalst, W.: A Quantitative Analysis of Faulty EPCs in the SAP Reference Model. BPM Center Report BPM-06-08, BPMCenter.org (2006) 7. Simon, H.: Sciences of the Artificial. 3rd edn. The MIT Press (1996) 8. Mendling, J.: Detection and Prediction of Errors in EPC Business Process Models. PhD thesis, Vienna University of Economics and Business Administration (2007) 9. Lindland, O.I., Sindre, G., Sølvberg, A.: Understanding quality in conceptual modeling. IEEE Software 11 (1994) 42–49 10. Krogstie, J., Sindre, G., Jørgensen, H.: Process models representing knowledge for action: a revised quality framework. European Journal of Information Systems 15 (2006) 91–102 11. Moody, D., Sindre, G., Brasethvik, T., Sølvberg, A.: Evaluating the quality of process models: Empirical testing of a quality framework. In Spaccapietra, S., March, S., Kambayashi, Y., eds.: Conceptual Modeling - ER 2002, 21st International Conference on Conceptual Modeling. Volume 2503 of Lecture Notes in Computer Science., Springer (2002) 380–396 12. Int. Standards Org. (ISO): Information technology - software product evaluation - quality characteristics and guide lines for their use. ISO/IEC IS 9126 (1991) 13. G¨ uceglioglu, A.S., Demir¨ ors, O.: Using software quality characteristics to measure business process quality. In van der Aalst, W., Benatallah, B., Casati, F., Curbera, F., eds.: Business Process Management, 3rd International Conference, BPM 2005, Nancy, France, September 5-8, 2005, Proceedings. Volume 3649 of Lecture Notes in Computer Science (LNCS)., Springer Verlag (2005) 374–379 14. Gemino, A., Wand, Y.: Evaluating modeling techniques based on models of learning. Commun. ACM 46 (2003) 79–84 15. Lee, G., Yoon, J.M.: An empirical study on the complexity metrics of petri nets. Microelectronics and Reliability 32 (1992) 323–329 16. Nissen, M.: Redesigning reengineering through measurement-driven inference. MIS Quarterly 22 (1998) 509–534 17. Morasca, S.: Measuring attributes of concurrent software specifications in petri nets. In: METRICS ’99: Proceedings of the 6th International Symposium on Software Metrics, Washington, DC, USA, IEEE Computer Society (1999) 100–110
16 18. Reijers, H., Vanderfeesten, I.: Cohesion and coupling metrics for workflow process design. In Desel, J., Pernici, B., Weske, M., eds.: Business Process Management: Second International Conference, BPM 2004. Proceedings. Volume 3080 of Lecture Notes in Computer Science., Springer (2004) 290–305 19. Cardoso, J.: Evaluating Workflows and Web Process Complexity. In: Workflow Handbook 2005. Future Strategies, Inc., Lighthouse Point, USA (2005) 284–290 20. Balasubramanian, S., Gupta, M.: Structural metrics for goal based business process design and evaluation. Business Process Management Journal 11 (2005) 680–694 21. Canfora, G., Garc´ıa, F., Piattini, M., Ruiz, F., Visaggio, C.: A family of experiments to validate metrics for software process models. Journal of Systems and Software 77 (2005) 113–129 22. Aguilar, E.R., Ruiz, F., Garc´ıa, F., Piattini, M.: Towards a Suite of Metrics for Business Process Models in BPMN. In Manolopoulos, Y., Filipe, J., Constantopoulos, P., Cordeiro, J., eds.: ICEIS 2006 - Proceedings of the Eighth International Conference on Enterprise Information Systems (III). (2006) 440–443 23. Laue, R., Gruhn, V.: Complexity metrics for business process models. In Abramowicz, W., Mayr, H.C., eds.: 9th International Conference on Business Information Systems (BIS 2006). Volume 85 of Lecture Notes in Informatics. (2006) 1–12 24. Cardoso, J.: Process control-flow complexity metric: An empirical validation. In: Proceedings of IEEE International Conference on Services Computing (IEEE SCC 06), Chicago, USA, September 18-22, IEEE Computer Society (2006) 167–173 25. Rosemann, M., Recker, J., Indulska, M., Green, P.: A study of the evolution of the representational capabilities of process modeling grammars. In Dubois, E., Pohl, K., eds.: Advanced Information Systems Engineering, 18th International Conference, CAiSE 2006, Luxembourg, Luxembourg, June 5-9, 2006, Proceedings. Volume 4001 of Lecture Notes in Computer Science., Springer (2006) 447–461 26. Agarwal, R., Sinha, A.P.: Object-oriented modeling with uml: a study of developers’ perceptions. Commun. ACM 46 (2003) 248–256 27. Sarshar, K., Loos, P.: Comparing the control-flow of epc and petri net from the end-user perspective. In Aalst, W., Benatallah, B., Casati, F., Curbera, F., eds.: Business Process Management, 3rd International Conference, BPM 2005, Nancy, France, September 5-8, 2005, Proceedings. LNCS 3649 (2005) 434–439 28. Lange, C., Chaudron, M.: Effects of defects in uml models: an experimental investigation. In Osterweil, L., Rombach, H., Soffa, M., eds.: 28th International Conference on Software Engineering (ICSE 2006), Shanghai, China, May 20-28, 2006, ACM (2006) 401–411 29. Mendling, J., Aalst, W.: Towards EPC Semantics based on State and Context. In M. N¨ uttgens and F.J. Rump and J. Mendling, ed.: Proceedings of the 5th GI Workshop on Business Process Management with Event-Driven Process Chains (EPK 2006), Vienna, Austria, German Informatics Society (2006) 25–48 30. Mendling, J., Aalst, W.: Formalization and Verification of EPCs with OR-Joins Based on State and Context. In: Proceedings of the 19th Conference on Advanced Information Systems Engineering (CAiSE 2007). Lecture Notes in Computer Science, Trondheim, Norway, Springer-Verlag (2007) 31. Siegel, S., Castellan, N.J.: Nonparametric Statistics for the Behavorial Sciences. 2nd edn. McGraw Hill (1988) 32. Kendall, M.: Rank Correlation Methods. 4th edn. Griffin (1970) 33. Aalst, W.: Workflow Verification: Finding Control-Flow Errors Using Petri-NetBased Techniques. In: Business Process Management. Volume LNCS 1806. Springer Verlag (2000) 161–183