From 1986 to 1995 the Oklahoma five-year moving average wheat grain yield de- clined from 32.6 to 26.7 bu./ac. This study was conducted to determine why the ...
Journal of Agricultural and Resource Economics 22(2):333-344 Copyright 1997 Western Agricultural Economics Association
Wheat Yield Response to Changes in Production Practices Induced by Program Provisions Francis M. Epplin From 1986 to 1995 the Oklahoma five-year moving average wheat grain yield declined from 32.6 to 26.7 bu./ac. This study was conducted to determine why the state average wheat yield declined. Changes in government program provisions and changes in production practices were investigated. Changes in acreage base and changes in program diversion requirements were associated with changes in planting date and changes in the proportion harvested for grain that had been fall/winter grazed. Yield responded to these induced changes in production practices. Yield was inversely related to the proportion of the state's wheat acres planted prior to 1 October and inversely related to the proportion of acres harvested for grain that had been winter grazed. Key words: commodity program, conservation reserve program, diversion requirements, trend, wheat, yield
Introduction Wheat is the most important food grain produced in the United States and the most important crop in Oklahoma. Investments in research to develop improved varieties, pest
and weed control methods, and fertility management programs are generally expected to result in improved crop yields per harvested acre over time. Investment in the development of human capital of farmers through cooperative extension services are also expected to contribute to improvements in crop yields. However, over the decade from 1986 to 1995, the Oklahoma five-year moving average (5YMA) wheat grain yield de-
creased by 18%, from 32.6 to 26.7 bu./ac. (fig. 1). Throughout the decade there were approximately 7.6 million wheat base acres in Oklahoma that qualified for participation in the federal wheat commodity programs. Between 1986 and 1989, more than 720,000 Oklahoma wheat base acres, nearly 10%, were placed in the Conservation Reserve Program (CRP) and thus removed from production for ten years. Farmers tend to divert the least productive acres under government acreage control programs (Love and Foster; Rausser, Zilberman, and Just; Tweeten, p. 315). As the least
productive acres are idled, the average yield per harvested acre is expected to increase. Additional yield improvement might also be expected as the farms' fixed resources are allocated to the acres that remain in production. The 18% decline in average yield after
implementation of the CRP program was not expected. To the contrary, it could be Francis M. Epplin is a professor, Department of Agricultural Economics, Oklahoma State University. The assistance of Barry Bloyd, Oklahoma Agricultural Statistics Service, is gratefully acknowledged. A number of individuals contributed to the ideas expressed in this paper. Remaining errors are the responsibility of the author. Journal paper AEJ-238 of the Oklahoma Agricultural Experiment Station, project H-2237.
334 December 1997
Journal of Agricultural and Resource Economics An
'Ili
I
I
^ 35 U 0
n
30
0
25
I
I
20
1C; 1960
I 1970
I 1980
I 1990
I i 2000
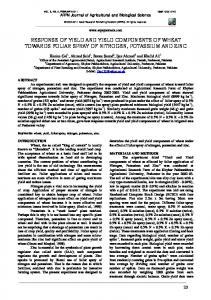
Year *Oklahoma e U.S. Figure 1.
Oklahoma and U.S. wheat grain yield (five-year moving average)
assumed that CRP land was, on the average, less productive than land retained in production. If so, other things being equal, the average yield per harvested acre would have been expected to increase as a result of the CRP. It seems reasonable to expect that
implementation of the CRP did not cause wheat grain yields to decline. Negative trends in crop yields are troubling. An 18% decline after removal of 10% of what were assumed to be the least productive acres is extremely disconcerting. The objective of the research reported in this article is to determine why the 5YMA grain
trend yield declined in Oklahoma from 1986 to 1995. Changes over time in production practices, including changes in planting date and changes in the proportion of wheat harvested that was winter grazed are investigated.
A Multiple-Purpose Crop Many wheat producers in the Southern Plains diversify by producing some wheat for grain, some wheat for forage and grain, and some wheat for forage (Redmon et al.). In general, wheat managed to produce both forage and grain is seeded earlier in the fall than wheat managed to produce only grain. In a typical growing season, the early seeded wheat produces fall forage that may be grazed by livestock during the late fall and winter. If the livestock are removed prior to development of the first hollow stem (typically early March), the wheat will mature and produce a grain crop for harvest in June. Research on wheat grain yield response to alternative planting dates in the region is limited (Ferreira, Peeper, and Epplin; Heer and Krenzer; Martin; Witt). However, one consistent finding across these planting date experiments was that grain yields from early September plantings seldom equalled yields obtained from early October plantings. A few studies to determine the consequences of grazing on grain yield have been conducted (Redmon et al.; Christiansen, Svejcar, and Phillips; Holliday). Holliday summarized several studies and found that in some cases grazing did reduce grain yield. However, in other cases grain yield was greater on plots that had been mechanically clipped or grazed. Christiansen, Svejcar, and Phillips reported that when wheat growth potential is such that removal of forage will prevent lodging, grazing can increase grain yield. Redmon et al. concluded that grazing winter wheat may have minimal effect on
Epplin
Wheat Yield Response gn~~~~~~~~~~~~~~r Du
An.
bu
335
I A
0 40
40 'co 40
0 L 0
I. Q. XO 20
30 mu -,
0 (U J0
I
0
1960
1970
Yield
I
1980
oN I -u
1990
2000
Year o Planted by Oct 1
Figure 2. Oklahoma wheat grain yield and percentage of crop planted prior to 1 October (fiveyear moving average) grain yield if soil moisture is adequate throughout the growing season. They did not define minimal. Redmon et al. also reported that under some circumstances increased
grain yield can be obtained by grazing tall winter wheat cultivars prior to jointing. Seeding in mid-September would be expected to result in more forage but less grain than seeding in mid-October (Ferreira, Peeper, and Epplin; Heer and Krenzer; Martin;
Witt). Farmers who produce wheat for both forage and grain are confronted with this trade-off. Thus, the expected grain yield (averaged over a period of years) from wheat planted early (mid-September) to produce both forage and grain is lower than the ex-
pected grain yield from wheat planted later (mid-October) to produce grain only. Estimates of the percentages of wheat planted prior to 1 October were obtained from the archives of the Oklahoma Agricultural Statistics Service (OASS) (Bloyd). The OASS conducts a weekly survey of county cooperative extension agents to determine crop
conditions and to determine what percentage of the crop has been planted. The percentage of Oklahoma wheat planted prior to 1 October is graphed along with wheat trend yield in figure 2 (5YMA). From 1973 (average from 1969-73) to 1985 (average from 198185), the trend was for farmers to plant later. The 5YMA value for 1973 indicates that
52% of the wheat was planted prior to 1 October. By 1985, only 32% was planted prior to 1 October. During this time period, the 5YMA wheat yield increased by 27% from 25.4 to 32.2 bu./ac. (fig. 2). By 1995, the 5YMA of the percentage planted prior to 1
October increased to the highest level of the data set (53.7%). However, the 5YMA grain yield declined by more than 17%, from 32.2 to 26.7 bu./ac. These data suggest that the percentage planted prior to 1 October may be an appropriate variable to explain changes in wheat grain yield trend. The graph clearly shows a negative correlation between the 5YMA trend in percentage planted prior to 1 October and the 5YMA trend in grain yield. However, the data do not directly address the question why farmers adjusted planting date over time. The proportion of wheat produced for both forage and grain could be expected to be a function of the value of fall/winter forage relative to the value of grain. Forage value
is derived from the change in value of the grazing livestock. The most common use of fall/winter wheat forage in the region is as pasture for young calves. Typically, 4-500pound steer calves are placed on wheat pasture in late November and removed in early
336 December 1997
Journal of Agricultural and Resource Economics o
.
_n
_
_
_,A
u .£w
5, co 40
40
0)
I
(., 0
.0 30
20
a)
;c
m·
>
^i/^)
4-
m
" l
0r 1960
1970
Yield
1 1980
1 1990
120
2000
Year e Price Ratio
Figure 3. Oklahoma wheat grain yield and beef value gain to wheat price ratio (five-year moving average) March. For a typical stocking density of two acres per calf, a rate of gain of two pounds per head per day is common. Thus, a 450-pound calf placed on wheat pasture in the fall could be expected to weigh 670 pounds when removed from the pasture in March. The gross value of the steer weight gain can be determined by subtracting the beginning value from the ending value. October (4-5 cwt) steer prices, March (6-7 cwt) steer prices, and June wheat prices were used to calculate the ratio of beef value gain (head) relative to wheat price (bu.). A graph of the 5YMA beef value gain to wheat price ratio is included in figure 3 along with the 5YMA wheat grain yield graph. Over the time period of the data series, the mean of the beef value gain to wheat price ratio was 43.6. The ratio ranged from a low of 28.6 (1967) to a high of 55.4 (1973). If farmers knew in advance that the beef value gain to wheat price ratio would be relatively high, the economic incentive would be to increase the relative amount of wheat acres used for both forage and grain and decrease the amount used for grain only. The proportion planted prior to 1 October would be expected to increase resulting in a relatively lower state average wheat grain yield. Hence, grain yield may be influenced by the beef gain to wheat price ratio. The graph in figure 2 indicates a considerable amount of variability in the beef value gain to wheat price ratio. The graph does not show a clear correlation of the 5YMA beef value gain to wheat price ratio with the 5YMA wheat grain yield. A graph of the percentage of wheat acres harvested for grain that were also winter grazed is included in figure 4 along with the wheat grain yield graph. The 5YMA graph shows that in the early 1970s roughly 30% of the wheat harvested for grain had been grazed during the fall and winter. However, the proportion of wheat acres that were harvested for grain that had also been winter grazed declined from 25% in 1979 (5YMA) to 6.5% in 1985. Since 1985, the proportion of harvested acres that had been winter grazed returned to a level consistent with that of the early 1970s. The graph illustrates a negative correlation between the trend in percentage of wheat acres harvested for grain that were winter grazed and the trend in wheat yield. The percentage of acres planted prior to 1 October is positively correlated with the percentage of acres harvested for grain that were winter grazed. Thus, both changes in planting date and changes in proportion grazed are associated with changes in wheat
Epplin
Wheat Yield Response Rn ou
337
.I
-
60 N
25 6 3 ,, w
(D 40
'
20 20 >
"0 a0
ca
..r
20
n V 1960
15 I
1970
II
1980
.
1990
¢
Iin -I U
2000
Year Grazed i Yield
Figure 4. Oklahoma wheat grain yield and percentage of wheat acres harvested for grain that were winter grazed (five-year moving average)
grain yield per harvested acre. However, the data do not directly explain why farmers adjusted production practices. Some factor or factors other than changes in value of forage relative to wheat grain may have provided incentives for producers to change
production practices.
Response to Wheat Program Provisions Unique aspects of the wheat commodity programs as administered in the Southern Plains may have provided incentives for producers to change both planting date and grazing practices. There are two rather noticeable aberrations in the Oklahoma 5YMA wheat grain yield per harvested acre trend over the 30 years prior to 1995 (fig. 1). The 5YMA yield increased dramatically in excess of trend from 1978 to 1983 and decreased from 1986 to 1995. Both aberrations from the long-term trend are associated with changes in wheat commodity program provisions. In general, deficiency payments depended upon the number of base acres. In 1977, legislation changed the acreage base for wheat from historical allotments to a percentage of current plantings. Oklahoma farmers responded by increasing plantings and, thus, wheat acreage base by 50% from 5.4 million acres in 1978 to 8.1 million acres in 1984. The proportion of the state's wheat acres planted prior to 1 October declined during this
time period from 43% in 1978 (5YMA) to 35% in 1983 (5YMA). The reason for this change in planting date is not clear. However, with a fixed machinery complement, the
50% expansion in acres planted may have necessitated an extension of the planting season. The decrease in the proportion of the crop planted prior to 1 October was as-
sociated with the dramatic increase in yields from 1978 to 1983. While the rapid expansion in wheat base may have influenced planting date, other provisions of the programs influenced grazing practices. In 1977, 1978, and from 198292, a voluntary acreage reduction program (ARP) was in effect. A payment-in-kind (PIK) program was used in 1983 and, 1984. A paid land diversion (PLD) program was used from 1983 to 1986. The 50/92 provision was established in 1986 followed by the 0/92
Journal of Agricultural and Resource Economics
338 December 1997
-
12
Kn~~~~~~~~~,
ou
mu
1-11,
c
40 ' 2
"0
3
.
-W0
CO
(U m Z
0k0
200u
1
u1-u
4,d
0 Z
m
I 10
-m 0
3:
mu 4)
0
I
-
-
I
~.
I
,
1975
1980
1985
1990
I
~.
1995
~..
IU 2000
Year e Not Harvested e Diverted Base Figure 5. Oklahoma wheat acres planted but not harvested for grain and percentage of wheat base acres diverted from grain production (five-year moving average)
option in 1988 (Green). All of these provisions influenced grazing practices since the diverted acres could be planted to wheat and grazed. In 1983, Oklahoma producers planted 101% of their base acres to wheat, but through a combination of PLD, PIK, and ARP, received payments for diverting 3.245 million acres-42% of their base. In general, producers who elected to participate in the various programs were required to devote diverted acres to a conserving use. Planting diverted land to wheat was considered to be a conserving use. Grazing of diverted acres was typically permitted except for a five-month period between 1 April and 31 October as designated by the state Agricultural Stabilization and Conservation Service committee. In Oklahoma, June through October was designated as the nongrazing period for diverted wheat base acres. Oklahoma wheat grain is typically harvested in June and the land is left idle until planting in September or October. Between 1982 and 1995, an average of 100% of wheat base acres were planted to wheat each year (excluding wheat base acres enrolled in the conservation reserve program). However, farmers received payments from program participation (ARP, PIK, PLD,
0/92) that required an average annual diversion of 1.5 million acres (20% of the base). Diverted acres could not be harvested for wheat grain but they could be seeded to wheat and used as pasture. Graphs of the number of acres planted to wheat but not harvested for grain (SYMA) and the percentage of wheat base diverted from grain production
(SYMA) are included in figure 5. There were several practical implications of the programs as administered. First, the restriction was on acres harvested for grain, not acres planted. But, base acres depended upon acres planted rather than acres harvested. In some years the program provisions including diversion rates were not announced until after winter wheat was planted. Sec-
ond, the specific acres to be harvested for grain could be selected relatively late in the growing season. In other words, the entire farm could be seeded to wheat in the fall, and grazed by livestock during the fall and winter. In the spring, the producer could effectively cull acres, acres not to be harvested for grain, as necessary to fulfill diversion requirements. Livestock could be removed from acres selected for harvest, and the growing plants permitted to produce a grain crop. Grazing could continue on the diverted acres, typically until 1 June. By policy, the crop on the diverted acres was to be destroyed
Epplin
Wheat Yield Response
339
prior to 1 June in most years. However, wheat that has been grazed in April and May, after development of the first hollow stem, will not produce grain and is effectively
"destroyed" as a grain crop. Third, the proportion of acres harvested for grain that were also winter grazed was relatively lower in years with high diversion requirements. Fourth, when high diversion rates were announced or anticipated, the incentive was to plant early, to increase the probability of producing fall and winter forage on those acres that
would not be harvested for grain. Adjustments in federal policy programs over time may have provided incentives for producers to change production practices. Changes in the proportion planted prior to 1 October and changes in the proportion of the wheat crop harvested for grain that was
also winter grazed may help to explain changes in the trend yield.
Model The investigation of possible explanations for the change in wheat yield over time in Oklahoma led to the development of the following model: Yld = f(Trd, BWPR, Octl,
Grzd, Hrvt), where Yld is Oklahoma wheat yield (bu./ac.) (5YMA); Trd is linear time trend; BWPR is beef value gain to wheat price ratio (5YMA); Octl is percent of Oklahoma wheat crop planted prior to 1 October (5YMA); Grzd is percent of harvested acres that had been grazed (5YMA); and Hrvt is percent of wheat acres planted that were
harvested for grain (5YMA). Since the objective of the study was to determine why the 5YMA wheat grain trend yield declined, 5YMA data were used.1 Over the long term, trend yield is expected to be positively related to the Trd variable. Since yields from early September plantings seldom equalled yields obtained from early
October plantings in experiment station trials, yield is expected to be negatively related to the Oct variable. The effects of fall and winter grazing (and clipping) as measured in controlled experiments were negative in some studies and positive in other studies. However, a negative relationship between Grzd and grain yield seems more plausible since farmers have less flexibility necessary to remove livestock from the wheat pasture at the crucial time and are more likely to graze beyond the development of the first hollow stem. Over time, if the value of beef gain relative to the value of wheat grain declined, farmers would be expected to respond by putting more effort into wheat grain relative to wheat forage production. Thus, the BWPR variable is expected to be negatively related to wheat grain yield. However, the graph in figure 2 shows no consistent linear relationship between the 5YMA BWPR and the 5YMA grain yield. When given a choice to select acres for grain harvest relatively late in the growing season, farmers would be expected to select the best grain producing acres. Hence, as the percentage of wheat acres planted that were harvested for grain increases, the exThis study was inspired, in part, by a group of wheat production researchers who have traditionally used five-year moving averages to display wheat trend yield. Their expressed reason for using the moving averages is to smooth environmental variability. The wheat growing belt of the state occupies part of what is known as "tornado alley" and the environment plays a major role in the year-to-year variability of wheat yield. A number of environmental factors such as late freezes, hot dry winds during grain filling, excessive rain during harvest, extended droughts, and hail may have a major impact in any given year. There is considerable variability from year-to-year in the yield limiting environmental factor. Production researchers and farmers recognize that they can not control the environment in the Southern Plains. Hence, the purpose of this study was to look beyond environmental factors to determine if management factors over which producers may have some control were associated with changes in the trend. Five-year moving averages were used to maintain consistency with the original motivation for the study and to enhance discussion and communication with production scientists.
340
December 1997
Journal of Agricultural and Resource Economics
Table 1. Estimates of Oklahoma Wheat Grain Yield as a Function of a Linear Time Trend, the Beef Value Gain to Wheat Price Ratio, the Percent of Wheat Planted Prior to 1 October, the Percent of Harvested Acres That Were Grazed, and the Percent of Planted Wheat Acres That Were Harvested Independent
Variables
Model A
Model B
Model C
Model D
Intercept
21.95 (20.58) 0.3079 (3.07)
18.76 (15.76) 0.2255 (2.35) 0.1056 (3.86)
36.97 (43.18) 0.2874 (23.88)
29.39 (30.74) 0.2894 (11.04)
Time trend Trd Beef value gain to wheat price ratio BWPR Planted prior to 1 October (%) Octl Harvested acres also grazed (%) Grzd Harvested (%) Hrvt Adjusted R2
-0.3882 (-20.02) -0.2655 (-8.73)
0.916
0.942
0.947
0.873
Note: The dependent variable is Oklahoma wheat grain yield (bu.) per harvested acre (five-year moving average). All independent variables are in terms of five-year moving averages except for the time trend. Numbers in parentheses are t-statistics. Data were corrected for fifth-order autocorrelation.
pected grain yield per harvested acre is expected to decline and the Hrvt variable may be negatively related to yield. On the other hand, in years with relatively low yields, the opportunity cost of harvesting may exceed the value of the grain on a greater proportion of the acres. The percentage of wheat acres planted that are harvested for grain in these years of relatively high yields may be relatively high, in which case the Hrvt variable may be expected to be positively related to yield. The data were corrected for fifth-order autocorrelation that resulted from the use of 5YMA data (White et al.). Tests for heteroskedasticity were conducted. The tests failed to reject the null of homoskedasticity. Reduced models were estimated with various combinations of the independent variables. 2
Results Results from the full model and 15 reduced models are reported in table 1. The time trend variable (Trd) was included in all models and as expected is significantly positive in all models. The Trd estimate is relatively robust and ranges from 0.21 to 0.31. The estimated coefficient is 0.29 for the full model (Model P). This suggests that when 2 Regressions with annual data were also conducted. The estimated regression coefficients from the annual data were not statistically significant. Several of the independent variables, including BWPR, Octl, and Grzd, very likely contain measurement error that may bias the estimates downward. Regressions with biennial data were also conducted. In general, the estimates were similar, but smaller in absolute value, to those obtained with five-year moving average data. Thus, as a result of the errors in variables problem, and to facilitate communication with production scientists, fits from five-year moving averages are reported.
Wheat Yield Response
Epplin
341
Table 1. Extended
Model E
Model F
Model G
Model H
Model I
Model J
Model K
27.73 (3.74) 0.2590 (2.15)
38.58 (30.38) 0.2682 (15.50) 0.0472 (1.66) -0.3970 (-19.04)
26.98 (14.95) 0.2605 (8.03) 0.0733 (1.49)
6.02 (0.69) 0.3021 (2.33) 0.1204 (4.20)
38.34 (27.55) 0.2856 (24.93)
41.47 (13.95) 0.2784 (13.33)
35.00 (4.90) 0.2554 (4.92)
-0.3190 (-6.59) -0.0566 (-1.58)
-0.2798 (-9.39)
0.915
-0.0182 (-0.53)
0.1349 (1.51)
-0.0630 (-0.79) 0.950
0.879
0.946
-0.3866 (-19.47)
0.950
0.946
-0.2631 (-8.47) -0.0654 (-0.80) 0.872
adjusted for changes in production practices wheat yield per harvested acre increased at a rate of approximately 0.29 bu./ac. per year over the time period. The beef value gain to wheat price ratio variable (BWPR) was included in eight models. Across the eight models the estimated coefficient ranges from an insignificant 0.05
in Model F to a significant 0.20 in Model M. The estimated coefficient is 0.13 in the full model. The positive sign was not expected. The positive sign indicates that grain yield increased with an increase in the value of fall/winter forage relative to the value of grain. However, over the decade from 1986-95, while wheat grain trend yield declined, the BWPR variable ranged from a low of 46 in 1992 to a high of 53 in 1994. This Table 1. Continued Independent Variables Intercept Time trend Trd Beef value gain to wheat price ratio BWPR Planted prior to 1 October (%) Octl Harvested acres also grazed (%) Grzd Harvested (%) Hrvt Adjusted R2
Model L
Model M
Model N
36.22 (23.05) 0.2646 (17.88) 0.0516 (2.17) -0.3034 (-6.77) -0.0774 (-2.27)
24.97 (5.18) 0.2147 (5.05) 0.1989 (9.90) -0.3558 (-7.30)
20.17 (1.80) 0.2808 (6.75) 0.1105 (1.40)
0.0803 (1.49) 0.956
0.963
-0.2920 (-9.32) 0.0658 (0.63) 0.876
Model 0
Model P
-0.3161 (-6.39) -0.0577 (-1.57) -0.0199 (-0.62)
22.81 (5.62) 0.2924 (21.48) 0.1331 (4.44) -0.2729 (-7.86) -0.1195 (-4.56) 0.1157 (3.28)
0.949
0.965
39.95 (13.82) 0.2757 (13.78)
342 December 1997
Journal of Agricultural and Resource Economics
difference of seven times the estimated coefficient of 0.13 would account for a yield difference of only 0.91 bu./ac. This suggests that wheat yield response in the region was influenced to a larger degree by factors other than the relative values of wheat forage
and wheat grain. The planting date variable (Octl) was included in eight of the models. It is robust and significantly negative in each. The regression estimates range from -0.40 to -0.27 for the full model. Over the time period of the data, state average wheat grain yields were
inversely related to the percentage of the state's wheat acres planted prior to 1 October. This result, that early planting is associated with lower grain yields, is consistent with published reports of replicated field trials. For every 1% increase in acres planted prior to 1 October, the state average grain yield per harvested acre decreased by approximately 0.27 bu. The percentage of acres planted prior to 1 October ranged from 32 to 54. The low of 32% is from the 1985 observation and the high of 54% is from the 1995 observation. Based upon the estimate, this change in the percentage planted prior to 1 October could account for a decrease in state average wheat grain yield of approximately 6 bu./ac.
The proportion of acres harvested for grain that had been winter grazed (Grzd) was also included in eight of the models. The sign is negative in all cases and significantly negative in six of the eight models. Winter grazing is associated with lower grain yield. This variable is correlated with the planting date variable (Octi) and is less significant in models that include planting date (I, L, 0, and P). For the full model (Model P) the estimated coefficient is -0.12. The proportion of the crop harvested for grain that had
been winter grazed increased from 11% (5YMA) in 1986 to 29% in 1995. This change could explain a decrease in state average yield of about 2 bu./ac. The percentage of wheat acres planted that were harvested for grain was represented by the Hrvt variable that was included in eight models. The estimated coefficient was not significant in seven of the eight models and ranged from -0.07 in Model K to +0.13 in Model H. In the full model the estimate was significant and +0.12. The percentage of crop planted that was harvested for grain changed from 70% (5YMA) in 1986 to 75%
in 1995. Based on the full-model estimate this change would explain an increase in state average yield of a little more than 0.5 bu./ac.
Summary and Conclusions From 1986 to 1995, the Oklahoma 5YMA wheat grain yield decreased from 32.6 to 26.7 bu./ac. (5.9 bu.). This decline in yield occurred after approximately 10% of the wheat acreage base had been removed from production and placed in the CRP. The objective of the research reported in this article was to determine why wheat grain trend yield declined. There are two rather noticeable aberrations in the Oklahoma 5YMA wheat grain yield per harvested acre trend over the 30 years prior to 1995. Yield increased dramatically in excess of trend from 1978 to 1983 and then decreased from 1986 to 1995. Both deviations from the long-term trend are associated with changes in the proportion of acres planted prior to 1 October and the proportion of the crop used to produce both forage and grain. Changes in federal wheat commodity program provisions are associated with the changes in production practices. Producers responded to program changes by expanding acreage base when permitted to do so. The 50% increase in base acres from
Epplin
Wheat Yield Response
343
1978 to 1984 was associated with a decline in the proportion planted early and greater yields. Farmers responded to incentives provided by the ARP, PLD, PIK, and 0/92 programs by planting earlier (to produce more winter forage) and by changing the proportion
of the crop harvested for grain that had also been winter grazed. The results of the regression models indicate that changes in planting date during the decade prior to 1995 accounted for a 6 bu./ac. decrease in the state average yield. Changes in the proportion of the wheat harvested that had also been winter grazed accounted for an additional 2 bu./ac. yield decrease. The consequences of improvements in technology, research, and education programs, as measured by the linear trend variable,
were positive. The regression estimate for the linear trend variable indicated a 0.29 bu./ ac. per year increase. However, in the decade from 1986 to 1995 this increase was
overwhelmed by the yield decreases resulting from changes in production practices. Researchers have understood for some time that farmers respond to acreage reduction programs by idling their least productive land and by allocating the services from their fixed resources to those acres retained in production. These changes result in increased yields per harvested acre. The research reported in this article confirms that farmers change production practices in response to commodity programs. However, the change
may be rather complicated. Government programs have influenced wheat production in Oklahoma since the 1930s. Over the last two decades, several programs, including ARP, PLD, PIK, and 0-50/92, have influenced the number of wheat acres planted, acres harvested for grain, and grain yield per harvested acre. In addition to these short-term programs, the CRP removed almost 10% of wheat base acres from production. Part of the yield decline from 1986 to 1995 can be attributed to changes in government policy. However, the rapid yield
increase from 1978 to 1984 can also be attributed to policy changes. The Federal Agriculture Improvement and Reform (FAIR) Act of 1996 was promoted as legislation that would enable farmers to base planting and grazing decisions on market incentives rather than commodity programs. The incentive to build and maintain base acres has been removed. Acres that in recent decades have been seeded to wheat to maintain base and used to produce forage but not harvested for grain may now be seeded to another crop. The consequences of these changes on planting date and grazing prac-
tices are unknown. However, in the absence of external programs, the state average wheat yield may be expected to return to the long-term trend line. [Received January 1997; final revision received July 1997.]
References Bloyd, B. L. State Statistician. Oklahoma Agricultural Statistics Service, Oklahoma City. Personal communications, 1996. Christiansen, S., T Svejcar, and W. A. Phillips. "Spring and Fall Cattle Grazing Effects on Components and Total Grain Yield of Winter Wheat." Agronomy J. 81(1989):145-50. Ferreira, K. L., T. E Peeper, and F M. Epplin. "Economic Returns from Cheat (Bromus secalinus) Control in Winter Wheat (Triticum aestivum)." Weed Tech. 4(April-June 1990):306-13.
Green, R. C. "Program Provisions for Program Crops: A Database for 1961-90." Staff Rep. No. AGES 9010, U.S. Department of Agriculture, Washington DC, March 1990. Heer, W. E, and E. G. Krenzer Jr. "Soil Water Availability for Spring Growth of Winter Wheat (Triticum aestivum L.) as Influenced by Early Growth and Tillage." Soil & Till. 14(1989):185-96.
344 December 1997
Journal of Agricultural and Resource Economics
Holliday, R. "Fodder Production from Winter-sown Cereals and Its Effect upon Grain Yield." Field Crop Abs. 9(1956):129-35, 207-13. Love, H. A., and W. E. Foster. "Commodity Program Slippage Rates for Corn and Wheat." West. J. Agr. Econ. 15(December 1990):272-81. Martin, J. H. "Factors Influencing Results from Rate- and Date-of-Seeding Experiments with Wheat in the Western United States." J. Am. Soc. Agron. 18(March 1926):193-225. Rausser, G. C., D. Zilberman, and R. E. Just. "The Distributional Effects of Land Controls in Agriculture." West. J. Agr. Econ. 9(December 1984):215-32. Redmon, L. A., G. W. Horn, E. G. Krenzer Jr., and D. J. Bernardo. "A Review of Livestock Grazing and Wheat Grain Yield: Boom or Bust?" Agronomy J. 87(March-April 1995):137-47. Tweeten, L. Foundations of Farm Policy. Lincoln: University of Nebraska Press, 1970. White, K. J., D. Wong, D. Whistler, and S. A. Haun. Shazam User's Reference Manual, Version 7.0. New York: McGraw-Hill, 1993. Witt, M. D. "Delayed Planting Opportunities with Winter Wheat in the Central Great Plains." J. Production Agr. 9(January-March 1996):74-78.