When Big Data Fails! Relative success of adaptive agents using coarse-grained information to compete for limited resources V. Sasidevan,1, ∗ Appilineni Kushal,2, † and Sitabhra Sinha1, ‡
arXiv:1609.08746v1 [physics.soc-ph] 28 Sep 2016
1
The Institute of Mathematical Sciences, CIT Campus, Taramani, Chennai 600113, India. 2 Indian Institute of Science, C V Raman Road, Bangalore 560012, India. (Dated: September 29, 2016)
The recent trend for acquiring big data assumes that possessing quantitatively more and qualitatively finer data necessarily provides an advantage that may be critical in competitive situations. Using a model complex adaptive system where agents compete for a limited resource using information coarse-grained to different levels, we show that agents having access to more and better data can perform worse than others in certain situations. The relation between information asymmetry and individual payoffs is seen to be complex, depending on the composition of the population of competing agents. PACS numbers: 02.50.Le,87.23.Ge,89.75.-k
Agents in a population often coordinate their actions with that of their neighbors resulting in striking forms, such as in swarming and flocking [1, 2]. Typically, in such cases, individuals use information obtained from their local environment to adjust their actions in order to achieve some desired objective [3–6]. Emergent coordination is therefore crucially dependent on the information acquired by an agent and its ability to process it appropriately, which determines its future course of action. Often the objectives of different agents in a system may not be compatible with each other, for instance when they are competing for a limited resource. Examples of such situations are abundant in nature, where individuals vie for food, shelter and mating opportunities. Even in our more complex social environment, we regularly come across instances of such competition, e.g., people trying to choose the least congested route through an urban road network or anticipating whether the relative demand for a financial asset will increase, so as to profit by buying or selling it at the present [7]. In these settings, individuals may use strategies which project information about past experiences to make decisions about the future course of action [8–10]. Conventional wisdom suggests that the relative success of an agent in meeting its objective (i.e., gaining access to the scarce resource) would increase with the quality and quantity of available data that would form the basis for its decisions. Indeed the recent excitement about “big data” is partially based on the premise that access to more and better information provides a competitive advantage [11]. In this paper we show that agents using quantitatively more data that is also finely resolved (and hence also qualitatively superior) may not actually do better - and can in fact lead to significantly worse payoffs - in situations where they are competing with agents that have access to less, as well as more coarse-grained, information. This surprising result arises from emergent coordination in the collective activity of agents who use information of a particular quality (i.e., level of coarse-graining) leading
to macroscopic patterns of behavior that may be discernible from the data only at a different level of coarsegraining. Thus, if there are other agents in the population who have access to information about the system at this latter coarse-grained level, they can potentially exploit this predictability to their advantage. We show this using a model of preferential access to a limited resource. This comprises a complex adaptive system of agents, each attempting to maximize their payoffs. The agents are distinguished in terms of the quality and quantity of information that they use to choose between several possible options. The setting allows us to vary the composition of the population in terms of the different types of agents, each of whom exclusively uses one of two types of historical data about the system that represent the two extremes of coarse-graining. We show that the relation between information asymmetry and the performance of agents is a complex one, depending on the relative fraction of the population that each type of agents constitute. Thus, the utility of “big-data” is contingent upon the precise nature of the ecosystem comprising all its competitors that an agent is located in. The premise that more and better information will automatically result in better performance, e.g., by improving predictive power, therefore needs to be treated with caution. This is especially true for competitive situations where adaptation through learning is involved that are ubiquitous in systems around us, such as financial markets [12, 13]. To investigate how information asymmetry between agents affect their performance, specifically when different agents use information at diverse levels of coarsegraining, we focus on a complex adaptive system where agents compete for a limited resource. Here the heterogeneous agents use the different types of information that they have access to for the same purpose, viz., to have preferential access to the resource. In particular, we use the paradigm of the Minority Game (MG) [14–16] which has all the ingredients to address the above question in a quantitative manner. In addition, it has the advan-
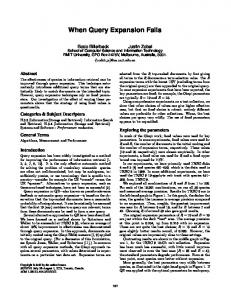
2 tage that the classical version, in which agents use information only at a single level of coarse-graining, is wellunderstood and can be used as a benchmark for the more complex situation that is investigated here. We consider a population of an odd number N of agents who independently and simultaneously choose between two options (A and B, say) in each round. The option that is chosen by fewer agents is considered the better choice (outcome) in each round and leads to a higher payoff (say, 1), while those who had chosen the alternative receive a lower payoff (say, 0). We assume that the population consists of different types of agents distinguished in terms of the data that they have access to, which is coarse-grained to different levels (Fig. 1). The level of coarse-graining k (2 ≤ k ≤ N + 1) is defined in terms of the extent to which an agent can resolve the number of agents (NA , say) opting for a particular choice (A). For example, an agent with k = 2, the coarsest level of resolution, can only distinguish between NA > N/2 and NA < N/2 (i.e., whether A was chosen by the majority or not) in a particular round [14]. Conversely, the finest level of resolution corresponds to k = N + 1, for which an agent can determine the exact number of agents NA opting for A in a round [17]. Any value of k between these two extremes represents intermediate levels of coarse-graining where the agent can only distinguish whether, in each round, NA belongs to any one of the intervals [iN/k, (i + 1)N/k] where i = 0, . . . , k − 1. The agents of each type use the appropriately coarse-grained data to determine their choice of action in the next round. For clarity we focus on the interaction between only two types of agents corresponding to the extremes of coarse-graining, viz., k = 2 (which we designate as Type 1 agents) and k = N + 1 (Type 2 agents). The memory length of each type of agent indicates the number of past rounds whose information they retain, and is denoted by m1 (m2 ) for Type 1 (Type 2) agent. Each agent uses strategies that map the information about past events (m1 bits for Type 1 agent, m2 log2 (N + 1) bits for Type 2 agent) to the choice of action in the next round (i.e., A or B). Each agent initially chooses at random a small sample of strategies (e.g., of size 2 as here) from the set of all possible strategies, m1 m2 which is of size 22 for a Type 1 agent and 2(N +1) for a Type 2 agent. At each round, an agent scores the strategies according to the potential payoffs that would have been obtained by using them in the previous rounds (feedback), and uses the one having the highest score. In order to study how the relative performance of agents in choosing their optimal future action is affected when different agents have access to data with different levels of coarse-graining (and therefore, qualitatively distinct information), we first focus on the simplest case of a single Type 1 agent with memory length m1 interacting with a population of N − 1 Type 2 agents with memory length m2 . Note that both types of agents use the
... NA NA NA NA t−3 t−2 t−1 t
History : binary
... A
B
B
detailed
A
Type 2 {k=N + 1} Agents Feedback
Type 1 {k=2} Agents Feedback ...
Actions
A
B
B ...
...
B
A
B
...
Outcome
Figure 1: A schematic representation of a complex adaptive system comprising N agents that are competing for a limited resource. Every agent has to choose between two possible actions (A or B) at each round, with the option chosen by the lesser number of agents being the better choice (outcome) in that round. The agents decide on their choice using strategies based on information about the previous m rounds’ collective choice dynamics, which could result in the system being in one of k possible states (2 ≤ k ≤ N + 1, depending on the level of coarse-graining) at each round. Here agents have been distinguished into two classes (Types 1 and 2) according to the two extreme levels of coarse-grained information, i.e., k = 2 and k = N + 1, respectively, that they have access to. After each round t, the detailed information about the total number of agents choosing a specific action A (say), NtA , that is accessed only by Type 2 agents, as well as, binary information, viz., the choice of the minority (A or B) which is accessed only by Type 1 agents, are added to the history of outcomes. The information about the outcome is also used as feedback for adaptive selection of strategies by the agents.
different information available to them (representing the two extremes of coarse-graining) with the identical aim of predicting the outcome in the next round. One may naively expect that agent(s) having more information at their disposal (e.g., as measured in units of bits) will have an advantage over the other type of agents. Consequently, it would have been expected that when the number of bits, m1 , in the information accessible to the Type 1 agents is less than m2 log2 (N +1), the corresponding quantity for the Type 2 agents, then the latter would have obtained a relatively higher payoff. This would also be in accordance with the intuitive notion that the highly resolved detailed data of Type 2 agents is qualitatively better than the low-resolution outcome data of Type 1 agents. However, the mean payoffs of the two types of agents shown in Fig. 2 for different memory lengths m1 and population sizes N reveals that the actual behavior is more complex. The most surprising outcome for the case when the Type 2 agents have memory length m2 = 1 (Fig. 2) is that the Type 1 agent is able to acquire a relatively higher payoff at low values of m1 even though the information
3 Type 1 agent Type 2 agent
m2 = 1
Avg payoffs P1, P2
0.5
0.4 10 8 6 Type 1 agent memory m1
3
4
10
2 0
2
10
Number of agents N
Figure 2: Average payoffs P1 , P2 of Type 1 and Type 2 agents (respectively) shown as a function of the memory length m1 of a single Type 1 agent interacting with N − 1 Type 2 agents with memory length m2 = 1 for different population sizes N . Note that when the lone Type 1 agent has a lower memory length m1 , it has a relative advantage over Type 2 agents, receiving the highest payoff when m1 = 2. Payoffs are averaged over 104 iterations in the steady state and over 100 different realizations.
accessible to it is highly coarse-grained and quantitatively much less (in terms of bits) compared to the rest of the population. Moreover, the range of m1 over which the Type 1 agent does better than Type 2 agents is seen to increase with N . Thus, the success of an agent in a complex adaptive system, where the information accessible by the individual entities differ both in terms of quality and quantity, is not entirely determined by the amount and resolution of the data at its disposal. Instead, as we show below, it depends more on whether discernible patterns in the behavior of the population are present at the level of coarse-graining it has access to. When the memory length of the Type 2 agents is increased to m2 = 2 (see Supplementary Information), the Type 1 agent is no longer observed to have a higher payoff than the rest of the population, regardless of its memory length m1 . Note that Type 2 agents attain the highest degree of emergent coordination among themselves for m2 = 2 independent of N [17]. Thus, it is not surprising that the lone Type 1 agent will not be able to outperform the optimally coordinated population of Type 2 agents. However, as we shall show below, introducing multiple Type 1 agents makes it possible for these mutually competing individuals to develop emergent coordination within themselves by which they can outperform Type 2 agents with m2 = 2. If m2 > 2, the behavior of the Type 2 agents is indistinguishable from agents randomly choosing between A and B [17]. As there is no predictability in the time-series available to the Type 1 agent that it can exploit, it will on average receive essentially the same payoff as the rest
of the population. The opposite case of a single Type 2 agent interacting with a population of N − 1 Type 1 agents shows that the lone Type 2 agent will perform better than the rest of the population when m1 is low, independent of m2 (see Supplementary Information). This can be explained from the observation that at low m1 , the behavior of a population of Type 1 agents has a periodic pattern in the number choosing a specific option - which is precisely the information accessible by the Type 2 agent. It is therefore optimally placed to exploit the predictability to its advantage. To explain the relative performance of different types of agents having access to information at the two extreme levels of coarse-graining, we focus on the information content in the history of outcomes that can be exploited by the agents to their advantage. As we shall see, the collective action of any one type of agents may result in predictable patterns at the other level of coarsegraining and hence observable only to these other agents. This “useful” information content above the noise level can be quantified by measuring the predictability of a particular choice (say A) being the outcome in a particular round, given the history of past outcomes. This history can be either the binary sequence of outcomes A,B or the detailed time-series of the number of agents {NtA } choosing a particular option A, the former (latter) being accessible only to a Type 1 (Type 2) agent. We can therefore P define two distinct information measures, viz., H1 = uL P (uLbin )[P (A|uLbin ) − (1/2)]2 , bin P and H2 = uL P (uLdet )[P (A|uLdet ) − (1/2)]2 . Here, det uLbin is the binary sequence of outcomes for the previous Lbin rounds while uLdet is the sequence of integers, each lying between 0 and N , representing the number of agents choosing A in the previous Ldet rounds. The probability with which a particular sequence of L successive outcomes is observed is denoted as P (uL ), while P (A|uL ) represents the conditional probability that the outcome A follows the sequence uL . We first consider the case of a population comprising only Type 2 agents having memory length m2 . The collective behavior of such agents generates a history of binary outcomes whose information content H1 is shown in Fig. 3 (a) for m2 = 1 and 2. Note that this information cannot be used by the Type 2 agents themselves, whose strategies are based on uLdet but is accessible in principle to a hypothetical Type 1 agent whose strategies use uLbin . We observe that H1 increases with the length of the binary sequence, Lbin , over the range of sequence lengths considered here, with H1 = 0 when the history is restricted to the immediately preceding round, i.e., Lbin = 1. Thus, if a Type 1 agent with memory length m1 is introduced into this population, it can make use of the predictability present in the binary sequence accessible to it when m1 > 1. As m1 increases, the num-
H 1 ( × 10−2 )
4
3 2
m2 = 1
1
m2 = 2
0 0
2
10
H 1, H2 ( × 10−2 )
a
5
4 6 Sequence length Lbin
8
10
8
10
b H1 H2
0 0
2
4 6 Type 1 agent memory m1
Figure 3: (a) Information content H1 of the binary sequence containing the history of outcomes for a game involving only Type 2 agents shown as a function of the sequence length Lbin . (b) Information content of the binary sequence, H1 , and that of the time series containing detailed information (exact number opting for a particular choice) of sequence length Ldet = 1, H2 , for a game involving only Type 1 agents, shown as a function of the memory length m1 of the agents. The number of agents considered in both (a) and (b) is N = 255. Results shown are averaged over 100 realizations.
ber of possible strategies that can be used by the Type m1 1 agent increases exponentially (= 22 ). It therefore becomes progressively less likely that the agent will randomly pick the strategy that can optimally exploit the predictability present in uLbin . This implies that the highest payoff of Type 1 agent is achieved for the lowest value of m1 having non-zero information content, i.e., m1 = 2, as is indeed confirmed by Fig 2. We next consider the other extreme case represented by a population comprising only Type 1 agents having memory length m1 . This situation has been studied earlier in the context of understanding how the collective behavior of such agents undergoes a phase transition as m1 is varied [18, 19], where the focus is on the information content H1 of the binary sequence of outcomes available to these agents [19–22]. Here our focus is instead on the information content H2 of the detailed time-series uLdet recording the number of agents choosing a particular option (shown in Fig. 3 (b) for Ldet = 1). It is important to note that the latter information cannot be used by the Type 1 agents whose interactions produce it, as their strategies are based on uLbin . However, it is accessible to a hypothetical Type 2 agent with an appropriate memory length, viz., m2 = Ldet . We observe that H2 is non-zero even when H1 = 0 at low values of the memory length m1 . This indicates that the detailed history uLdet contains potential predictability that can be exploited by a Type 2 agent. Thus, both cases of homogeneous agent type populations considered above demonstrates that the
collective behavior of agents having access to information coarse-grained at a specific level can give rise to some amount of predictability that can be perceived only in the information available at a different level of coarsegraining. The above arguments explain the performance of a single agent of one type interacting with a population consisting exclusively of agents of the other type. However, in reality, the number of each type of agents having access to data at different levels of coarse-graining can be arbitrary. We shall now, therefore, consider the situation where the relative fraction of the two types of agents present in the population is varied between the two extreme cases considered earlier. The important effect of introducing more than one agent of a specific type into the population is that effective coordination between these agents can emerge, resulting in enhanced payoffs for them. We gradually vary the fraction f1 of Type 1 agents in a population of total size N comprising agents of both Types 1 and 2. Fig. 4 shows the average payoffs P1 , P2 for agents of each type respectively, for different values of f1 and memory length m1 of Type 1 agents, keeping the memory length of Type 2 agents fixed [viz., m2 = 1 (a) and = 2 (b)]. As shown earlier for the case of a single Type 1 agent in a population of Type 2 agents, here also we see that Type 1 agents can outperform Type 2 agents even when the quantity of information (measured in bits) available to the former is much less than that for the latter. This is particularly striking when the memory length m1 of Type 1 agents is low, i.e., information content of each is m1 bits ≪ m2 log2 (N + 1) bits, which is the information content of a Type 2 agent. Fig. 4 shows that, in this low m1 regime, Type 1 agents when present in small numbers (i.e., low f1 ) can receive higher payoffs than the Type 2 agents who form the bulk of the population. We expect the situation that we considered earlier, viz., a single Type 1 agent playing against N − 1 Type 2 agents, to occur when f1 → 0. Thus, we expect the Type 1 agent to achieve best performance (i.e., maximum payoff) for a memory size m∗1 = 2 which is indeed observed. On the other hand, as f1 → 1 the setting is that of a conventional MG between Type 1 agents where the maximum payoff occurs for m∗1 ≃ log2 (0.337N ) [19] which is also seen. Indeed, for any fraction 0 < f1 < 1 of Type 1 agents, their best performance is achieved for a memory size m∗1 that lies between 2 and log2 (0.337N ) [indicated by the broken curves in Fig. 4]. Thus, having multiple Type 1 agents in the population can help them achieve a higher payoff than they are capable of by playing singly against a population of Type 2 agents, suggesting an important role of emergent coordination among a group of competing agents who are distinguished by the nature of information available to them. A simple qualitative argument for this locus of maximum payoffs for Type 1 agents in the (m1 , f1 ) parameter
5
a
Type 1 agent Type 2 agent
m2 = 1
Avg payoffs P1, P2
0.5
0.45
0.4
0.35 10 Type 1 agent memory m1
5 0
m2 = 2
b
0
1 0.6 0.8 0.4 0.2 Type 1 agent fraction f1
Avg payoffs P1, P2
0.5
0.45
0.4
0.35 10 Type 1 agent memory m1
5 0 0
0.2
0.4
1 0.8 0.6 Type 1 agent fraction f1
Figure 4: The average payoffs P1 , P2 of Type 1 (shown in blue) and Type 2 agents (red) comprising a population of size N (= 255) for different population fractions f1 and memory length m1 of the Type 1 agents. The memory length of the Type 2 agents are fixed at m2 [= 1 for (a) and = 2 for (b)]. The contours separate the regions in the (m1 , f1 ) parameter space where Type 1 agents have a relative advantage over Type 2 agents and vice versa. The broken curve represents the optimal population fraction f1∗ of Type 1 agents with a given memory length m1 at which they receive the highest payoff. The dotted curve is the value of m1 at which N f1 Type 1 agents are expected to have maximum payoff in absence of any Type 2 agents. Payoffs are averaged over 104 iterations in the steady state and over 100 different realizations.
space is as follows. Ignoring for a moment the presence of Type 2 agents, we can consider the population to exclusively comprise f1 N Type 1 agents with memory size m1 . This population will achieve their highest payoff at m1 ≈ log2 (0.337N f1) [for f1 > 3/N , so that m1 > 0] shown by the dotted curves in Fig. 4. The presence of Type 2 agents results in a shift towards lower values of the optimal population fraction f1∗ of Type 1 agents (as shown by the empirically obtained curves of maximum payoff of Type 1 agents represented by the broken curves). Note that this argument does not say anything about the relative performance of the two types of agents. The relatively higher payoff of Type 1 agent (with low
m1 ) compared to Type 2 agents, despite the latter having quantitatively more information for decision-making, is thus an extremely surprising outcome that emerges from the collective dynamics of interactions between agents with access to information coarse-grained at different levels. Let us now consider the performance of the Type 2 agents. When playing against Type 1 agents with low memory length m1 , Type 2 agents achieve their highest payoff when f1 → 1, i.e., when they are present in extremely small numbers in the population. In other words, to achieve the best performance out of availability of detailed data, it is important to have the size of the group to which this data is available as small as possible in this regime of low m1 . As more agents have access to this data (i.e., decreasing f1 ), their payoff is eroded until they actually perform worse than those having coarsergrained data, i.e., Type 1 agents. Thus, access to more and better data is not by itself a determining factor for success in a complex adaptive situation. As the memory length m1 of the Type 1 agents increases, the optimal population fraction at which Type 2 agents achieve the highest payoff decreases from the neighborhood of f1 = 1. In fact, in the case of Type 2 agents having memory length m2 = 2 (the optimal memory length for a population exclusively composed of such agents), their best performance is achieved as f1 → 0. Thus, in this high m1 regime (m1 ≥ 6 for the case of m2 = 2), Type 2 agents achieve high payoffs by dominating the population. By contrast, Type 1 agents do better than Type 2 agents for large f1 as a result of emergent coordination within their group. Indeed, in this regime, for any given m1 the payoff of Type 1 agents increases with f1 . Thus, the outcome is not symmetric for agents having access to information at the two extreme levels of coarse-graining. Note that as m1 is increased more and more, the strategy space for Type 1 agents become so large that the action of the agents essentially resemble randomly choosing between the two options. If m2 is also sufficiently large (> 2), both types of agents achieve similar payoffs, equal to that obtained by a random choice strategy (see Supplementary Information). To conclude, we have shown that information asymmetry among agents in a complex adaptive system can have surprising consequences. Specifically, in a system where agents compete for a limited resource using strategies based on information about the collective behavior in previous interactions, asymmetry arising from individuals having access only to data coarse-grained to different levels can result in agents with more and better data performing worse than others under certain circumstances. Such counter-intuitive effects arise from predictable patterns emerging in the collective information about the system at a certain level of coarse-graining and thus discernible only to agents privy to that level. This provides them a competitive advantage when the pop-
6 ulation is dominated by agents of a different type who do not have access to the coarse-graining level at which such patterns generated by their own collective activity are apparent. The relation between the relative performance of the different types of agents and the nature of information asymmetry is therefore crucially dependent on the exact composition of the population to which they belong. Our results imply that striving to acquire and process ever increasing quantities of data in the hope of making more accurate predictions in complex adaptive systems, such as financial markets, may sometimes be counter-productive. While concerns about the potential pitfalls of “big data” have been voiced earlier [23], we provide possibly the first rigorous demonstration using a quantitative model of how such a failure can come about. The insights gained from our study are quite general and should apply to the broader context of strategic interactions between a large number of adaptive agents. We would like to thank Shakti N. Menon for helpful discussions. This work was supported in part by the IMSc Econophysics project (XII Plan) funded by the Department of Atomic Energy, Government of India. We thank IMSc for providing access to the supercomputing cluster “Satpura”, which is partially funded by DST.
∗ † ‡
[1] [2] [3] [4] [5] [6] [7] [8] [9] [10] [11] [12] [13]
[14] [15]
[16]
Electronic address:
[email protected] Electronic address:
[email protected] Electronic address:
[email protected] C. Castellano, S. Fortunato and V. Loreto, Rev. Mod. Phys. 81, 591 (2009). F. Vanni, M. Lukovic and P. Grigolini, Phys. Rev. Lett. 107, 078103 (2011) M. A. Nowak and R. M. May, Nature (Lond.) 359, 826 (1992). I. Couzin, Nature (Lond.) 445, 715 (2007). D. J. G. Pearce, A. M. Miller, G. Rowlands and M. S. Turner, Proc. Natl. Acad. Sci. USA 111, 10422 (2014). F. L. Pinheiro, F. C. Santos and J. M. Pacheco, Phys. Rev. Lett. 116, 128702 (2016). D. Challet, A. Chessa, M. Marsili and Y-C. Zhang, Quant. Fin. 1, 168 (2001). H. Simon, Quart. J. Economics 69, 99 (1955). W. B. Arthur, Am. Econ. Rev. 84 406 (1994). W. B. Arthur, Science 284, 107 (1999). C. A. Mattmann, Nature (Lond.) 493, 473 (2013). M. Potters, R. Cont and J. Bouchaud, EPL 41, 239 (2007). S. Sinha, A. Chatterjee, A. Chakraborti and B. K. Chakrabarti, Econophysics: An introduction (WileyVCH, Weinheim, 2010). D. Challet and Y-C. Zhang, Physica A 246, 407 (1997). E. Moro, in Advances in Condensed Matter and Statistical Mechanics (Eds. E. Korutcheva and R. Cuerno) (Nova Science Publishers, New York, 2004). D. Challet, M. Marsili and Y-C. Zhang, Minority Games: Interacting agents in financial markets (Oxford University Press, Oxford, 2005).
[17] V. Sasidevan, J. Stat. Mech. 6, 073405 (2016). [18] D. Challet and Y-C. Zhang, Physica A 256, 514 (1998). [19] D. Challet, M. Marsili and R. Zecchina, Phys. Rev. Lett. 84, 1824 (2000). [20] D. Challet and M. Marsili, Phys Rev. E 60, R6271 (1999). [21] N. J. P. Hui, D. Zheng and M. Hart, J. Phys. A 32, L427 (1999). [22] D. Challet, M. Marsili and Y-C. Zhang, Physica A 276, 284 (2000). [23] N. Silver, The Signal and the Noise (Penguin, New York, 2012).
7
SUPPLEMENTARY INFORMATION
Type 1 agent Type 2 agent
m2 = 2
Avg payoffs P1, P2
0.5
0.4 10 8 6 3
4 Type 1 agent memory m1
10
2
Number of agents N
2
10
0
Figure S1: Average payoffs P1 , P2 of Type 1 and Type 2 agents (respectively) shown as a function of the memory length m1 of a single Type 1 agent interacting with N − 1 Type 2 agents with memory length m2 = 2 for different population sizes N. Note that when the lone Type 1 agent does not have any relative advantage over the Type 2 agents. However, it still receives its highest payoff when m1 = 2 (as in Fig. 2 for m2 = 1). Payoffs are averaged over 104 iterations in the steady state and over 100 different realizations.
Type 1 agent Type 2 agent
m2 = 1
Avg payoffs P1, P2
0.55 0.5 0.45 0.4 0.35 10 8 6 4 Type 1 agent memory m1
3
10 2 0
2
10
Number of agents N
Figure S2: Average payoffs P1 , P2 of Type 1 and Type 2 agents (respectively) shown as a function of the memory length m1 of a population of N − 1 Type 1 agents interacting with a single Type 2 agent with memory length m2 = 1 for different values of N . Note that the lone Type 2 agent enjoys a significant advantage over the rest of the population for low values of m1 . The trend of the payoff of the Type 2 agent as a function of m1 appears to mirror that of the Type 1 agents. Payoffs are averaged over 104 iterations in the steady state and over 100 different realizations. A similar profile is seen when the memory length of the Type 2 agents is m2 = 2.
8 Type 1 agent Type 2 agent
m2 > 2
Avg payoffs P1, P2
0.5
0.45
0.4
0.35 10 5 Type 1 agent memory m1
0.6
0
0
0.2
0.8
1
0.4 Type 1 agent fraction f1
Figure S3: The average payoffs P1 , P2 of Type 1 (shown in blue) and Type 2 agents (red) comprising a population of size N (=255) for different population fractions f1 and memory length m1 of Type 1 agents. As Type 2 agents with sufficiently large memory length (m2 > 2) effectively use random choice strategy [17], here the Type 2 agents are assumed to be randomly choosing between the two possible options. The contours separate the regions in the (m1 , f1 ) parameter space where Type 1 agents have a relative advantage over Type 2 agents and vice versa. The broken curve represents the optimal population fraction f1∗ of Type 1 agents with a given memory length m1 at which they receive the highest payoff. The dotted curve is the value of m1 at which N f1 Type 1 agents are expected to have maximum payoff in absence of any Type 2 agents. Payoffs are averaged over 104 iterations in the steady state and over 100 different realizations.


![[Download-PDF] Big Data: Using Smart Big Data ... - Google Sites](https://m.moam.info/img/260x300/download-pdf-big-data-using-smart-big-data-google-_6478ba08097c4796708d2059.jpg)
![[PDF] Download Big Data: Using SMART Big Data ... - Google Sites](https://m.moam.info/img/260x300/pdf-download-big-data-using-smart-big-data-google-_6477a7e0097c474c228c44a1.jpg)
![[PDF] Download Big Data: Using SMART Big Data, Analytics and ...](https://m.moam.info/img/260x300/pdf-download-big-data-using-smart-big-data-analyti_6477c3c2097c4796708c1071.jpg)

![[PDF] Download Big Data: Using SMART Big Data ... - Google Sites](https://m.moam.info/img/260x300/pdf-download-big-data-using-smart-big-data-google-_64786452097c474c228d15e6.jpg)


![[PDF]Download Big Data: Using SMART Big Data ... - Google Sites](https://m.moam.info/img/260x300/pdfdownload-big-data-using-smart-big-data-google-s_6477f551097c4796708c472d.jpg)
![[PDF] Download Big Data: Using SMART Big Data ... - Google Sites](https://m.moam.info/img/260x300/pdf-download-big-data-using-smart-big-data-google-_6476fd33097c474b228b641e.jpg)