WHERE SIMPLE SUM AND DIVISIA MONETARY AGGREGATES PART: ILLUSTRATIONS AND EVIDENCE FOR THE UNITED STATES
by Michael T. Belongia Otho Smith Professor of Economics Department of Economics 374 Holman Hall University of Mississippi University, MS 38677 PH: 662-915-7785 e-mail:
[email protected] Presented at the meetings of the Eastern Economic Association, New York, NY, March 4, 2005
ABSTRACT: Empirical studies of money continue to use the Federal Reserve's official simple sum indexes, apparently in the belief that their behavior differs little from patterns exhibited by superlative indexes of money. This paper illustrates specific periods when this assumption is refuted and offers explanations for why simple sum and superlative indexes of money are likely to move differently at economic turning points. JEL codes: E0, E4, E5, B0
Financial support was provided by the Robert M. Hearin Foundation. Barry Jones made helpful comments and generously contributed data for several of the figures in this paper. Any errors are solely the responsibility of the author.
WHERE SIMPLE SUM AND DIVISIA MONETARY AGGREGATES PART: ILLUSTRATIONS AND EVIDENCE FOR THE UNITED STATES The theoretical case for weighted monetary aggregates never has been challenged seriously. Their potential for use in practice, however, has been questioned on three fronts. First, criticisms about the choice of a benchmark rate of return and the treatment of risk when measuring monetary user costs (both of which affect index weights) suggest that such an index is subject to unknown, and presumably large, measurement error. 1 Second, it has been alleged that central banks would be unable to influence the behavior of such an index in pursuit of policy objectives if components of the money stock were weighted by their shares of total expenditures on monetary services. 2 Most commonly, however, the case against the construction, publication, and use of any superlative index of money has been grounded in empirical evidence showing that an official simple sum measure, in the context of a particular model, time period, or set of tests, performs as well as or better than a weighted index of the same asset collection. This paper addresses the last of these issues by illustrating the degree to which simple sum and superlative indexes of money have differed and investigating why these gaps have arisen. Before proceeding, however, it must be noted that it has been misleading for one thread of the literature to characterize the behavior of these indexes as being generally similar and to conclude that a simple sum index produces an economic story that is qualitatively, if not quantitatively, the same as the set of inferences drawn from use of a superlative index. Although one can create the illusion of such a similarity by showing plots of simple sum and superlative indexes in levels, plots of growth rates have revealed divergent behavior as far back as the 1960s and 1970s.
3
Moreover, empirical studies based on data prior to the period of financial
innovations also indicate that results produced by simple sum and superlative indexes of money are quite different. 4 From this body of research, it seems reasonable to
2
conclude that a piece of conventional wisdom in monetary economics - that alternative methods used to construct an aggregate quantity of money are of little consequence never has been accurate. Even in the absence of these results, however, it would be dubious to interpret small differences in data plots or empirical results as offering evidence against the use of superlative index numbers to measure the money stock: Because a simple sum measure has no basis in theory and no statistical properties, it is not clear how - or even whether - any reported statistical association between it and another variable can be interpreted. Thus, even though Tobin's criticism of post hoc ergo propter hoc was motivated by a different research question, it also applies when in-sample correlations involving a data series that must be wrong in its construction are used to make inferences about the stability of structural relationships. 5 AN OVERVIEW OF THE DATA Because simple sum and superlative indexes differ only in the weights applied to their component categories, the comments above necessarily direct attention to the behavior of these weights and the factors that influence their magnitudes. Before addressing the technical details of index construction, an overview of the aggregate monetary data can provide a context for the questions raised in the introduction. Recalling that M1 was the official focus of monetary policy between October 1979 and July 1982 and that January 1981 marked the effective date where NOW accounts became available nationwide, the effects of financial innovations on money stock measurement can be examined by evaluating data before and after these institutional changes. 6 To this end, descriptive statistics for simple sum and Divisia aggregates are depicted in table 1 for the periods of 1959 – 1979 and 1983 - 2004. 7 Table 1 indicates that both the mean growth rates and their standard deviations are comparable for a
3
given grouping of bank liabilities weighted differently. At this casual level, weighting could be interpreted (incorrectly) as an issue of second-order importance. Before moving from table 1, a simple diagnostic test was conducted on the differences between the growth rates in these series. Assuming that policymakers and other observers of monetary policy actions would be most interested in patterns of money growth for purposes of forecasting future inflation, the notion of “common trends” comes to mind. In technical terms, differences between the growth rates of two monetary series should not be revealed to have a unit root because its presence would indicate money-based forecasts of inflation that would become increasingly divergent over time. Panel B of table 1 indicates, however, the clear presence of a unit root in the difference between the growth rates of simple sum and Divisia M1 growth during the 1960s and 70s. This is more evidence to counter any claims that weighting, if it matters, has not influenced the data until recently. Moreover, the results in table 1 indicate a borderline level of significance for the M2 level of aggregation in the post-1982 sample period when M2 has been the variable of most significance to monetary policy and research. If one has been relying on the trend growth rate of money as an indicator of future inflation and the Fed’s official simple sum aggregates have been the observer’s guide, M1 through 1979 and M2 since the early 1980s both have drifted from the signal given by a superlative index number of the same components. Plots of the Data To get a more general feel for the behavior of these data over time, it is useful to plot the alternative series to illustrate the effects of weighting on measurement. So that key episodes of more recent memory will not be lost in the plotting of the entire time series, only data since since 1979:4 (the beginning of the alleged monetarist experiment) will be shown. 8
4
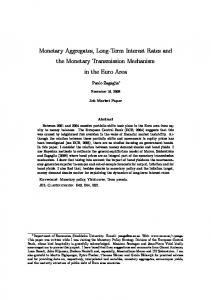
Figure 1 plots the growth rates of simple sum and Divisia measures of M1. Overall, the series appear to share similar movements. The lower panel of the figure reveals, however, that the quarterly values, especially in the early 1980s, frequently were different by one-half percentage point or more. This, of course, is precisely the period when analysts were attempting to discern the influence of the new, interest-bearing checkable deposits on M1 growth and what, if anything, that impact would have on the Fed’s ongoing efforts to reduce inflation and maintain the credibility of its anti-inflation policies. Although more will be said on this point later, in regard to figures 6 and 7, it is worth recalling that the rapid growth of simple sum M1 in the early 1980s led Milton Friedman to issue his (in)famous warning in 1983 about a resurgence of inflation in the U.S. 9 To a number of observers, the prominence of this prediction and its rejection by the data were a leading contributor to the demise of monetarist principles that had been so widely accepted only a few years earlier. Figure 2 compares the growth rates of sum and Divisia M2. Here the bottom panel, which plots the difference between the series, again may be more instructive. Noting that the difference is sum minus Divisia, this plot indicates that the Fed’s official M2 series consistently overstates the relative ease of monetary policy over the entire period (with the exception of a few quarters in late 1991). Whatever one makes of the M2 data, it should be noted that the research evidence to date indicates it is not a weakly separable group that can be aggregated irrespective of which index number is chosen to create to an aggregate value. That is to say, these figures still limit the discussion to the application of superlative indexes alone without regard to what bank liabilities are being aggregated. Conventionally, most researchers have taken the groupings specified by the Federal Reserve Board and applied Divisia weights to them. This strategy, however, assumes that the Board has identified weakly-separable asset groupings -the necessary condition for aggregation -
5
by its intuition about each deposit category and that a variety of institutional changes over time has not affected the composition of the aggregates. As just one consideration of the questions involved, M1 does not include MMDAs (which are checkable deposits) while M2 includes the large category of illiquid small time deposits. Whatever logic was used to distinguish M1 from M2 forty years ago, the introduction of interest-bearing checkable deposits and the elimination of Reg Q interest rate ceilings certainly strains its application to the new set of institutional arrangements and the same divisions between M1 and M2 today. 10 Nonetheless, while it is possible that the Board has made correct choices in denoting deposit groups for aggregation, research evidence seems to reject this view. In particular, studies using both Varian's (1982) nonparametric test and the parametric test used by Swofford and Whitney (1988) indicate that small time deposits (CDs in denominations less than $100,000) are not part of a weakly-separable group that includes such things as demand deposits, interest-bearing checkables and savings deposits. 9 With small time deposits representing about 25 percent of M2 in recent years and also being the component that declined the most in the early 1990s (leading to the abandonment of M2 as an intermediate target in July 1993), this case illustrates nicely how weighting, while important, can only limit the size of a measurement error if an aggregate is based on a grouping that is not weakly separable. In constast, the grouping that has been called M1-plus – M1 plus savings deposits – has been shown to be weakly separable and, as such, ia a grouping that meets this basic criterion for aggregation. Figure 3, which plots the sum and Divisia versions of this series, indicates that the simple sum version consistently understates the thrust of monetary policy. Here it is important to note the effects of composition of an aggregate on its indicator properties rather than focus on the effects of the of an index number formula alone. For the case of M2 specifically, the problematic
6
component is the inclusion of small time deposits (CDs with value less than $100,000); these deposits, which bear a time dimension and are not commonly thought of as “monetary assets,” are not included in the M1-plus grouping. Thus, while sum M2 generally overstates money growth relative to its Divisia M2 counterpart, the reverse is true for the M1-plus grouping; composition, as well as weighting, matters. Figure 4 addresses the issue of composition directly by comparing two Divisia aggregates, the St. Louis Fed’s MSI series and Divisia M1-Plus. Although MSI includes a handful of small deposit categories, such as overnight repurchase agreements, the main difference between the two is the inclusion of small time deposits in the MSI series. Here, the top panel reveals something of interest at turning points prior to recessions: The Divisia M1-plus series declines more sharply prior to downturns than does the MSI series. This is seen most clearly for the 1990-91 recession but also is apparent prior to the 2000-01 recession. If one is interested in short run fluctuations in money growth as an indicator of short run variations in real activity, it appears that the Divisia M1-plus series – a superlative index of a weakly separable group – performs better than MSI on this score. POSSIBLE ORIGINS OF GAPS BETWEEN SIMPLE SUM AND DIVISIA MONEY n
ln Mt
0.5 * ( sit
si , t 1) * ln qit
i 1
where sit is the share of total expenditures on monetary assets allocated to asset i and qit is the quantity held of the ith asset. This growth rate index, which is designed to track the unknown subutility function for a flow of monetary services from a given stock of bank liabilities, differs from a simple sum measure only in the weights attributed to each asset.
k
sit
(qit * uit ) /
qit * uit i 1
7
The expenditure shares of a Divisia index take the form: where qit is the quantity of the ith liability group at time t and uit is that liability's user cost. With demands for individual components of money having downward-sloping demand curves, this expression indicates that expenditure shares will change when changes in user costs induce changes in quantities held; the degree of change in individual expenditure shares therefore also depend upon the individual elasticities of demand. Finally, the real user costs shown in the share equation are defined as: uit = {(Rt – rit)/(1 + Rt)}, where R is the rate of return on a benchmark asset and rit is the rate of return on the ith asset. 11 In contrast to these relationships, a simple sum monetary aggregate is merely the accounting sum of a particular grouping of bank liabilities. If this type of levels aggregate is composed of three assets (A, B and C), the growth rate of M would be:
( A / M ) * d ln A ( B / M ) * d ln B (C / M ) * d ln C where the simple ratios of individual quantities held relative to the aggregate quantity serve as the "weights." And while these ratios may give the appearance of representing expenditure shares, this occurs only because all quantities are denominated in dollars. In this application, however, the "dollars" unit serves the same role as "ounces" or "feet" in constructing other numerical sums whereas a genuine expenditure share is determined by both quantities and the market prices (user costs) of those goods; no own-prices for individual monetary commodities appears in a simple sum aggregate. The important economic implication of this distinction between index weights is that the value of a Divisia index will not change unless an income effect is present; pure substitution effects will be internalized and the estimated value of the sub-utility function will remain constant. Conversely, with the weights of a simple sum index depending only on quantity shares irrespective of substitutions induced by changes in
8
relative prices, the value of this index can change from substitution effects alone. Or, thinking of the stock of money as the discounted present value of future flows of monetary services, the failure of a simple sum index to internalize pure substitution effects implies that the measured index can change even if the value of the underlying service flow has not. With the growth rates of simple sum and Divisia indexes of money differing only in their weights, examining the behavior of the weights over time may well reveal possible sources of the of the gaps illustrated earlier. Of particular interest here, beyond ordinary changes in user costs and the changes in expenditure shares they will cause, are a variety of institutional changes that have been subsumed under the heading of "financial innovations" in discussions of the early 1980s. Among these, the nationwide introduction of interest-bearing checkable deposits (NOW accounts) in 1981 was perhaps the most important change to many consumers and the Federal Reserve. 12 These accounts offered interest rates comparable to those on savings deposits while also serving as a direct means of payment without the "shoe leather" costs of making a savings-to-checking account transfer. Economists concerned with the rapidly rising rate of M1 growth in the early 1980s therefore conjectured that it was being distorted by flows of savings deposit funds into NOW accounts only for the purpose of gaining their (potential) checking privileges. In this view, some unknown portion of M1 growth reflected holdings of idle savings balances in slightly different form that had consequences for monetary accounting but not affect the monetary stimulus associated with aggregate spending and inflation. At the same time, others noted shifts from traditional demand deposits into NOW accounts. This transfer among M1 liabilities had no effect on the simple sum index but did affect a Divisia measure of M1. Other things the same, NOW accounts will have lower user costs and, with lower user costs, smaller share weights as well. Over all, these changes would explain the distorted picture of
9
excessive monetary expansion shown by simple sum M1 (and the false alarm for a rising inflation that never materialized) and a much lower rate of growth for Divisia M1 (consistent with the stable inflation rate that actually occurred). This issue is addressed in figure 5, which plots the budget shares of other checkable deposits in simple sum and Divisia M1 over the period 1979:4 through 2004:4. These share date confirm that, when M1 was growing rapidly in the early 1980s and warnings of resurgent inflation were being issued, the weight given to NOW accounts in simple sum M1 was 10-to-15 percentage points higher than that the budget share of NOW accounts in Divisia M1. Recalling that some analysts at this time attributed the observed growth in other checkable deposits, at least partially, to the transfer of idle savings balances to the potentially more liquid, interest-bearing checkable deposits now available to them, they suggested that an "undistorted" measure of money growth might be captured by neglecting other checkables completely (recall the short-lived revival of M1-A) or by giving other checkables a weight something less than 1.0. And while some of these adjustments appeared to restore traditional empirical relationships between money growth and economic activity, at least temporarily, these exercises and others in the same spirit were completely ad hoc, had no basis in the economic theory of aggregation and ultimately failed when applied over time. The reason for the failure for these adjustments and the failures of modern overfitted models of the demand for money to perform out of sample with simple sum monetary data is that the motivation for such adjustments does not become apparent until the data have evolved over several (or more) quarters. Then, once the inappropriate share weights have induced erratic behavior in the simple sum monetary aggregate, a new ad hoc weight can be attached to other checkable deposits (the discussion of the early 1980s) or a newly-updated and overfit money demand relationship can be estimated, which will be found, again, to perform poorly when its out-of-sample forecasts
10
are compared against the near-term history that evolves. 13 In contrast, a superlative index, using readily observable data on quantities and user costs for the relevant bank liabilities, can measure changes in the pattern of money growth in something akin to real time and without resort to ad hoc considerations about how much a given innovation is affecting standard measures of money growth. As such, the observed real-time data should provide an accurate description of the actual thrust of monetary policy and the out-of-sample predictions from money demand models should be generally consistent with the data that actually are forthcoming. A related problem that caused problems for monetary policy in the early 1990s is the role of small time deposits in a monetary aggregate. As noted earlier, virtually every test of weak separability has rejected the notion that CDs should be included with other elements of M2. Moreover, for purposes of policy, the combined effect of their 25 percent average share of M2 deposits and sharp declines in their level in the early 1990s led to widespread confusion about what changes in the behavior of simple sum M2 might mean. To investigate the role of weighting once again, figure 6 shows the behavior of the expenditure share weights for small time deposits in M2. In this case, the impact of index weights on policy inferences is illustrated clearly. The figure shows that the Divisia weights follow a more volatile path over the sample period while also declining from about 35 percent in the early 1980s to less than 20 percent today. Curiously, at the time of the "unusually" slow growth of the small time deposits component of M2 in the early 1990s the weight given to small time deposits in a Divisia index of the M2 aggregate was larger than that of the simple sum measure. Moreover, the Divisia share weight was increasing while that of the simple sum index was declining. Irrespective of whether the Fed’s subsequent decisions to de-emphasize and then abandon M2 as an intermediate target were correct, it must be noted that its
11
reasoning was based on unusually slow growth in small time deposits, a result observed only in the simple sum, but not Divisia, index weights. Index Number Weights and Economic Fluctuations With this overview of how the alternative index weights have behaved over time, it is interesting to ask whether the weights - the only source of difference between simple sum and superlative indexes of money - have significant information about economic activity independent of that contained in the growth rates of various categories of bank liabilties. In particular, recall that an expenditure share weight in a Divisia index is determined by both the quantity and the user cost of a specific liabilities category and that movements along any liability's demand schedule will be caused by a change in its user cost. In this context, focusing on the contributions of Divisia index weights to movements in ouput suggests an avenue of influence consistent with a real business cycle interpretation of monetary transmission. That is to say, while changes in the nominal quantities of assorted bank liabilities may not exert a direct influence on real activity, the price (user cost) changes that induce substitutions across deposit categories and alter the relative importance of each could be the source of identified associations between variations in the nominal quantity of money and output. To investigate this possibility, a VAR was estimated with the growth rate of real GDP regressed on its own lags and values of the share weights of components of the Divisia M1Plus aggregate. Because the share weights sum to 1.0 by construction, the weights for currency and travellers checks were not included in the analysis. Thus, the VAR for Divisia M1Plus includes the share weights for demand deposits, other checkable deposits and savings deposits. Of interest is whether variations in any of these weights contribute significantly to explaining variations in the growth rate of real GDP.
12
The impulse response functions for this VAR are shown in figure 7. The impulse responses show relatively little influence of the demand deposit or other checkable deposit share weights but a larger, and negative, response to the savings deposit share weight at a lag of two quarters.
Intuitively, the result implies that a larger weight to
savings (“idle”) balances will have a negative effect on real growth. For questions of monetary aggregation, however, this result reinforces the point that basic issues such a separability testing remain crucial to inferences we draw in our monetary research and decisions policymakers choose when looking to the future. In this case, savings deposits are not included in M1 but are part of a separable group (M1-Plus) that does appear to contain some marginally better information. Moreover, this information would not be gleaned by merely applying superlative weights to any of the Federal Reserve’s existing, and arbitrarily determined, monetary aggregates. With the growth rates of simple sum and Divisia measures of money differing only in the weights applied to the growth rates of component quantities, this exercise suggests that observed associations between innovations to money growth and real GDP depend, at least in part, on the relative importance given to each component. Summary and Conclusion For twenty-five years, monetary economists have had access to both theoretical arguments and empirical evidence to justify a fundamental revision in the approach to measuring the aggregate quantity of money. And while central bankers might rationally ignore calls for altering traditional practices on grounds ranging from desires for less accountability (and, by implication, greater discretion) to the public relations costs of explaining any procedural change, it is not clear why academic economists generally have dismissed the issue of measurement as a pedantic and empirically unimportant topic. The empirical evidence showing important quantitative and qualitative differences across chosen measures of money is abundant and no one, to date, has offered a
13
theoretical defense for the continued use of simple sum index numbers for monetary aggregation. The survey presented in this paper has attempted to clarify some of the misunderstood issues by illustrating when and how alternative measures of money behave differently and explaining that such differences ultimately originate in the weights a given index number attributes to each component of a monetary aggregate. Closer examination of the weights associated with the liabilities categories most influenced by financial innovations indicated that other checkable deposits have contributed to estimates of simple M1 growth greater than what would have been implied by a superlative index. Moreover, with the only difference between simple sum and superlative indexes occurring in their weights, the behavior of the weights themselves appear to have some association with the behavior of real GDP, a connection that would be explained by portfolio substitutions by the public influencing the behavior of the economy's monetary service flow.
14
Table 1. Descriptive Statistics for Simple Sum and Divisia Data 1959:2 - 1979:3
1983:2
Mean
Mean
std. dev
std. dev.
-
2004:4
Sum M1
0.90
1.11
2.03
1.29
Div. M1
0.92
1.03
2.06
1.14
Sum M2
2.26
0.76
2.73
1.38
MSI
1.80
0.73
2.31
1.31
SumM1plus
2.09
0.74
1.57
1.58
Div. M1plus
1.65
0.75
1.65
1.44
M1Diff
-0.03
0.15
-0.04
0.23
M2Diff
0.47
0.25
0.48
0.30
M1PlusDiff
-1.13
0.58
-1.14
1.07
(Note: Dif f erences are Sum minus Divisia series)
PANEL B. Unit Root Tests on Differences Between Growth Rates of Monetary Series 1959:2 --- 1979:3
1983:2 ---
M1 Difference
-2.66
-9.57
M2 Difference
-5.30
-3.21
M1plus Difference
-5.65
-4.30
NOTE: 0.05 c.v. = -2.90; 0.01 c.v. = -3.51
15
2004:4
Figure 1. Growth Rates of Sum and Divisia M1
5 4 3 2 1
Simple Sum
0 -1 -2 -3 -4 80 82 84 86 88 90 92 94 96 98 00 02 04 Difference between Growth Rates of Sum and Divisia M1
.8
.4
.0
-.4
-.8 80 82 84 86 88 90 92 94 96 98 00 02 04
16
Figure 2. Growth Rates of StL Fed MSI and Sum M2: 1979Q4 - 2004Q4
6 5 4 3 2 1 0 -1
MSI
-2 -3 80 82 84 86 88 90 92 94 96 98 00 02 04 Differences Between Growth Rates of Sum and Divisia M2
1.6
1.2
0.8
0.4
0.0
-0.4 80 82 84 86 88 90 92 94 96 98 00 02 04
17
Figure 3. Growth Rates of Sum and Divisia M1Plus
6 4 2 0 -2 -4 Simple Sum
-6 80 82 84 86 88 90 92 94 96 98 00 02 04
Differences Between Growth Rates of Sum and Divisia M1-Plus
4 3 2 1 0 -1 -2 -3 80 82 84 86 88 90 92 94 96 98 00 02 04
18
Figure 4. Growth Rates of St. Louis Fed MSI and Divisia M1-Plus
6 4 2 0 Divisia M1-P lus
-2 -4 -6 80 82 84 86 88 90 92 94 96 98 00 02 04
Differences Between Growth Rates of MSI and Divisia M1-Plus
2.0 1.6 1.2 0.8 0.4 0.0 -0.4 80 82 84 86 88 90 92 94 96 98 00 02 04
19
Figure 5. Shares of Other Checkable Deposits in Sum and Divisia M1 1979:4 - 2004:4
.40 .35
Simple Sum
.30 .25 Divisia
.20 .15 .10 .05 .00 80 82 84 86 88 90 92 94 96 98 00 02 04
20
Figure 6. Shares of Small Time Deposits in Sum and Divisia M2
.5
.4
Simple Sum
.3
.2 Divisia
.1 80 82 84 86 88 90 92 94 96 98 00 02 04
21
Figure 7. Responses to One Standard Deviation Impulses (+/- 2 s.e.) Response of Real GDP to Shares of Demand Deposits in Divisia M1Plus
Response of Real GDP to Lags of Real GDP
.8
.8
.6
.6
.4
.4
.2
.2
.0
.0
-.2
-.2
-.4
-.4 1
2
3
4
5
6
7
8
9
10
Response of Real GDP to Share of OCDs in Divisia M1Plus
1
3
4
5
6
7
8
9
10
Response of Real GDP to Shares of Savings Deposits in Divisia M1Plus
.8
.8
.6
.6
.4
.4
.2
.2
.0
.0
-.2
-.2
-.4
2
-.4 1
2
3
4
5
6
7
8
9
10
22
1
2
3
4
5
6
7
8
9
10
REFERENCES Anderson, Richard G., Barry E. Jones and Travis D. Nesmith. "Special Report: The Monetary Services Indexes Project of the Federal Reserve Bank of St. Louis," Federal Reserve Bank of St. Louis Review (January/February 1997), pp. 31-82. Barnett, William A. "Beyond the Risk-Neutral Utility Function," in, M.T. Belongia and J. Binner (eds.) Divisia Monetary Aggregates: Theory and Practice. London: Palgrave. (2000). _______."Which Road Leads to Stable Money" Economic Journal (June 1997), pp. 1171-85 ________. "Recent Monetary Policy and the Divisia Monetary Aggregates," The American Statistician (August 1984), pp. 165-72 ________."The User Cost of Money," Economics Letters Vol. 1, No. 2 (1978), pp. 145-49. ________, Douglas Fisher and Apostolos Serletis. "Consumer Theory and the Demand for Money," Journal of Economic Literature (December 1992), pp. 2086-2119. ________, Edward K. Offenbacher and Paul A. Spindt. "The New Divisia Monetary Aggregates," Journal of Political Economy (December 1984), pp. 497-505. Belongia, Michael T. "Consequences of Money Stock Mismeasurement: Evidence for Three Countries," in M.T. Belongia and J. Binner (eds.), Divisia Monetary Aggregates: Theory and Practice, London: Palgrave. (2000). _______. "Empirical Properties of Multipliers for Divisia Monetary Aggregates," working paper, Department of Economics, University of Mississippi (2004). _______. "Measurement Matters: Some Recent Results in Monetary Economics Re-Examined," Journal of Political Economy (October 1996), pp. 1083-65. _______. "Weighted Monetary Aggregates: A Historical Survey," Journal of International and Comparative Economics (Winter 1995), pp. 87-114.
23
_______ and Jane Binner (eds.) Divisia Monetary Aggregates: Theory and Practice. London: Palgrave. (2000). Christ, Carl F. “Assessing Applied Econometric Results,” Federal Reserve Bank of St. Louis Review (March/April 1993), pp. 71-94. Diewert, Erwin."Exact and Superlaltive Index Numbers," Journal of Econometrics (May 1976), pp. 115-45. ________. "Superlative Index Numbers and Consistency in Aggregation," Econometrica (July 1978), pp. 883-900. Friedman, Milton. Newsweek. September 26, 1983, p. 84. Gilbert, R. Alton. "A Case Study in Monetary Control: 1980-82," Federal Reserve Bank of St. Louis Review (September/October 1994), pp. 35 – 58. Issing, Otmar, H. Hermann and K.H. Todter, "Zinsgewichte Geldmengenaggregate und M3 - eing Vergleich," Kredit und Kapital (I, 1993), pp. 1-21. Jones, Barry. Kavajecz, Kenneth A. "The Evolution of the Federal Reserve's Monetary Aggregates: A Timeline," Federal Reserve Bank of St. Louis Review (March/April 1994), pp. 32-66. Rotemberg, Julio J., John C. Driscoll and James M. Poterba. "Money, Output and Prices: Evidence from a New Monetary Aggregate," Journal of Business and Economic Statistics (January 1995), 67-83. Swofford, James and Gerald Whitney. "Nonparametric Tests of Utility Maximization and Weak Separability for Consumption, Leisure and Money," Review of Economics and Statistics (August 1987), pp. 458-64. ________. "Comparison of Nonparametric Tests of Weak Separability for Annual and Quarterly Data on Consumption, Leisure and Money," Journal of Business and Economic Statistics (April 1988), pp. 241-46.
24
FOOTNOTES 1
See Issing, et al. (1993) for a clear exposition of these criticisms; Belongia (1995)
offers replies to each issue and summarizes historical discussions of weighted aggregates. Barnett (2000) addresses the implications of assumptions other than risk neutrality on the measurement of user costs and Barnett (1986) shows empirical measures of Divisia indexes to be robust with respect to choice of a benchmark rate. 2
Empirical evidence indicates that control errors associated with Divisia aggregates are
no worse than those associated with the current simple sum measures. See, for example, Spindt (1984) and Belongia (2004). 3
See the survey of papers in Belongia (1995) for a variety of early attempts to construct
weighted monetary aggregates. 4
See, for example, Barnett, et al. (1984) on the demand for money and Barnett (1984)
on the velocity of money . The references cited in Barnett (1997) and Barnett, et al. (1992) and the collection of papers in Belongia and Binner (2000), which offers evidence across ten countries, all provide examples of how this basic measurement issue influences inferences about the role of money in economic activity. Finally, Belongia (1996) makes direct comparisons of simple sum and Divisia indexes in five applications and finds the qualitative result to be reversed in four instances with mixed evidence on the remaining case. 5
Recall that use of simple sum aggregation requires not only the existence of Leontief
utility functions (all goods are perfect substitutes) but, as well, relative price ratios that all are constant over time and equal to one. Thus, while some authors have applied ttests to mean growth rates of simple sum and Divisia aggregates to infer that they are not meaningfully different, a t-test applies to a null hypothesis about the population mean parameter under the maintained assumption of random Gaussian sampling from a fixed distribution. Because such a test assumes that each monetary aggregate's
25
growth rate exhibits those assumed properties, the maintained hypothesis is false and the sampling properties of the test statistic are not those of the Student-t distribution. In fact, it is precisely the cyclical autocorrelation properties and variations exhibited in long-run trends of monetary aggregates that makes choosing among them an important question. I am indebted to William Barnett for this point. 6
Technically, the financial innovations era could be dated as January 1979 when
interest-bearing checkable deposits (NOW accounts) were permitted on a nationwide basis. They were not widely adopted, however, until the early 1980s. Kavajecz (1994) provides a detailed list of dates of major financial innovations since 1960. 7
Construction of the Divisia data is discussed at length in Anderson, et al. (1997) and
is published by the Federal Reserve Bank of St. Louis. 8
Whether the Fed actually engaged in monetary aggregates targeting between October
1979 and July 1982 is a matter of debate. Gilbert (1994), for example, presents evidence that questions this conventional wisdom. That Fed Chairman Paul Volcker prevented the publication of this paper when it was first written in the early 80s is a piece of history readers may interpret as they wish. Although the paper contained only means and standard deviations of data, Volcker argued that the paper’s publication could potentially violate secrecy guidelines because some readers might be able to discern individual observations from the reported mean values. Gilbert’s paper eventually was published to put this episode on record for benefit of economic historians. 9
See Friedman (1983)
10
Jones (this volume) reports results from tests of weak separability that reject the M1-
plus grouping, as well as that of M2, but finds evidence in support of a very broad (M3) and very narrow (M1) aggregate. Neither result is surprising, in the sense that “food,” as a broad commodity grouping, would be expected to be separable from “clothing” and
26
other broad commodity groups. Similarly, M1, a very narrow grouping might be thought of as being analogous to “red meat” or another narrow category within the broad category of food. The gray area between, however, is more problematic. Since 1986, the Federal Reserve has included money market deposit accounts (MMDAs) within savings deposits. At an intuitive level, arguments for excluding certain components from a measure of money run along these lines. CDs, for example, can be regarded as a non-monetary asset because they cannot be converted to an accepted medium of exchange without the cost of some penalty. MMMFs, on the other hand, are much the same as credit union share drafts used to be in the sense that writing a check on an MMMF, while reducing your fund shares, is actually paid from the f und's checking account at a commercial bank. Thus, an aggregate which includes these items may be thought of as an asset collection subject to some double-counting. Finally, the overnight RP and Eurodollar accounts are generally viewed as a means of settlement among domestic and foreign businesses that do not affect aggregate economic activity. It should be stressed, however, that intuition is not a substitute for tests of weak separability. 11
This expression is due to Barnett (1978) and is based on Diewert's (1976) derivation
of the user cost (price) for the flow of services from a stock of a durable good.
12
Between 1982 and 1986 , the Federal Reserve Board reported Super Now accounts as
a separate entity. With the elimination of interest rate ceilings, however, these were collapsed into the general category of NOW accounts. 13
Christ (1993) is particularly instructive on this point.
27