We quantify the inter- action of wireline and wireless networks during network ..... home or business), then they might not have access to a Wireline phone.
WIRELESS AND WIRELINE NETWORK INTERACTIONS IN DISASTER SCENARIOS Ahmad Jrad, Huseyin Uzunalioglu, David J. Houck, Gerard O’Reilly {jrad, huseyin, dhouck, goreilly}@lucent.com Lucent Technologies, 101 Crawfords Corner Rd. Holmdel, NJ 07733
Stephen Conrad, Walt Beyeler {shconr, webeyel}@sandia.gov Sandia National Laboratories Albuquerque, NM
and
ture scenarios during the failures and traffic overloads. The first infrastructure scenario represents current time as a large wireline network and smaller wireless network. The second infrastructure scenario represents the near future, where the wireless network size equals to the wireline network size. Our goal is to understand how different networks affect each other and to see if the growing size of the wireless network helps to make the telecommunications infrastructure more resilient against disruptions and overloads. To perform this study, we introduce a model for the telephony infrastructure for metropolitan service areas. Our goal is to develop a baseline functional model of the telecom system and then study the behavior in the presence of telecom and/or other infrastructure system failures and overloads.
ABSTRACT The fast and unrelenting spread of wireless telecommunication devices has changed the landscape of the telecommunication world, as we know it. Today we find that most users have access to both wireline and wireless communication devices. This widespread availability of alternate modes of communication is adding, on one hand, to a redundancy in networks, yet, on the other hand, has cross network impacts during overloads and disruptions. This being the case, it behooves network designers and service providers to understand how this redundancy works so that it can be better utilized in emergency conditions where the need for redundancy is critical. In this paper, we examine the scope of this redundancy as expressed by telecommunications availability to users under different failure scenarios. We quantify the interaction of wireline and wireless networks during network failures and traffic overloads. Developed as part of a Department of Homeland Security Infrastructure Protection (DHS IP) project, the Network Simulation Modeling and Analysis Research Tool (N-SMART) was used to perform this study. The product of close technical collaboration between the National Infrastructure Simulation and Analysis Center (NISAC) and Lucent Technologies, N-SMART supports detailed wireline and wireless network simulations and detailed user calling behavior.
After introducing some terms, we introduce our simulation that represents a metropolitan area telecommunications network. Then, we describe disruption and overload scenarios that we study in this paper. We present simulation results and compare the two infrastructure scenarios in terms of call carrying capacity. Finally, we conclude our paper with a summary and future research directions. DEFINITION OF TERMS We will be using the following terms and abbreviations throughout the rest of the paper:
.
•
Traffic: used to refer to actual telecom calls
•
LE – Local Exchange: this is a switch serving wireline customers
•
MSC – Mobile Switching Center: this is a switch serving wireless customers
•
LD – Long Distance: a switch that serves no actual lines but provides long distance service
•
LT – Local Tandem switch
•
AT- Access Tandem switch
•
ISP – Internet Service Provider: receives and processes modem calls to the Internet. ISPs do not originate calls, they only receive them
INTRODUCTION Today, we are given a choice of alternate communications means through the rapid advances in the wireless networking technology. We see users with only wireline phones, users with wireline and wireless phones, and even people with wireless phones only. In fact, there is a move away from the wireline phones towards the wireless phones. This shift in demand is changing the telecommunications infrastructure as the capacity of wireless networks is growing at the expense of wireline networks. In this paper, we investigate the resilience of the telecommunications infrastructure during this change. More specifically, we compare two infrastruc-
1 of 7
• •
Intra-LE traffic: traffic that originates and terminates on LEs
WW C a ll A t te m p t s & R e a t te m p t s
LE traffic: traffic that uses an LE at either end. This also includes the Intra-LE traffic as well but it also has the LE-LD, LE-MSC, LE-ISP traffic.
WM C a ll A t t e m p t s & R e a t te m p t s R e a tte m p ts
MW C a ll A t t e m p t s & R e a t te m p t s
MM C a ll A t t e m p t s & R e a t te m p t s
C a ll A t te m p ts
S e tu p
-
The same terms above apply to MSC & LD traffic.
C o m p le te d
L in e b u s y
A n s w e r in g m a c h i n e c a ll & No Answer
TRADITIONAL TELEPHONY SIMULATION
N e tw o rk B u s y
S w itc h
- BL
N e t. M ant BL
T ru n k B L
-
Abandon
+
The Network-Simulation Modeling and Analysis Research Tool (N-SMART) has been developed to support detailed wireline and wireless network simulations [1]. It studies telecom network readiness and traffic behavior on various disaster scenarios. It can create scenarios that demonstrate the pattern of telecom traffic loads and user behavior during the time of disaster, such as physical line disconnection and switching system failure.
WM WW
N e tw o rk m odel
INPUTS
S im u la tio n E n g in e -------------------------
C a ll m o d e l R o u tin g m o d e l R e a tte m p t m o d e l S w it c h p r o c e s s o r m o d e l S im u l a t i o n O u t p u t A n a l y s is
N e tw o rk F a ilu r e S c e n a r io s T r a ff ic O v e r lo a d S c e n a r io s N e tw o rk M anagem ent C o n tr o ls
P e r fo r m a n c e M e t r ic s
MM
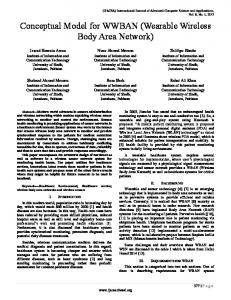
WW: Wireline to Wireline; MM: Mobile to Mobile WM: Wireline to Mobile; MW: Mobile to Wireline First call attempts arrive at a particular switch for a certain destination switch as described by the traffic load and the traffic profile. The call is accepted and routed through the network (set up) if there are sufficient trunk and processing resources in the switch and the network. The call may be blocked if the called line is busy, or if the network is busy, which may be due to trunk blocking along the route of the call (direct route and alternate routes), switch blocking because of processor congestion, or network management blocking. If a call is blocked, the caller may abandon the call set-up request or re-attempt later on either the wireline or wireless network. Routing decisions are based on the originating and terminating switches of the call. A call is referred to as incomplete if the call attempt results in no answer, line busy, or network busy. An incomplete call may be abandoned or reattempted. A re-attempt model based on [4] is used in the simulation. According to this model, a call would reattempt with a certain reattempt probability after an exponentially distributed reattempt time. Reattempt parameters are a function of whether the call was blocked due to a line busy or network busy. These dispositions determine how fast reattempts will be made. The reattempt model parameters [4] are shown in Table 1.
S w itc h in g N e tw o rk In fr a s tr u c tu r e T r a ff ic L o a d a n d P r o file
MW
Figure 2. Call Flow Models
N-SMART is a discrete event (call level) telecom model that simulates capacities, blocking levels, retrials, and time to complete calls for both wireline and wireless networks. Figure 1 depicts the building blocks of the NSMART-Voice simulation model, information input, and model output [1].
S im u la tio n E n g in e P a ra m e te rs
R e a t te m p t Et n d p o in t s ?
S y s te m S ta te
O UTPUTS
Figure 1. N-SMART-Voice Model
Various simulation scenarios analyze how different traffic patterns, traffic loads, user behaviors, and disaster severities impact network performance and recovery. By analyzing the results of simulations, the tool shows how different telecom elements, such as bandwidth deficiency, switch processor overload, and user behavior, impact the performance of the network and its robustness.
Table 1. Reattempt Model Parameters
Probability
No Answer
Line Busy
12.9%
5.9%
Reattempt 61% probability Mean time to 3 reattempt Minutes
The simulation engine consists of algorithms to generate events related to calls, re-attempts, network failures, processor overloads, and simulation output. Figure 2 illustrates the call model.
2 of 7
72% 18.2 Minutes
Network Busy
Dynamically computed 86% 23.9 Minutes
subscribers. In addition, we increase the traffic generated by the each wireless subscriber to equal the traffic generated by each wireline subscriber in Erlangs. It is our expectation that based on current trends; this will be a good representation of the expected network growth in the near term. We refer to this new network as the “N-Metro”.
The reattempt model shown in Table 1 is applicable when there is only one telecommunication network available. The goal of this paper is to investigate the inter-dependencies between wireless and wireline systems. When two different network technologies are available, a caller might retry an incomplete call in the alternate network. The retry would occur with the same pair of endpoints or may happen after changing one or both of the endpoints, e.g., wireline endpoint to wireless endpoint and vice versa, with a total of 4 options as shown in Figure 2. This depends, of course, on the availability of options for the end-user: •
•
O-Metro: 900,000 wireline subscribers and 450,000 wireless subscribers N-Metro: 900,000 wireline subscribers and 900,000 wireless subscribers We assume 0.083 Erlangs/subscriber (Holding time in the busy hour for Wireline subscribers in both networks. However, for the wireless subscribers the O-Metro model assumed 0.05 Erlangs/subscriber and that was increased to 0.083 Erlangs/subscriber in the N-Metro model.
For an initial Wireline user, is a wireless phone available? This will depend on the mobile penetration of the market for each user type in the metropolitan area.
For wireline, we have a number of local exchanges supported by 2 local tandem switches, 2 access tandem switches, and 2 long distance switches from national carriers. For wireless, we have three major wireless carriers spread across several Mobile Switching Centers (MSCs) and many cell towers throughout the regions for mobility access.
For an initial mobile user, is a wireline phone available? If they are on the move (i.e., not at home or business), then they might not have access to a Wireline phone.
The endpoint for the destination can also be changed based on the availability of the alternate phone and the origination’s knowledge of it. N-SMART incorporates a detailed probabilistic model to reflect these network switching event for the reattempts. In fact, this switching of endpoints shifts the load from one network to the other network. For example, call blocked in the wireline network because of a failed switch. The callers of these calls would reattempt their calls in the wireless network. This results in the shift of load from wireline to wireless network. If such calls are successfully completed in the wireless network, we can say that the wireless network alleviates the problem in the wireline network, and hence, increases the resilience of the telecommunications infrastructure. On the other hand, if these reattempt calls congest the wireless network, and cause the blocking of calls in this network, we can say that wireline network impacts the performance of the wireless network negatively. In the following section, we investigate this interaction between networks in detail using N-SMART.
NETWORK ASSUMPTIONS We designed both Original and N-Metro networks to carry the normal expected traffic at peak hour We used high usage trunk groups to carry the bulk of the traffic and then allowed any blocked calls to go over final trunk groups to the Local Tandems (LT’s) or Access Tandems (AT’s) based on the type of call. The design goal was to guarantee a maximum blocking of less than 1% on any given route. In addition, we allowed high usage trunks to be built only if there is sufficient traffic to utilize the trunk group. For routes where there is little demand all traffic would be sent on the finals trunks to the LT(s) or AT(s).
THE METROPOLITAN NETWORK MODEL We have analyzed a number of metropolitan areas in the course of our work. In this paper, we discuss a medium sized metropolitan area, as it existed in the recent past, where the wire-line subscribers outnumber the wireless subscribers by 2 to 1. We call this original network “OMetro”. We then increase the number of wireless subscribers and make them equal to the number of wireline
3 of 7
to 22:00 and another 3 MSCs (O-Metro: 195K, N-Metro: 300K) for 4 hours from 18:00 to 22:00.
Figure 3. Traffic Routing Model
4. Case 3 - Global Traffic Overload of 2 times normal across the region for both Wireline and wireless networks for 4 hours from 15:00 to 19:00 with a 30-minute linear settling back to normal time.
Figure 3 shows the routing that is allowed in the network, this is important to understand as we actually fail one LT and one AT in case 1. The failure of the AT and LT would take away the final routes for any switches that depend on them. The dashed routes in Figure 3 are high usage routes and the solid routes are the final routes. The dashed and solid routes of a given color show the routing rules for that traffic type. Therefore, looking at the blue trunks, we see that traffic between two MSC’s is sent over a high usage trunk group, but in case that high usage group is currently used to capacity, the call is sent via the corresponding AT’s of the two MSC’s.
These 4 scenarios will show how traffic is transferred as a result of user behavior in switching networks from one network to another under disruption scenarios.
200,000 180,000 160,000 140,000
The traffic pattern in a telecommunications network changes as a function of the time-of-day. During certain hours of the day, the traffic is at a maximum while some other hours there is very small amount of traffic. This is represented by a traffic profile, as shown in Figure 4, in the N-SMART.
120,000 100,000 80,000 60,000 40,000 20,000
gen
:0 0
:0 0
23
:0 0
22
:0 0
21
:0 0
ANSM
20
19
:0 0
:0 0
ABDN
18
:0 0
17
:0 0
:0 0
BSY
16
15
:0 0
TRBL
14
:0 0
13
:0 0
SWBL
12
11
0
:0 0
0
9: 0
ADM
10
8: 0
0
0
0 7: 0
0
0
0
0
fatt
6: 0
5: 0
4: 0
3: 0
2: 0
1: 0
0: 0
0
0
active
Figure 5. Baseline Calls for N-Metro Area
120%
100% 80%
There are 9 statistics on Figure 5 as follows: 1. FATT - first attempts of calls 2. GEN - total calls generated 3. ADM - admitted calls which complete 4. SWBL - switch blocked calls 5. TRBL - trunk blocked calls 6. BSY - calls which end to busy line 7. ABDN - calls which are abandoned 8. ANSM - calls routed to an answering machine 9. ACTIVE - total active calls across the network
60%
40% 20%
:0 0
:0 0
:0 0 23
22
:0 0 20
21
:0 0
:0 0
:0 0 19
18
17
:0 0
:0 0 15
ISP-ATT%
16
:0 0
:0 0
MSC-ATT%
14
:0 0
0
:0 0
:0 0
13
12
11
9: 0
LE-ATT%
10
0
0
0 8: 0
7: 0
6: 0
0
0
0
0
0 5: 0
4: 0
3: 0
2: 0
1: 0
0: 0
0
0%
LD-ATT%
Figure 4. 24-Hour Traffic Profile
Figure 4 shows the actual profile during a typical 24-hour period.
All of these statistics, with the exception of ACTIVE, are call counts within 5-minute intervals. The ACTIVE is a snapshot of the total number of calls at the sampling instant. Figure 5 shows call statistics for the baseline scenario (case 0), also representing the 24-hour traffic profile for our metropolitan area. The busy hour is from 16:00 (4 PM) to 20:00 (8 PM). Under normal conditions (no disruptions), most first attempts (FATT) are admitted (ADM) and complete except for a small fraction encountering busy. But most of them are retried and complete on subsequent attempts if the user doesn’t abandon.
DISRUPTION SCENARIOS We have 4 scenarios under consideration: 1. Case 0 - Baseline scenario without any disruption. 2. Case 1 - Main building disruption for Wireline service: for 8 hours – from 14:00 (2 PM) to 22:00 (10 PM) – Fail 5 Local Exchange’s (300K lines of 900K total) – 1 Long Distance switch, 1 Access Tandem Switch and 1 Local Tandem switch.
CASE 1 RESULTS
3. Case 2 - Mobility disruption for Wireless service: Fail 2 MSCs (O-Metro: 132K of 454K, NMetro: 300K of 900K) – for 8 hours from 14:00
In this section, we present a discussion of the simulation results as obtained for O-Metro and N-Metro respec-
4 of 7
tively. Our objective is to compare how each network is affected by the failure condition, and the impact on the individual sub-networks within the overall network.
blocking (switch + trunk) rises to between 80%-90% during the disruption, and it takes several hours after the disruption for high blocking levels to subside (because of the buildup of call reattempts across the networks).
400000 350000
100 % 90 % 80 % 70 % 60 % 50 % 40 % 30 % 20 % 10 % 0% 2 :0 0 : 0 0 PM
300000 250000 200000 150000 100000 50000
0: 00 1: 00 2: 00 3: 00 4: 00 5: 00 6: 00 7: 00 8: 00 9: 00 10 :0 0 11 :0 0 12 :0 0 13 :0 0 14 :00 15 :0 0 16 :0 0 17 :00 18 :0 0 19 :00 20 :0 0 21 :0 0 22 :00 23 :0 0
0
fatt
gen
ADM
SWBL
TRBL
BSY
ABDN
ANSM
In d e x = 0 + 2 1 = 2 1 %
3 :4 0 :0 0 PM
5 : 2 0 :0 0 PM
7 :0 0 : 0 0 PM
8 :4 0 : 0 1 0 :2 0 : 0 1 2 : 0 0 : 0 1 :4 0 : 0 3 :2 0 : 0 0 PM 0 PM 0 AM 0 AM 0 AM
5 :0 0 : 0 0 AM
active
Figure 9. Case 1 Intra MSC blocking on O-Metro Network Figure 6. Case 1 Overall traffic in O-Metro Index = 0%+ 1%= 1%
100%
Figure 6 shows the overall traffic results for the entire network in the O-Metro simulation. The shape of the NMetro curve looks quite similar as well, however the exact variation from the baseline condition does vary in the amount of blocking that is generated.
90% 80% 70% 60% 50% 40% 30% 20% 10% 0% 2:00:00 PM
100% 90% 80% 70% 60% 50% 40% 30% 20% 10% 0% 2:00:00 4:00:00 6:00:00 PM PM PM
3:40:00 PM
5:20:00 PM
7:00:00 PM
8:40:00 PM
10:20:00 12:00:00 1:40:00 PM AM AM
3:20:00 AM
5:00:00 AM
Index = 30% + 25% = 55%
Figure 10. Intra MSC blocking on N-Metro Network
TRBL Figure 9 shows a surprising result. The blocking levels across the wireless networks are significant even though those networks were not disrupted. This results from the shift in traffic from the wireline network (under disruption) to the wireless network. As subscribers get blocked on their wireline attempts, they would re-attempt either to dial from a wireless device, or to call the other party on their cell phones or both. This behavior is governed by parameters that define the likelihood of switching the originating method, or terminating method, and also the probability the caller knows the cell phone number of the intended party.
SWBL 8:00:00 10:00:00 12:00:00 2:00:00 4:00:00 6:00:00 PM PM AM AM AM AM
Figure 7. Case 1 O-Metro Intra-LE Blocking
100% 90% 80% 70% 60% 50% 40% 30% 20% 10% 0% 2:00:00 PM
Index = 33%+ 30%= 63%
4:00:00 PM
6:00:00 PM
8:00:00 10:00:00 12:00:00 2:00:00 PM PM AM AM
4:00:00 AM
Figure 10 shows another interesting result. When the wireless network is much bigger (as it is in the N-Metro model), then the impact on the intra calling across the wireless network is relatively modest. We hypothesize that resiliency of networks is maximized across different potential when the multiple networks are of relatively equal size. When one network is much bigger and is disrupted, the smaller networks would not be able to handle the reattempted traffic shifted to it.
6:00:00 AM
Figure 8. Case 1 N-Metro Intra-LE Blocking
Figure 7 and Figure 8 show the impact of the main building disruption on the O-Metro and N-Metro intraLE blocking respectively. In this case, the total network
5 of 7
CASE 2 RESULTS
Index = 0%+ 1%= 1%
10 0% 9 0% 8 0%
60,000
7 0% 6 0%
50,000
5 0% 40,000
4 0% 3 0%
30,000
2 0% 1 0%
20,000
0% 2:00 :00 PM
10,000
3:40:0 0 PM
5 :20:00 PM
7:0 0:00 PM
8:40 :00 1 0:20:0 0 12 :00:00 PM PM AM
1:4 0:00 AM
3:20 :00 AM
5:00:0 0 AM
fatt
gen
ABDN
:0 0
:0 0
Figure 14. Case 2 - Global overload
23
:0 0
22
:0 0
ANSM
21
:0 0
:0 0
20
19
:0 0
:0 0
18
17
:0 0
BSY
16
:0 0
15
:0 0
TRBL
14
:0 0
13
:0 0
:0 0
SWBL
12
11
9: 00
ADM
10
8: 00
7: 00
6: 00
4: 00 5: 00
3: 00
2: 00
1: 00
0: 00
0
active
Figure 11. Case 2: Intra-LE Blocking for N-Metro
Figure 13 shows the intra-LE blocking for case 2. Figure 14 shows the same for N-Metro. The total level of intraLE blocking in the N-Metro is much larger and it reaches 33% as compared to 1% for the O-Metro. Once again these significant levels of blocking are due to the shift of calling from the wireless network (under disruption) to the Wireline network (not under disruption).
60,000 50,000 40,000 30,000 20,000
CASE 3 RESULTS
10,000
In case 3 simulations we find that both networks experience a similar level of blocking over the failure time. Interestingly, we find that after the failure condition is lifted, the smaller of the two networks takes longer to fully recover.
0: 00 1: 00 2: 00 3: 00 4: 00 5: 00 6: 00 7: 00 8: 00 9: 00 10 :0 0 11 :0 0 12 :0 0 13 :0 0 14 :0 0 15 :0 0 16 :0 0 17 :0 0 18 :0 0 19 :0 0 20 :0 0 21 :0 0 22 :0 0 23 :0 0
0
fatt
gen
ADM
SWBL
TRBL
BSY
ABDN
ANSM
active
Figure 12. Case 2 - Intra-LE Blocking for O-Metro
Figure 11 again shows the impacts on the wireline network from the wireless failure. This shows that failure in either network will affect the other even though it may experience no direct failure of its own. By comparing Figure 11 and Figure 12 we see that the wireline network is affected much more heavily in the N-Metro than in the O-Metro. This is due to the fact that the wireline infrastructure in O-Metro is much larger and the amount of failed traffic is a considerably smaller as compared to NMetro.
100% 90% 80% 70% 60% 50% 40% 30% 20% 10% 0% 2:00:00 PM
100% 90% 80% 70% 60% 50% 40% 30% 20% 10% 0% 2:00:00 PM
90% 80% 70% 60% 50% 40%
TRBL
30% 20% 10% 0% 2:00:00 PM
3:40:00 PM
5:20:00 PM
7:00:00 PM
SWBL
8:40:00 PM
10:20:00 12:00:00 1:40:00 PM AM AM
3:20:00 AM
4:00:00 PM
6:00:00 PM
8:00:00 10:00:00 12:00:00 2:00:00 PM PM AM AM
4:00:00 AM
6:00:00 AM
Figure 15. Case 3 Intra MSC blocking on O-Metro Network
Index = 4%+ 29%= 33%
100%
Index = 38%+ 6%= 44%
5:00:00 AM
Figure 13. Case 2 – Intra-LE Blocking on N-Metro
Index = 23%+ 5%= 28%
4:00:00 PM
6:00:00 PM
8:00:00 10:00:00 12:00:00 2:00:00 PM PM AM AM
4:00:00 AM
6:00:00 AM
Figure 16. Case 3 Intra MSC blocking on N-Metro Network
6 of 7
This is shown in Figure 15 and Figure 16 above. These Figures show that the intra-MSC blocking lasts longer in the O-Metro than in the N-Metro. The reverse is true for intra-LE blocking. This is actually caused by trunk blocking, which lingers after switch blocking has fully subsided. We suspect this is due to the much smaller trunk groups, which are less efficient than larger trunk groups. The overall blocking in this scenario is 25% (SWBL) and 9% (TRBL), which amounts to 24% total blocking.
and suffers a disruption, then the shift in load brings down (in a congestion sense) the smaller network. Another conclusion that we draw is the importance of having the wireline networks in terms of offering diversity. As more and more providers chase the easy profits of the wireless business, we must not allow the wireline service to become obsolete. Perhaps the best outcome is to eventually have every subscriber with both wireline and wireless availability.
SUMMARY AND CONCLUSIONS
FUTURE DIRECTIONS
In this paper, we have found the following: • •
•
There are a number of directions to extend this work in the future. They include the study of how:
Network congestion lasts until well after the causing disrupting event has subsided.
1. The network engineering rules influence its ability to handle failures
Service providers should not place many key switches in the same central office. In case 1, we saw how the failure of a single office can cause ripple effects in blocking to reverberate throughout the entire network.
2. The user behavior and changes to it can play a critical role in how a failure propagates, perhaps leading to some education to users on how to react in times of crisis.
In general, wireline and wireless networks in a metropolitan area support each other in times of trouble (when there are disruptions to either network). As such, the presence of multiple networks enhances resiliency of overall network communications, even though they weren't originally designed for any redundancy.
•
This resiliency is caused by customer behavior in switching networks when one is failed. But the switchover in demand onto the non-disrupted network may cause significant congestion in that destination network.
•
This resiliency of the overall network communications is best when the networks are of relatively equal sizes in terms of load. If one is much larger
REFERENCES [1] David J. Houck, Eunyoung Kim, Gerard P. O’Reilly, David D. Picklesimer, Huseyin Uzunalioglu, “A Network Survivability Model For Critical National Infrastructure,” Bell Labs Technical Journal, Volume 8, Number 4, 2003. [2] Gerard P. O’Reilly, David J. Houck, Eunyoung Kim, Thomas B. Morawski, David Picklesimer, Huseyin Uzunalioglu, “Infrastructure Simulations of Disaster Scenarios,” Networks 2004, Vienna, Austria, June, 2004. [3] Walt Beyeler, Stephen Conrad, Thomas Corbet, Gerard P. O’Reilly, David D. Picklesimer, “Inter- Infrastructure Modeling - Ports and Telecommunications,” Bell Labs Technical Journal, Volume 9, Number 2, 2004, 91-105. [4] K.S. Liu, “Direct Distance Dialing: Call Completion and Customer Retrial Behavior,” Bell System Technical Journal, 59:3 (1980), 295–311.
7 of 7