Hindawi Publishing Corporation Journal of Sensors Volume 2015, Article ID 124058, 8 pages http://dx.doi.org/10.1155/2015/124058
Research Article Wireless Passive Temperature Sensor Realized on Multilayer HTCC Tapes for Harsh Environment Qiulin Tan,1,2,3 Zhong Ren,1,2 Ting Cai,1,2 Chen Li,1,2 Tingli Zheng,1,2 Sainan Li,1,2 and Jijun Xiong1,2 1
Science and Technology on Electronic Test & Measurement Laboratory, North University of China, Taiyuan 030051, China Key Laboratory of Instrumentation Science & Dynamic Measurement, Ministry of Education, North University of China, Taiyuan 030051, China 3 National Key Laboratory of Fundamental Science of Micro/Nano-Device and System Technology, Chongqing University, Chongqing 400044, China 2
Correspondence should be addressed to Jijun Xiong;
[email protected] Received 20 June 2014; Revised 1 September 2014; Accepted 1 September 2014 Academic Editor: Gongfa Li Copyright © 2015 Qiulin Tan et al. This is an open access article distributed under the Creative Commons Attribution License, which permits unrestricted use, distribution, and reproduction in any medium, provided the original work is properly cited. A wireless passive temperature sensor is designed on the basis of a resonant circuit, fabricated on multilayer high temperature cofired ceramic (HTCC) tapes, and measured with an antenna in the wireless coupling way. Alumina ceramic used as the substrate of the sensor is fabricated by lamination and sintering techniques, and the passive resonant circuit composed of a planar spiral inductor and a parallel plate capacitor is printed and formed on the substrate by screen-printing and postfiring processes. Since the permittivity of the ceramic becomes higher as temperature rises, the resonant frequency of the sensor decreases due to the increasing capacitance of the circuit. Measurements on the input impedance versus the resonant frequency of the sensor are achieved based on the principle, and discussions are made according to the exacted relative permittivity of the ceramic and quality factor (𝑄) of the sensor within the temperature range from 19∘ C (room temperature) to 900∘ C. The results show that the sensor demonstrates good high-temperature characteristics and wide temperature range. The average sensitivity of the sensor with good repeatability and reliability is up to 5.22 KHz/∘ C. It can be applied to detect high temperature in harsh environment.
1. Introduction Temperature is a critical measurement index in many research fields, such as chemical, medical, equipment, and food fields [1]. Although there are many different types of temperature sensors in the market at present, most of them are wired or active sensors, where physical connection between the sensor and signal transmission system is needed and power supply is also required, making it difficult to meet some special requirements. Wired sensors make the advantages of broad application and high sensitivity over wireless ones, but the lifetime and operating range are limited because a battery must be provided [2]. Many techniques have been applied to measure temperature, mainly including platinum resistors [3], thermocouples [4–6], optics [7–10], surface acoustic wave (SAW) [11, 12], and LC resonance [13–15].
It is known that temperature sensors all have their own advantages. However, the response time of platinum resistors with expensive cost is not faster than other temperature sensors. As for thermocouples without rapid response time, it is hard to withstand chemical corrosions, and the output signal is susceptible to common noises. As far as optical temperature sensors are concerned, it is not suitable for applications in harsh environments, such as chemical corrosion and rotating components. In fact, the accuracy of SAW is easily influenced by environmental conditions and material properties. Therefore, it is very necessary for the temperature sensors to be selected according to different requirements and applications. Wireless passive LC resonant temperature sensors have unique advantages. It is very suitable for them to be applied for the energy transmission at a short distance in harsh
2
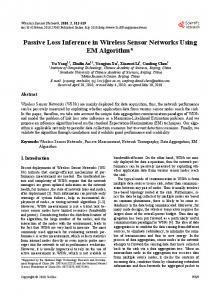
Journal of Sensors Impedance analyzer
Harsh environment
M
Ra
Antenna
Sensor
Figure 1: Proposed wireless coupling system for temperature measurement.
industrial and medical environments [16], which makes it possible to meet some special requirements, such as rotating components, nondestructive monitoring, chemical corrosion, sealed environment, and other special high-temperature occasions. In this paper, the alumina ceramic, one of the HTCC tapes, is fabricated to be used as a substrate by lamination and sintering techniques, and the wireless passive temperature sensor integrating a planar spiral inductor and a parallel plate capacitor is designed and fabricated. What is more, the performances of the sensor at different temperature are measured in wireless coupling way, as shown in Figure 1. It demonstrates steady performances within the temperature range from room temperature to 900∘ C, with high sensitivity, good repeatability, and reliability compared with other types of wireless passive temperature sensors.
Ls
La
Z
Rs
Antenna
Cs
Temperature sensor
Figure 2: Equivalent circuit. 𝑅𝑎 and 𝑅𝑠 are the series resistance of antenna and sensor, respectively. 𝐿 𝑎 and 𝐿 𝑠 are the series inductance of antenna and sensor, respectively. 𝐶𝑠 is the series variable capacitance of sensor. 𝑀 is mutual inductance between antenna and sensor, and 𝑍 is the input impedance looking into the antenna.
dout din
2. Design and Simulations Equivalent circuit model of the temperature sensor is mainly a series resonant circuit, as shown in Figure 2. The resonant frequency of the circuit and quality factor of the sensor are given by [17] 𝑓0 =
1 , 2𝜋√𝐿 𝑠 𝐶𝑠
(1)
𝑄=
1 𝐿𝑠 √ . 𝑅𝑠 𝐶𝑠
(2)
The change of resonant frequency versus the variable temperature can be detected by an external read circuit with an antenna in wireless coupling way, as shown in Figure 2. Coupling coefficient 𝑘 between the antenna and the sensor is related to mutual inductance 𝑀, given by [17] 𝑀 . 𝑘= √𝐿 𝑎 𝐿 𝑠
(3)
The input impedance 𝑍 can be concluded by 𝑍 = 𝑅𝑎 + 𝑗2𝜋𝑓𝐿 𝑎 [1 +
2
2
𝑘 (𝑓/𝑓0 ) 2
1 − (𝑓/𝑓0 ) + 𝑗𝑓/ (𝑓0 𝑄)
],
(4)
where 𝑓 is the frequency loaded at the terminal of the antenna. As we can see from (4), the resonant frequency of
2a
Figure 3: Designed parameters of temperature sensor. 𝑑out : outer diameter of the inductor. 𝑑in : inner diameter of the inductor. 𝑎: radius of capacitor plates.
the sensor can be determined by monitoring the frequency response of the input impedance 𝑍. The planar spiral inductor is designed to be circular, as shown in Figure 3, and the calculation of the inductance is given by [18] 𝐿𝑠 =
𝜇0 𝑛2 𝑑avg 𝑐1 2
𝑐 [ln ( 2 ) + 𝑐3 𝜌 + 𝑐4 𝜌2 ] , 𝜌
(5)
where 𝑛 means the inductor turns, 𝜌 is filling ratio, 𝜌 = (𝑑out − 𝑑in ) / (𝑑out + 𝑑in ), 𝑑avg corresponds to the average diameter of the inductor, 𝑑avg = (𝑑in + 𝑑out ) /2, the magnetic permeability of free space 𝜇0 is 4𝜋 × 10−7 H/m, and 𝑐1 , 𝑐2 , 𝑐3 , and 𝑐4 are coefficients related to the shape of the inductor, assigned the values of 1, 2.46, 0, and 0.2, respectively.
Journal of Sensors
3
650
350 300 250 R (Ω)
|Z| (Ω)
550 450
200 150 100
350
50 250 30
31
32
33
34 35 36 37 Frequency (MHz)
No sensor 𝜀r = 9, Rs = 3 Ω 𝜀r = 10, Rs = 3 Ω
38
39
40
0 30
31
32
33
34 35 36 Frequency (MHz)
(a)
38
39
40
𝜀r = 11, Rs = 3 Ω 𝜀r = 11, Rs = 6 Ω 𝜀r = 11, Rs = 12 Ω
No sensor 𝜀r = 9, Rs = 3 Ω 𝜀r = 10, Rs = 3 Ω
𝜀r = 11, Rs = 3 Ω 𝜀r = 11, Rs = 6 Ω 𝜀r = 11, Rs = 12 Ω
37
(b)
Figure 4: The magnitude |𝑍| (a) and real part 𝑅 (b) of impedance versus frequency.
Table 1: Sensor parameters at room temperature. Parameters 𝑛 𝑑in /mm 𝑑out /mm 𝑡𝑚 /mm 𝑎/mm 𝜀𝑟 𝐿 𝑠 /uH 𝐶𝑠 /pF 𝑅𝑠 /Ω 𝑓0 /MHz
Value 10 10.2 26.8 0.48 4.2 9 2.02 9.20 3.7 36.92
The capacitor plates are also designed to be circular, as shown in Figure 3, and the calculation of the capacitance is given by [16] 𝜀 𝜋𝑎2 , 𝐶𝑠 (𝑇) = 𝜀𝑟 (𝑇) 0 𝑡𝑚
(6)
where 𝜀0 is the permittivity of free space, 8.85 × 10⁻¹² F/m, 𝜀𝑟 is the temperature-dependent relative permittivity of alumina ceramic, and 𝑡𝑚 is the thickness of the ceramic substrate. It is known that the higher the operating frequency is, the greater the parasitic capacitance and the inductance will have influence on a system. Thus, the design value of the resonance frequency of the resonance circuit should not be more than 100 MHz. It can be concluded from (2) that if the sensor gets high inductance, low capacitance, and equivalent series resistance, the sensor will obtain high 𝑄. Parameters of the temperature sensor are summarized in Table 1. When the sensor is in the interrogation zone of the antenna, obvious changes of the magnitude and real part of the input impedance will appear near the resonant frequency of the sensor in the simulations, as shown in Figure 4. The impedance is changed due to the shift of the relative
1 2 3
Figure 5: Sectional view of the sensor.
permittivity 𝜀𝑟 and the resistance 𝑅𝑠 . It presents a general idea of the relationship between the resonant frequency of the sensor and the relative permittivity of alumina ceramic, ranging from 9 to 11. The higher the relative permittivity becomes, the lower the resonant frequency gets. Additionally, an increase of resistance 𝑅𝑠 , ranging from 3 to 12, will result in a decrease of impedance peak and an increase of resonance bandwidth.
3. Fabrications Three sheets of the green alumina tape, ESL 44000 (ESL Electroscience, UK), a flexible cast film of 96% alumina powder dispersed in an organic matrix, are chosen to be used as the substrate of the sensor and the thickness of each tape is approximately 200 𝜇m. The conductive Ag/Pd/Pt paste, ESL 9562-G (ESL Electroscience, UK), is applied on the substrate to form a LC resonant circuit composed of one-layer planar spiral inductor and a parallel plate capacitor, as shown in Figure 5. The fabrication process of the sensor is illustrated in Figure 6. The green tape is cut into 8 inches for each sheet, and the each sheet is cut to achieve alignment holes, as shown in Figure 6, step 1. To fabricate the substrate, aluminum foil is used to prevent the green sheets from sticking before laminating them together in a vacuum press. The pressure and temperature for hot press are set to 21 MPa and 70∘ C for 5 min, as shown in Figure 6, step 2. Then the green sheets after lamination are trimmed edges and then cut down to 4 × 4 square samples with the edge length of approximately 35 mm, considering the shrinkage of 16%–18% after sintering,
Journal of Sensors
R (kΩ)
(1) Cut green tapes
(2) Laminate three sheets
(3) Cut samples
(5) Screen-print LC circuit
(4) Sinter samples
(6) Postfire
45 40 35 30 25 20 15 10 5 0
100 75 50 25 0 −25 −50 −75 −100 70
𝜃 (∘ )
4
50
52
54
56
58 60 62 64 Frequency (MHz)
66
68
1 2
Figure 7: SRF of the antenna. “1” is real part of input impedance of antenna. “2” is phase of input impedance of antenna.
Figure 6: Fabrication processes of temperature sensor.
as shown in Figure 6, step 3. In Figure 6, step 4, the samples are placed in a desktop furnace to sinter as follows. The first ramp rate is 2∘ C/min to bake off the organics, at 450∘ C for 30 min, the next ramp rate is 6∘ C/min to sinter the ceramic, at 1500∘ C for 2 h, and the third ramp rate is 5∘ C/min or slower to cool off. After sintering, the alumina ceramic substrate is fabricated to be the dense structure with good mechanical strength. The next step is to screen-print the conductive paste on the substrate to form a planar spiral inductor and a parallel plate capacitor by screen-printing processes. Finally, the conductive paste on the substrate is dried at 150∘ C for 10 min and postfired at 850∘ C for 30 min. The fabricated sensor is presented in Figure 8, with the overall size of 29 mm × 29 mm × 0.48 mm.
4. Measurements and Discussions 4.1. Antenna Configurations. Copper wire is of low-cost and has excellent mechanical and electrical properties. The enameled copper wire measured 1 mm in diameter is chosen to wound a cylindrical helical antenna. The antenna can be used to measure the high-temperature performance of sensor in wireless coupling way. The inductance of the antenna is about 1.5 𝜇H (1 MHz), the DC resistance is 0.125 Ω, outer diameter is 31.6 mm, average pitch is 5.45 mm, and the number of turns is 5.5. The peak of the real part of input impedance curve corresponding to the frequency is selected to approximately represent the self-resonant frequency (SRF) of the antenna or the resonant frequency of the sensor. When the SRF of the antenna is measured, the frequency range is swept from 50 MHz to 70 MHz, as shown in Figure 7. If the sweepfrequency loaded at the terminal of the antenna equals SRF of the antenna, a self-resonance will happen. In this case, the real part of the input impedance will reach a maximum value, and the phase will change obviously at the same time. Thus, the SRF of the antenna is 61.3 MHz read from the characteristic curve “1.”
4.2. Experiment Setups. The melting temperature of silver is about 962∘ C, and the postfiring temperature range of conductive paste is between 850∘ C and 930∘ C in air, which makes it possible for the sensor to work under the maximum temperature of 900∘ C. The experiment setup for wireless coupling measurement is shown in Figure 8. The temperature sensor is affixed to the inside of the thermal insulation material, and it can be heated by Nabertherm LHT-02/16 hightemperature desktop furnace from 19∘ C (room temperature) to 900∘ C, while the antenna is placed in the recess of the outside of the thermal insulation material. Agilent E4991A impedance analyzer is used to analyze the variation of the magnitude and the real part of input impedance versus sweep-frequency at different temperature. It should be noted that the thickness of the insulating layer is 10 mm between the sensor and the antenna, namely, to maintain the coupling distance of 10 mm, where the maximum coupling distance is about 30 mm. In our future work, the maximum coupling distance can be improved by increasing the 𝑄 value of the sensor with a high inductance and a low resistance and adjusting the shape, geometric dimensions, and impedance of antenna to match the sensor. 4.3. Temperature Responses. The resonance frequency of the sensor is measured to be 35.95 MHz at room temperature, lower than the theoretical value. This is mainly affected by processing errors, coupling distance, and parasitic factors. The magnitude and the real part of the input impedance are changed with the uniformly heated temperature, shown in Figure 9. As the temperature rises, curves of the magnitude and the real part of the input impedance are shifted to the lowfrequency direction, the peaks decrease, and the bandwidths of resonances increase gradually, which is consistent with the simulation results shown in Figure 4, but coupling effect is not obvious when temperature approaches 900∘ C. The inductance at low frequency of planar spiral inductor is mainly dependent on its physical dimensions influenced by the low coefficient of thermal expansion (CTE) of alumina ceramic, which is used as the substrate of the temperature sensor. It means that inductance is not greatly affected within
Journal of Sensors
5
(a)
(b)
Impedance analyzer Thermal insulation material Antenna
Furnace (c)
600
250
550
200 Real part (Ω)
Magnitude (Ω)
Figure 8: The top (a) and bottom (b) of sensor prototype and experiment setups (c).
500 450 400
150 100 50
350 300 30
31
19∘ C 100∘ C 200∘ C 300∘ C
32
33 34 Frequency (MHz) 400∘ C 500∘ C 600∘ C 700∘ C
35
36
37
800∘ C 900∘ C
(a)
0 30
31
32
33 34 Frequency (MHz) 400∘ C 500∘ C 600∘ C 700∘ C
19∘ C 100∘ C 200∘ C 300∘ C
35
36
37
800∘ C 900∘ C
(b)
Figure 9: The magnitude (a) and real part (b) of impedance versus frequency over 19∘ C–900∘ C temperature range.
the temperature range. Therefore, the resonant frequency of the sensor decreases due to the increase of capacitance dependent on the increasing permittivity of the ceramic. To illustrate this phenomenon, the impedance versus frequency corresponding to different relative permittivity of ceramic obviously indicates a downshift of resonant frequency in the simulation shown in Figure 4. Since the resonant frequency
change against temperature is monotonic, the permittivity of alumina ceramic can be extracted from the measured impedance according to given temperature. As shown in Figure 10, the extracted relative permittivity of alumina ceramic at room temperature is 3.2% higher than the nominal value and increases from 9.29 to 12.25 within the temperature range.
6
Journal of Sensors 14
38 37 Frequency (MHz)
12
𝜀r
10 8
36 35 34 33 32
f (MHz) = −3.332e − 006 ∗ T2 − 0.001844 ∗ T + 35.86
31 6 4
30
0
100
200
300
400
500
600
700
800
900 1000
Temperature (∘ C)
0
100 200 300 400 500 600 700 800 900 1000
Measurement Data fit
Temperature (∘ C)
Figure 10: Ceramic relative permittivity versus temperature.
Figure 12: Resonant frequency versus temperature. 38
80 Frequency (MHz)
37 60 Q 40 20 0
36 35 34 33 32 31
0
100
200
300
400 500 600 700 Temperature (∘ C)
800
900 1000
100 200 300 400 500 600 700 800 900 1000
1 2
The series resonant circuit is mainly made from silver paste by screen-printing. When the temperature increases, the resistivity of the silver turns big, thereby increasing the equivalent series resistance 𝑅𝑠 of the circuit. The bigger the 𝑅𝑠 is, the smaller the quality factor 𝑄 of the sensor is [19]. 𝑄 factor of the sensor is influenced by temperature-dependent losses, mainly including the metal resistivity and dielectric loss, which can be reflected by a resonance bandwidth. To characterize the 𝑄 value of the sensor changed with the temperature, 𝑄 is approximately defined with bandwidth of the resonance by [20, 21] 𝑓0 , Δ𝑓
0
Temperature (∘ C)
Figure 11: 𝑄 versus temperature.
𝑄=
30
(7)
where 𝑓 is the bandwidth of the resonance, and it is measured using the −3 dB from the peaks. Hence, a resonance with high 𝑄 has a narrow bandwidth. Figure 11 shows the measured 𝑄 of the sensor within the temperature from room temperature to 900∘ C. 𝑄 is decreased from 81.09 at room temperature to 6.95 at 900∘ C, which limits the operation range of the sensor fabricated from the conductive paste and ceramic materials. However, 𝑄 can be improved at high temperatures if the conductivity of these materials has lower dependence upon temperature. Furthermore, high-temperature-stable metals such as platinum enable the operation temperature of the sensor up to 1000∘ C and above [22]; therefore, platinum paste may be a good alternative to silver paste.
Figure 13: Repetitive measurement on resonant frequency versus temperature.
The curve of the resonant frequency according to temperature shows obvious characteristic of quadratic curve in the temperature range of 19∘ C–900∘ C, illustrated in Figure 12, where there is great fluctuation from 19∘ C to 100∘ C, because the desktop furnace heats unevenly during the initial segment of temperature. The data of the resonant frequency versus temperature is fitted and the fitting equation is given by 𝑓 (MHz) = −3.332𝑒 − 006 ∗ 𝑇2 − 0.001844 ∗ 𝑇 + 35.86,
(8)
where 𝑅-squared is 0.9983. The average sensitivity of the sensor on the resonant frequency versus temperature is about 5.17 KHz /∘ C. To achieve repetitive measurement on the frequency response of the input impedance 𝑍, when the temperature inside the furnace is cooled off, the temperature is heated evenly from room temperature to 900∘ C for the second time with the other conditions remaining the same. Figure 13 is the two curves of the resonance frequency versus temperature by measuring the sensor twice. It is obvious that the sensor demonstrates good repeatability within the temperature range. And the second results show that the average
Frequency (MHz)
Journal of Sensors 38 37 36 35 34 33 32 31 30
0
7
100 200 300 400 500 600 700 800 900 1000 Temperature (∘ C) + −
Figure 14: Cycling measurements on resonant frequency versus temperature. “+” is a measurement from room temperature to 900∘ C. “−” is a measurement from 900∘ C to room temperature.
sensitivity of the resonant frequency versus temperature is approximately 5.22 KHz/∘ C, and the relative variation is 0.97% compared to the sensitivity measured first. To make the dynamic response of the sensor clear, cycling measurements on resonant frequency versus temperature are made when the temperature increases from room temperature to 900∘ C and then gradually decreases to room temperature. As shown in Figure 14, the resonant frequency of the sensor can return to the initial value, which indicates that the temperature sensor has good reliability. However, the two curves do not coincide with each other due to temperature difference. The displayed temperature recorded in the experiments is determined by the thermocouple in the furnace, while the resonant frequency depends on the surface temperature of the sensor close to the furnace door. It is known that cooling rate of the location close to the furnace door, made from the thermal insulation material, is faster than the interior of the furnace. Therefore, the surface temperature of the ceramic is lower than the temperature around the thermocouple in heating process, while it is much lower in cooling process. Namely, the surface temperature of the sensor in cooling process is lower than the one in heating process, which results in the resonance frequency of the former higher than the latter. The difference is more obvious in the high-temperature range from 550∘ C to 850∘ C, gradually decreases in the low-temperature range, and is eliminated at room temperature finally. The problem may be solved well by placing the sensor in the position with the uniform temperature where there is no temperature difference.
5. Conclusions A wireless passive temperature sensor realized on multilayer HTCC tapes is designed and fabricated in the paper. The temperature responses on resonant frequency versus the input impedance are measured in wireless coupling way. The relative permittivity of alumina ceramic and 𝑄 factor of the sensor are characterized and discussed. The sensitivity,
the repeatability, and the reliability of the sensor are also explored. As the temperature rises, curves of the magnitude and the real part of the input impedance are shifted to the lowfrequency direction, the peaks decrease, and the bandwidths of resonances increase gradually, but coupling effect is not obvious when temperature approaches 900∘ C. The extracted relative permittivity of alumina ceramic at room temperature is 3.2% higher than the nominal value and increases from 9.29 to 12.25 within the temperature range, and the measured 𝑄 of the sensor is decreased from 81.09 at room temperature to 6.95 at 900∘ C, which limits the operation range of the sensor fabricated from the conductive paste and ceramic materials. The resonant frequency versus temperature shows nonlinear characteristics within the temperature range. The maximum sensitivity of the resonant frequency versus temperature is approximately 5.22 KHz/∘ C. The sensor demonstrates high repeatability with the relative variation of 0.97% compared to the sensitivity measured first and good reliability with the resonant frequency remaining the same initial value after cycling temperature measurements.
Conflict of Interests The authors declare that there is no conflict of interests regarding the publication of this paper.
Acknowledgments The research was supported by China Postdoctoral Science Foundation (no. 2014T70074), the General Program of National Natural Science of China (no. 61471324), the Visiting Scholar Fund (no. 2013MS03), and the Program for the Top Young Academic Leaders of Higher Learning Institutions of Shanxi Province, China.
References [1] S. E. Woodard, C. Wang, and B. D. Taylor, “Wireless temperature sensing using temperature-sensitive dielectrics within responding electric fields of open-circuit sensors having no electrical connections,” Measurement Science and Technology, vol. 21, no. 7, Article ID 075201, 2010. ´ Ramos, A. Lazaro, S. Rima, and R. Villarino, [2] D. Girbau, A. “Passive wireless temperature sensor based on time-coded UWB chipless RFID tags,” IEEE Transactions on Microwave Theory and Techniques, vol. 60, no. 11, pp. 3623–3632, 2012. [3] Y. Moser and M. A. M. Gijs, “Miniaturized flexible temperature sensor,” Journal of Microelectromechanical Systems, vol. 16, no. 6, pp. 1349–1354, 2007. [4] K. G. Kreider and G. Gillen, “High temperature materials for thin-film thermocouples on silicon wafers,” Thin Solid Films, vol. 376, no. 1-2, pp. 32–37, 2000. [5] S. Brohez, C. Delvosalle, and G. Marlair, “A two-thermocouples probe for radiation corrections of measured temperatures in compartment fires,” Fire Safety Journal, vol. 39, no. 5, pp. 399– 411, 2004. [6] H. Choi and X. Li, “Fabrication and application of micro thin film thermocouples for transient temperature measurement in nanosecond pulsed laser micromachining of nickel,” Sensors and Actuators A: Physical, vol. 136, no. 1, pp. 118–124, 2007.
8 [7] E. Li, X. Wang, and C. Zhang, “Fiber-optic temperature sensor based on interference of selective higher-order modes,” Applied Physics Letters, vol. 89, no. 9, Article ID 091119, pp. 1–3, 2006. ¨ [8] S. K. Ozdemir and G. Turhan-Sayan, “Temperature effects on surface plasmon resonance: design considerations for an optical temperature sensor,” Journal of Lightwave Technology, vol. 21, no. 3, pp. 805–814, 2003. [9] C. H. Dong, L. He, Y. F. Xiao et al., “Fabrication of high- Q polydimethylsiloxane optical microspheres for thermal sensing,” Applied Physics Letters, vol. 94, no. 23, pp. 1–3, 2009. [10] Q. Ma, T. Rossmann, and Z. Guo, “Whispering-gallery mode silica microsensors for cryogenic to room temperature measurement,” Measurement Science and Technology, vol. 21, no. 2, Article ID 025310, 2010. [11] M. Viens and J. D. N. Cheeke, “Highly sensitive temperature sensor using SAW resonator oscillator,” Sensors and Actuators: A. Physical, vol. 24, no. 3, pp. 209–211, 1990. [12] M. A. M. Cavaco, M. E. Benedet, and L. R. Neto, “Temperature measurements on hot spots of power substations utilizing surface acoustic wave sensors,” International Journal of Thermophysics, vol. 32, no. 11-12, pp. 2343–2350, 2011. [13] K. G. Ong, C. A. Grimes, C. L. Robbins, and R. S. Singh, “Design and application of a wireless, passive, resonant-circuit environmental monitoring sensor,” Sensors and Actuators, A: Physical, vol. 93, no. 1, pp. 33–43, 2001. [14] D. Marioli, E. Sardini, M. Serpelloni et al., “Hybrid telemetric MEMS for high temperature measurements into harsh industrial environments,” in Proceedings of the IEEE Intrumentation and Measurement Technology Conference (I2MTC ’09), pp. 1429–1433, May 2009. [15] R. I. Rodriguez and Y. Jia, “A wireless inductive-capacitive (LC) sensor for rotating component temperature monitoring,” International Journal on Smart Sensing and Intelligent Systems, vol. 4, no. 2, pp. 325–337, 2011. [16] Y. Wang, Y. Jia, Q. Chen, and Y. Wang, “A passive wireless temperature sensor for harsh environment applications,” Sensors, vol. 8, no. 12, pp. 7982–7995, 2008. [17] R. Nopper, R. Has, and L. Reindl, “A wireless sensor readout system-circuit concept, simulation, and accuracy,” IEEE Transactions on Instrumentation and Measurement, vol. 60, no. 8, pp. 2976–2983, 2011. [18] S. S. Mohan, M. D. M. Hershenson, S. P. Boyd, and T. H. Lee, “Simple accurate expressions for planar spiral inductances,” IEEE Journal of Solid-State Circuits, vol. 34, no. 10, pp. 1419–1424, 1999. [19] Y. Jia, K. Sun, F. J. Agosto, and M. T. Qu˜ıones, “Design and characterization of a passive wireless strain sensor,” Measurement Science and Technology, vol. 17, no. 11, pp. 2869–2876, 2006. [20] H. Zheng, I. M. Reaney, D. Muir, T. Price, and D. M. Iddles, “Effect of glass additions on the sintering and microwave properties of composite dielectric ceramics based on BaOLn2 O3 -TiO2 (Ln = Nd, La),” Journal of the European Ceramic Society, vol. 27, no. 16, pp. 4479–4487, 2007. [21] M. Ghafourian, G. E. Bridges, A. Z. Nezhad, and D. J. Thomson, “Wireless overhead line temperature sensor based on RF cavity resonance,” Smart Materials and Structures, vol. 22, no. 7, Article ID 075010, 2013. [22] X. Ren, S. Ebadi, Y. Chen, L. An, and X. Gong, “Hightemperature characterization of SiCN ceramics for wireless passive sensing applications up to 500∘ C,” in Proceedings of the IEEE 12th Annual Wireless and Microwave Technology Conference (WAMICON ’11), pp. 1–5, Clearwater Beach Clearwater, Fla, USA, April 2011.
Journal of Sensors
International Journal of
Rotating Machinery
Engineering Journal of
Hindawi Publishing Corporation http://www.hindawi.com
Volume 2014
The Scientific World Journal Hindawi Publishing Corporation http://www.hindawi.com
Volume 2014
International Journal of
Distributed Sensor Networks
Journal of
Sensors Hindawi Publishing Corporation http://www.hindawi.com
Volume 2014
Hindawi Publishing Corporation http://www.hindawi.com
Volume 2014
Hindawi Publishing Corporation http://www.hindawi.com
Volume 2014
Journal of
Control Science and Engineering
Advances in
Civil Engineering Hindawi Publishing Corporation http://www.hindawi.com
Hindawi Publishing Corporation http://www.hindawi.com
Volume 2014
Volume 2014
Submit your manuscripts at http://www.hindawi.com Journal of
Journal of
Electrical and Computer Engineering
Robotics Hindawi Publishing Corporation http://www.hindawi.com
Hindawi Publishing Corporation http://www.hindawi.com
Volume 2014
Volume 2014
VLSI Design Advances in OptoElectronics
International Journal of
Navigation and Observation Hindawi Publishing Corporation http://www.hindawi.com
Volume 2014
Hindawi Publishing Corporation http://www.hindawi.com
Hindawi Publishing Corporation http://www.hindawi.com
Chemical Engineering Hindawi Publishing Corporation http://www.hindawi.com
Volume 2014
Volume 2014
Active and Passive Electronic Components
Antennas and Propagation Hindawi Publishing Corporation http://www.hindawi.com
Aerospace Engineering
Hindawi Publishing Corporation http://www.hindawi.com
Volume 2014
Hindawi Publishing Corporation http://www.hindawi.com
Volume 2014
Volume 2014
International Journal of
International Journal of
International Journal of
Modelling & Simulation in Engineering
Volume 2014
Hindawi Publishing Corporation http://www.hindawi.com
Volume 2014
Shock and Vibration Hindawi Publishing Corporation http://www.hindawi.com
Volume 2014
Advances in
Acoustics and Vibration Hindawi Publishing Corporation http://www.hindawi.com
Volume 2014