WORDRANK: A METHOD FOR RANKING WEB PAGES BASED ON CONTENT SIMILARITY
Apostolos Kritikopoulos, Martha Sideri, Iraklis Varlamis Athens University of Economics and Business
[email protected], {sideri, varlamis}@aueb.gr
Abstract This paper presents WordRank, a new page ranking system, which exploits similarity between interconnected pages. WordRank introduces the model of the ‘biased surfer’ which is based on the following assumption: “the visitor of a web page tends to visit web pages with similar content rather than content irrelevant pages”. The algorithm modifies the random surfer model by biasing the probability of a user to follow a link in favor of links to pages with similar content. It is our intuition that WordRank is most appropriate in topic based searches, since it prioritizes strongly interconnected pages, and in the same time is more robust to the multitude of topics and to the noise produced by navigation links. This paper presents preliminary experimental evidence from a search engine we developed for the Greek fragment of the worldwide Web. For evaluation purposes, we introduce a new metric (SI score) which is based on implicit user's feedback, but we also employ explicit evaluation, where available.
1. Introduction Some of the most successful and elegant approaches to Web information retrieval are based on the realization of the importance of the link structure of the Web. In fact, the two most successful approaches to web information retrieval, Google’s Pagerank [22] and Kleinberg’s hubs and authorities [16] are in principle based exclusively on link structure. The typical scenario for a web search engine is: a) a global ranking is calculated for every web page and this ranking is used to order the results of a web search, b) there is no previous knowledge on the relevance of a page to the
search, c) the quality of ranking is measured in terms of user satisfaction. This work proposes a modification of the Pagerank algorithm. We analyze the internal mechanisms of Pagerank and modify them in an attempt to further improve the ranking of web pages in a set and consequently the quality of web search results. User satisfaction is measured by combining explicit and implicit user feedback.
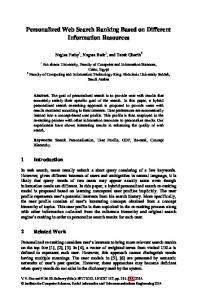
1.1. Motivating example The idea of Pagerank is that every web page has an initial score which is equally propagated to the pages it points to. In every iteration of the algorithm, the score of every page ’p’ is updated to the sum of all incoming scores and is re-distributed to the pages pointed by ‘p’. The algorithm converges to a Pagerank value for every page. The result of running Pagerank in a set of web pages is that highly interconnected pages (good hubs and authorities) are ranked higher than others. However, a hyperlink between two pages can have multiple purposes, for example navigating, referencing [24].etc. Let us consider the homepage of a web directory comprising various topics. This page has many links to each topic and is considered a good hub. It is also a good authority since it is pointed to by many pages. Obviously, this page will receive a high Pagerank score although it is very general and consequently not very useful in a topic specific search. On the other side, a wiki page on a certain topic contains fewer links to many topic related pages and is pointed by fewer pages but the majority of them are on the same topic (e.g. to other wiki services, vertical portals etc) (see Figure 1). In a topic specific search we would prefer the wiki page to be ranked higher than the general web directory page. Unfortunately, since the connectivity of the wiki page is significantly
smaller than that of the web directory homepage, the Pagerank algorithm gives the opposite result.
results of the evaluation process and the metrics we employed. Finally, section 7 presents the conclusion drawn from our approach and discusses possible improvements of the ranking algorithm.
2. Related Work
Figure 1. The graph of a web directory and a topic specific wiki Following the motivating example, a search for the terms "cars" and "wiki" in Google, prioritizes the Wikipedia page on the American music-band "Cars", and leaves the wikipedia page on "automobiles" in the second place. A specialized wiki page on cars (wikicars.org) comes third. The wikicars page disappears when searching for "car" and "wiki". The Wikipedia page in this case acts as a directory page, receives a high score from Pagerank and biases the search results. When the similarity of content between hyperlinked pages is considered, we give higher priority to hyperlinks that connect topic related pages and lower to general or navigational links. The expected effect of our approach is that hubs and authorities on a single topic (or few topics) are ranked higher than generic hubs and authorities that comprise many topics. In order to validate our intuition, we test our approach in the Greek fragment of the worldwide Web (more than 4 million documents). We let users search our set of pages and evaluate the ranked results explicitly by providing relevance marks. We also record and analyze clickthrough data (the number and order of clicks). The users’ evaluation results are very encouraging. In the following section we present related work on web document ranking, starting with the Pagerank algorithm and its extensions and modifications and we introduce the main concepts of our algorithm. In section 3 we present in details the formulas that simulate the random and biased surfer’s behavior and introduce the WordRank algorithm. Section 4 presents the setup for our experiments, whereas section 5 details on how Pagerank and WordRank compete in producing satisfying results. Section 6 illustrates the
The random surfer model - Pagerank The main idea behind Pagerank algorithm [22] is that the hyperlinks of a page model the page authors' idea of where users should go next. Based on this, it is assumed that the visitor of a web page clicks on one any of the pages’ links with equal probability, totally random (random surfer). Based on this model, every web page gets a global ranking which reflects its connectivity in the web graph.
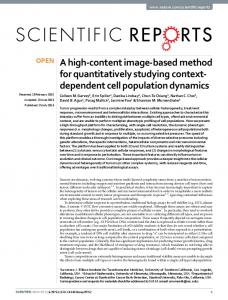
Figure 2. Pagerank results: bigger circles for highly ranked pages Recent modifications of the basic algorithm fall into three major categories: a) personalized ranking algorithms, which modify ranking using user preferences information, b) results’ re-ranking algorithms, which modify pages’ ranking in the scope of a query using query terms information, c) global ranking algorithms, which replace the random surfer model with a model that they claim to be closer to the real web user. In the majority of personalization or results’ re-ranking algorithms, different rankings are pre-computed for every page for all different topics. The final ranking score for a page is computed at real-time as the weighted-aggregate of all partial scores of the page. The weights indicate how interested is a user, or how relative is a query, to each specific topic. TopicSensitive Pagerank [12] computes a set of Pagerank vectors per user. Each vector in the set corresponds to a topic and signifies the interest of the user to the specific topic. By merging these pre-computed vectors, the algorithm generates query-specific ranking for pages at query time. This technique is modified in [14]
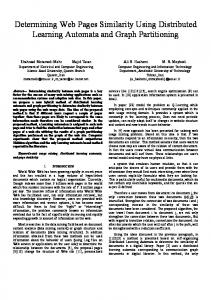
so that it scales well with the corpus size and the number of users. In [3] users specify interest profiles as binary feature vectors and the method pre-computes ranking scores for each profile vector by assigning a weight to each URL based on the match between the URL and the profile features. A weighted Pagerank vector is then computed based on URL weights, and used at query time to rank results. Authors in [23] refine the Pagerank algorithm, by using a probabilistic model guided by the relevance of a page to a query, to improve the results of the searches. The idea of an Intelligent Surfer that selectively visits the outgoing hyperlinks of a page is used instead of the Random Surfer. This is similar to the Bias Surfer model used in WordRank, however the way the hyperlinks are prioritized differs. WordRank calculates a global ranking that relies on the content similarity between hyperlinked pages, whereas the model of Intelligent Surfer is based on the similarity of the documents with each of the query terms. The biased surfer model - BiasRank The algorithms that capitalize on the global ranking of web pages adopt the following idea: “The real web surfer does not visit all the outgoing links of a page with equal probability but the selection is affected by some characteristics of the pages”. In [28] greater weight is assigned to links towards pages further off in the web, and less weight is given to links between nearby pages. In [4] surfer’s choice is skewed by: the relative and absolute position of links in the page and the length of the anchor text. In [26], instead of giving an equal distribution of probability to each of the links from a page, the number of traversals on each of the links is used as the weight of the link, hence the more traversals, the more weighted vote is given the page pointed by the link. [7] assumes a topic-driven search supported by a page classifier. The probability of a page’s visitor to follow a hyperlink is proportional to the relevance of the target page to the topic. Finally, [5] addresses the issue of specific keyword searches and how a global ranking, such as this achieved with Pagerank is skewed in a real keyword base search. The sketches in figures 2 and 3, show that when the biased surfer model is used, several pages loose part of their ranking (circle shaded with dots is smaller in figure 3) since they are connected to general pages, where as other pages gain in score (the circle with horizontal stripes in the bottom left of figure 3) because they are interconnected with relevant pages.
Figure 3. BiasRank results on the same graph: similarity in shading denotes the bias An in depth analysis of the experimental results presented in the works above, makes clear that the real web surfer behavior is not at all random. In the contrary, it is reasonable to consider the Biased-surfer model in order to simulate users’ behavior. In this direction, we present our algorithm, WordRank, which implements the biased-surfer model based on the following assumption: “the visitor of a web page tends to visit web pages with similar content rather than content- irrelevant pages”. In a variation of WordRank for the blogosphere [19], connectivity and similarity features between blogs have been used in biasing the model. The main difference between the two and the one proposed in [7] is that the probability of following a hyperlink does not depend on the relevance of the target page to a topic but on the similarity of the target page to the current page. The basic intuition behind our approach is the following: the user was driven to a page because she was looking for a topic or she is interested in the main subject of the page, and she is most probably going to continue her quest by selecting similar pages. For example, we consider a user who is currently looking at a page on skydiving. This page has links to other skydiving pages and to pages on other subjects; i.e. to the web design company that build the page, to a search engine, to a weather forecasting portal or to the homepage of a skydiver. We assume that the user is more interested in skydiving and the related pages that to the web design company homepage. Evaluation of user satisfaction The primary aim of a web page ranking algorithm is to prioritize pages of higher importance to the user. Of
course, it is difficult to decide whether a ranking is better than another. There are mainly two approaches in evaluating the quality of a ranking algorithm. Both approaches consider that users submit queries, get ranked lists of URLs as a reply and expect to have the most relevant URLs ranked high. The first approach assumes that the relevance of the document to the query is known in advance (i.e. in TREC tests- http://trec.nist.gov). The quality of the ranking algorithm is measured among the top-K ranked documents, using metrics such as recall (number of relevant documents in the top-K list divided by the number of all relevant documents) and precision (number of relevant documents in the top-K listed divided by K). The second approach assumes that there is no relevance information for the documents. In this case, relevance information is provided as a feedback by the users and reflects user satisfaction. User feedback can be either implicit or explicit depending on the way user satisfaction is captured. Approaches assume that users are presented a ranked set of links to the documents accompanied by a title, a URL and a short description. Based on this information users decide and click on the first most relevant link. They visit more links only if they are not satisfied with those already visited and they visit the least relevant links at the end. In implicit evaluation the order of clicks, the time spent in each link, the time spent in reading a description etc, are useful feedback information, which is recorder without users’ intervention. In explicit evaluation, the user gives a satisfaction score for every hyperlink she visits. An important contribution of this paper is the definition of a metric of user satisfaction that combines implicit and explicit user feedback. With this metric we measure user satisfaction for the relevance of a page to the query and we evaluate the ranking algorithm. Joachims [15] introduced techniques based entirely on clickthrough data to learn ranking functions. Fox et al. [8] enriched clickthrough data with more behavioral data and developed Bayesian models to correlate implicit measures and explicit relevance. [1] and [2] present a rich list of clickthrough features and define some useful evaluation metrics. However, they use explicit information only.
3. The ranking algorithm Random and Biased Rank Pagerank score is a numeric value that represents the centrality of a web page, and denotes the actual
probability for a random surfer reaching that page after clicking on many links. The algorithm figures that when one page links to another page, it is effectively casting a vote for the other page. The more votes that are cast for a page, the more important the page must be. Also, the importance of the page that is casting the vote determines how important the vote itself is. The Pagerank score for a page A is:
⎛ P (U 1 ) P (U n ) ⎞ (Eq. 1) ⎟ P ( A) = (1 − E ) + E ⎜⎜ + ... + O (U n ) ⎟⎠ ⎝ O (U 1 ) where, P(Ui) is the score of urls Ui which links to url A, O(Ui) is the number of outgoing links on url Ui and E is a damping factor which can be set between 0 and 1 (usually is 0.85). Regardless of incoming links, the probability for the random surfer jumping to a page is always 1-E, so a page has always a minimum Pagerank score, because a random surfer does not click on an infinite number of links, but jumps to another page at random when bored. The random surfer model assumes uniform probability 1/N (N is the number of links in a page) for the surfer to jump to any other page. We introduce a new perspective of Pagerank that we call it BiasRank (Eq.2): (Eq.2) BR( A) = (1 − E ) + E[ FN (U 1→ A )* BR(U 1 ) + ...
+ FN (U n→ A ) * BR(U n )] where BR(A) is the BiasRank of url A, BR(Ui) is the BiasRank of url Ui which links to url A, E is a damping factor which can be set between 0 and 1 FN(Un→A) is the possibility of a surfer that stands on Url z to select Url j and denotes a factor which shows how much the page Un “fancies” page A. The following equation stands: t
∑ FN (U j =1
z→ j
) = 1 (Eq. 3)
Where: z a Url which has t outlinks FN(Uz→j) is the possibility that the surfer will choose Url j
BiasRank is a generalization of Pagerank. The Pagerank formula derives from formula (1) if we assume that FN(Uz→j)=1/N where N is the total number of outlinks in Url z. We consider BiasRank as the family of all algorithms that modify the random surfer model of Pagerank. WordRank The algorithm suggested in this work, WordRank, is a subtype of BiasRank. WordRank gives higher importance to those links that point to pages with common content. The importance of a link between two documents is computed on the frequency of the common words between the two documents. This is a the simplest method in computing similarity. More efficient feature selection and similarity computation methods can be employed (e.g. using keywords or concepts only from the hyperlink area [26]), to further improve WordRank efficiency. As a result the possibility of a surfer that stands on Url x to select Url z in WordRank is:
FN (U x→ z ) =
Q * C x,z + 1 t
∑ (Q * C j =1
x, j
+ 1)
=
Q * C x , z + 1 (Eq. 4) t
t + Q∑ C x, j j =1
Where: x a Url which has t outlinks (one of them points to z) Q (equalizer) a factor which is equal or greater than zero Cx,z the cosine similarity of the keyword frequency vectors of urls x and z
∑ (f
⋅f
ix iy word ix ≡ word iy ∈ wx ∩ w y Cx,z =
∏(
)
f ix2 + f iy2 word ix ≡ word iy ∈ wx ∩ w y )
(Eq. 5)
The WordRank (WR) of every page in the graph is computed in two steps. At the first step we compute the FN of all pages. Then we use the results of the first step to estimate the final WordRank values. The second step is repeated until the sum of all WordRank values in the graph converges. The algorithm involves the creation of a content vector for each page and the calculation of similarity for all pairs of pages. The similarities are pre-computed and stored before being used in WordRank calculation so the computational load from this step does not affect the second step. Definitions T: the set of all pages in graph; X: a web page OX: all pages pointed by X IX: all pages that point to X SumX: the sum of similarities of X and every page in OX We assume that T is the reference set, as a result
OX ⊆ T The factor Q (Q>=0) declares the importance of the word-based similarity between the pages. If we declare Q as 0, then the WordRank is exactly the same as Pagerank because it doesn’t take into account the factor of word similarity between the urls. If we believe that this similarity is very important, then we have to increase the factor Q, as it is proportional to the significance of the mutual words between two pages. A great value of Q eliminates the importance of the links with no small amount of common words. Assume that a page in url x is represented by a keyword frequency vector wx ={(fix, wordix)} The similarity between two pages x and z is the similarity between the vectors wx and wy.
We first compute the sum of similarities between all pages in the graph:
∑ Sum
TotalSim =
∀X : X ∈T
X
=
∑ ∑C
∀X : X ∈T ∀Z :Z∈OX
Initial Step:
∀X : X ∈ T Î Set tmpSum = 0 Set WRX=1
∀Z : Z ∈ O X ÎSet FN(UX→Z)=
1 + Q ⋅ C x,z
O X + Q ⋅ TotalSim
X ,Z
Repetitive Step: Tot_Prev_WR = MaxInteger; Tot_Cur_WR = 0; Convegence = MaxInteger; Desired_Convegence = 0.0001; while (Convegence>Desired_Convegence) begin set SUM_WR_Of_Current_Step = 0
∀X : X ∈ T Î set tmpSum = 0; ∀Y : Y ∈ I X Î tmpSum=tmpSum+FN(UY→X)*WRY; set WRX = (1-E) + E * tmpSum; set Tot_Cur_WR= Tot_Cur_WR+ WRX set Convegence = Tot_Prev_WR - Tot_Cur_WR; end In the repetitive step of PageRank we use the basic algorithm definition. There are some approaches like the one described in [10], which speed up the calculation process of Pagerank. It is our intention to use these methods and apply them for faster calculation of the WordRank.
4. Experimental setup We implemented our method on top of SpiderWave [25], a research search engine for the Greek fragment of the Web (about 4 million documents, basically the .gr domain) designed by our research group, which can be clicked from the Web site of our University (http://spiderwave.aueb.gr) as an alternative search engine. SpiderWave totally resides on the server-side, and it was extended to include the capability of applying different sorting methods on the results for a query. The hardware we used was only a simple server PC (Pentium 4, 3.2 GHz, 2Gb memory, 117 Gb and 378Gb hard drives, Microsoft Windows 2003 Server). At the same PC we hosted the search engine, the crawling mechanism [18] and the database with the Greek corpus and the user information. Users are able to log on to the site and start their evaluation session, which can be continued at any time. The ranking algorithm used within an evaluation session varies in a random fashion. Whenever a query is asked, our experiment engine flips a fair coin to decide whether the answer will be sorted through Pagerank or WordRank. In either case we monitor the
user’s response (the results clicked, the satisfaction of the user (a rank between 1 (worst) and 5 (best), the order in which they were clicked, and the timing of the clicks –even though we do not use the latter data in our evaluation). We evaluate the user’s response by the ranking that she applied to the URLs that she visited. Comparison between the two suites (the one with the Pagerank and the one with the WordRank), followed by a statistical test, improves that WordRank is significantly better than Pagerank and it improves the quality of the returned results.
5. Evaluation of ranking results The amount of information and the variety of topics of Web pages makes the quality of ranking the most important dimension in assessing search engine performance. When a-priori knowledge on the relevance of a page to a user’s query exists, the traditional IR evaluation criteria, i.e., precision and recall, can be applied to judge on the ranking algorithm performance [6]. When an ideal ranking of pages exists, we can compare our results over it (i.e. using Spearman’s rank correlation coefficient) [13]. When both types of information are absent we rely on human judgments, in order to evaluate the quality of ranking.
5.1. Metrics of user satisfaction In our experiments we do not assume a priori knowledge neither on the ranking of documents nor on their relevance to every possible query. We rely on users’ judgments in order to define the quality of ranking and use two to compute the user's satisfaction: the first is called Average User Satisfaction (AUS) and requires explicit user feedback (users selectively mark the results of a search), the second is called Success Index (SI), it was presented in [17], and is based on implicit user feedback. The typical use case for our search engine is that the user of Spiderwave enters a query and chooses between the presented results. The URL is presented and the user is called to declare her satisfaction with a vote (a number between 1=not satisfied and 5=extremely satisfied). The user could vote many urls from the result set, although she can visit some urls without voting (we assume that the vote for these cases is 0).
the other hand is an automated way to characterize the value of the results presented by a search engine.
The AUS is the average of all votes:
∑ vote
u
visited _ urls
AUS=
visited _ urls
6. Experimental results
(Eq. 6)
The Success Index does not require the user to vote for his satisfaction. We record the URLs clicked by the user, and the order of clicks.
SI =
1 n n − t +1 ∑ n t =1 d t * n
(Eq.7)
where: n is the total number of the URLs selected by the user dt is the order in the list of the t-th URL selected by the user Success Index [20] gives values between 0 and 1. We also record the timing of each click but still not use it in our formula. The SI score rewards the clicking of high items early on. The reverse ranks of the items clicked are weight-averaged, with weights decreasing linearly from 1 down to 1/n with each click. For example, suppose n = 2 and the documents ranked 2 and 10 were clicked. If 2 is clicked first, then the SI score is bigger (27.5%); if second, smaller (17.5%). More controversially, SI penalizes many clicks; for example, the clicking order 2-1-3 has higher score than 1-2-3-4 (see the table below). Absence of clicks (the empty set) are scored zero –even though there were no such instances. Some examples of dt sequences and their SI scores:
Tables 1,2. Examples of the SI score. Selection Order
1
SI score
100%
Selection 1 2 Order SI score
2
1
3
5
42,59%
3 4
40,10%
7
10
3
10,10%
4 3
2 1
25%
1 2
38,88%
5 8
7
2 1
15,71%
The Average User Satisfaction (AUS) represents the quality of the returned URLs, because it is based on the actual votes made by the user. Success Index on
Some information on our experiments and the results follow: Time period of experiments: 24/10 – 31/10 General statistics Number of logged-in users: Number of queries asked: Number of queries ranked by the user:
38 212 67
Group A) Ranked queries which were based on the Pagerank algorithm (E=0.85) Number of queries: 32 Average user satisfaction: 2.25 (1-worst to 5-best) Average Success Index: 0.2811 Group B) Ranked queries which were based on the WordRank algorithm (E=0.85, Q=1) Number of queries: 35 Average user satisfaction: 3.53 (1-worst to 5-best) Average Success Index: 0.5826 For group A the coin flip and determined that the result set of URLs will be sorted using the Pagerank of each web page. For group B the engine sorted the presented queries by using the WordRank algorithm. As we can see the average ranking of the user's satisfaction (3.53) in WordRank's queries is much higher than the Pagerank's equivalent (2.25). We observe great difference if we compare the SI scores as well. Evaluation of satisfaction metrics In order to test the difference between the two metrics, we performed a t-Test on the 67 queries ranked by the user. The web-based search engine (Figure 4) was open to anyone that would like to use it. Anyone could register (in order to track each user’s clickthrough behavior) and pass the queries she wanted. We compared the Average User Satisfaction (divided by 5 to normalize) and the SI score. Our null hypothesis was that the ratings obtained by SI score average at least 0.1 than the corresponding ranks from the AUS method, and we tested the claim at the 5% level. The p value was 44.71% which is
definitely larger than 5% and that means that our null hypothesis cannot be rejected and we can safely conclude that the two metrics are significant similar. In other words, we found no evidence that the average of the SI score and the AUS method significantly differ.
Figure 4: The SpiderWave search engine In a verification test, we compared the scores for the two metrics (SI and AUS) for every query using the cosine similarity metric [9]. We created a vector for every metric comprising the scores for all the queries. The size of the two vectors is n=67 and the cosine similarity using the following formula
∑
n
Sim( SI , AUS ) =
i =1
∑
n
SI i * AUSi
SI i2 * i =1
∑
n
i =1
AUSi2
is computed Sim(SI,AUS)=0.796, indicating that the two metrics produce similar results Submitting these results to the t-Test statistical analysis (for AUS: P= 0.0017