The World Input-Output Database (WIOD) project Robert Stehrer The Vienna Institute for International Economic Studies (wiiw) www.wiiw.ac.at
[email protected]
OECD-WPTSG meeting November 18, 2009 – OECD, Paris Robert Stehrer, wiiw Socio-economic Project funded under the 7th Framework Programme, Theme 8: Socio-Economic Sciences and Humanities Grant agreement no. 225 281 indicators: Current work and plans
Robert Stehrer, wiiw
WIOD: Constructions and applications
The World Input-Output Database: General structure EU project funded within the 7th framework programme www.wiod.org Project started in May 2009; prospective end in April 2012 Construction and applications • Construction of intercountry SUT/IO tables: • Data become publicly available at end of project • Applications ∗ Socioeconomic issues ∗ Environmental issues ∗ (Policy) Modeling
Robert Stehrer, wiiw
WIOD: Constructions and applications
Partners involved • RUG (NL): University of Groningen (coordinator) • IPTS (ES): Institute for Prospective Technology Studies • wiiw (AT): The Vienna Institute for International Economic Studies • ZEW (DE): Zentrum f¨ ur Europ¨aische Wirtschaftsforschung ¨ • WIFO (AT): Osterreichisches Institut f¨ ur Wirtschaftsforschung • HTWG (DE): Hochschule Konstanz • TCBE (NL): The Conference Board Europe • CPB (NL): Netherlands Bureau for Economic Policy Analysis • ICCS (GR): Institute of Communication and Computer Systems • CRSA (FR): Central Recherche SA • OECD: not (yet) formally
Robert Stehrer, wiiw
WIOD: Constructions and applications
The World Input-Output (WIOD) Database: Overview
Robert Stehrer, wiiw
WIOD: Constructions and applications
Data coverage Data are collected by partners based on various datasources
• Intercountry Supply-Use and Input-Output tables • 1995-2006 • 40 countries included ∗ 27 EU countries ∗ 26(+3/4) OECD members (accession/enhanced engagement)
Robert Stehrer, wiiw
WIOD: Constructions and applications
WIOD country coverage
Robert Stehrer, wiiw
WIOD: Constructions and applications
Data coverage Data are collected by partners based on various datasources
• Intercountry Supply-Use and Input-Output tables • 1995-2006 • 40 countries included ∗ 27 EU countries ∗ 26(+3/4) OECD members (accession/enhanced engagement) • Sectoral classifications ∗ 60 products ∗ 40 industries (NACE) • Plus satellite accounts • Attempts to create deflated tables
Robert Stehrer, wiiw
WIOD: Constructions and applications
WIOD database: Core • Harmonized Supply and Use (Make) tables and national IO tables • Import tables ∗ Import USE tables ∗ Import IO tables • Dataset of trade in goods (product level) and services (BOP codes) Note: Coverage of SUT, IO and Import tables vary across countries and years (various sources, ...)
Robert Stehrer, wiiw
WIOD: Constructions and applications
WIOD database: Satellite accounts • Socioeconomic indicators ∗ TFP, educational intensity, capital stock (ICT and Non-ICT), etc. (KLEMS type data)
∗ Other: Intangible capital, etc. ∗ FDI, Foreign affiliates, ... • Environmental indicators ∗ ∗ ∗ ∗
Energy use (various energy carrier) Water use Emissions Others (waste)
• Might not have full coverage Note: Coverage varies across countries and years (various sources, ...)
Robert Stehrer, wiiw
WIOD: Constructions and applications
Applications • Socioeconomic analysis ∗ Factor content of trade ∗ Effects of outsourcing on labor markets ∗ Trade in value added, value added chains, ... • Environmental analysis • Modeling ∗ CGE modeling ∗ Dynamic IO-based modeling
Robert Stehrer, wiiw
WIOD: Constructions and applications
The World Input-Output (WIOD) Database: Construction issues
Robert Stehrer, wiiw
WIOD: Constructions and applications
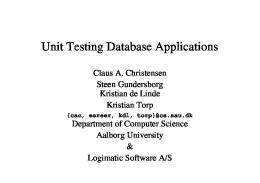
Ideallyt ... t
(1) Balanced SUT system consistent with NA ... Table 1.3:
A simplified supply and use framework Products
Industries
Products
AgriIndustrial cultural products products
Industries Services
Agriculture
Industry
Final uses Service Final conactivities sumption
Gross capital formation
Exports
Total
Agricultural products Intermediate consumption by product and by industry
Industrial products
Final uses by product and by category
Total use by product
Services Agriculture Industry
Total output by industry
Output of industries by product
Service activities Value added by component and by industry
Value added Imports
Total imports by product
Total
Total supply by product
Total value added Total imports
Total output by industry
Total final uses by category
= not applicable
Source: Eurostat Manual of Supply, Use and Input-Output Tables
Robert Stehrer, wiiw
WIOD: Constructions and applications
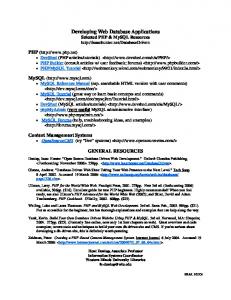
... (2) with import use tables ...
4 Trade, hotel, transport
Imported products for intermediate consumption at c.i.f. values
5 Financial, real, business 6 Other services 7 Total at basic prices
10
11
12
13
14
15
Imported products for final uses at c.i.f. values
Intermediate consumption by industry
Final uses by category
= Import vector of the supply table
Source: Eurostat Manual of Supply, Use and Input-Output Tables
Robert Stehrer, wiiw
WIOD: Constructions and applications
Total
3 Construction work
9
16
17
Imported final uses
2 Products of industry
8
Imported total uses
7
Exports intra EU FOB
6
Exports extra EU FOB
5
Changes in valuables
Total
4
Final consumption expenditure by households Final consumption expenditure by nonprofit organisations Final consumption expenditure by government Gross fixed capital formation
3
1 Products of agriculture
Imported intermediates
Trade, hotel, transport
2
PRODUCTS (CPA) No
FINAL USES
Finance, real estate, business
Industry
1
Construction
Agriculture
INDUSTRIES (NACE)
Changes in inventories
INDUSTRIES (NACE)
Total use at basic prices
Use table for imports
Other service activities
Table 7.1:
... (2) with import use tables ...
4 Trade, hotel, transport
Imported products for intermediate consumption at c.i.f. values
5 Financial, real, business 6 Other services 7 Total at basic prices
10
11
12
13
14
15
Imported products for final uses at c.i.f. values
Intermediate consumption by industry
Total
3 Construction work
9
16
17
Imported final uses
2 Products of industry
8
Imported total uses
7
Exports intra EU FOB
6
Exports extra EU FOB
5
Changes in valuables
Total
4
Final consumption expenditure by households Final consumption expenditure by nonprofit organisations Final consumption expenditure by government Gross fixed capital formation
3
1 Products of agriculture
Imported intermediates
Trade, hotel, transport
2
PRODUCTS (CPA) No
FINAL USES
Finance, real estate, business
Industry
1
Construction
Agriculture
INDUSTRIES (NACE)
Changes in inventories
INDUSTRIES (NACE)
Total use at basic prices
Use table for imports
Other service activities
Table 7.1:
Final uses by category
= Import vector of the supply table
Source: Eurostat Manual of Supply, Use and Input-Output Tables
(3) and bilateral trade data consistent with SUT/IO trade vectors Robert Stehrer, wiiw
WIOD: Constructions and applications
Construction of inter-country tables Assuming (1) and (2) is satisfied; but (3) does not hold
• Trade data based approach ∗ Fix (bilateral) trade data and adjust IO tables to them ? Not considering trade in intermediate inputs ? Considering trade in intermediate inputs (basically applying proportionality assumption)
Robert Stehrer, wiiw
WIOD: Constructions and applications
Construction of inter-country tables Assuming (1) and (2) is satisfied; but (3) does not hold
• Trade data based approach ∗ Fix (bilateral) trade data and adjust IO tables to them ? Not considering trade in intermediate inputs ? Considering trade in intermediate inputs (basically applying proportionality assumption)
• SUT/IO tables based approach ∗ Use SUT/IO data from NSI sources and ’adapt’ trade data ? Benchmark to import (export) columns in SUT data
∗ Use (bilateral) trade data to break down by country of origin or destination ? Use end-use categories (BEC) to differentiate between ID and FD
Robert Stehrer, wiiw
WIOD: Constructions and applications
Discussion: Trade data based approach + Balanced and reconciled trade data available (or routines) + Relies on Social Accounting Matrix (SAM) approach (CGE modeling literature) + Additional countries might be included rather easily Does not require to adjust bilateral trade data matrix − Intermediate trade in goods (if at all): proportionality assumption used − Changes in existing IO tables (e.g. RAS procedure) − Based on IO tables rather than SUT framework
Robert Stehrer, wiiw
WIOD: Constructions and applications
Discussion: SUT/IO data based approach + Based on SUT framework (more flexibility) + Based on existing SUT/IO data (in some cases linked to NA data) + Trade figures at product level + Using industry of imported intermediate products is better measured − Adjustment of trade figures (balancing, overall constraints, ...) − Including additional country requires recalculation of trade data (change in bilateral trade flows if SUT/IO trade columns differ from trade data)
... feasible approach for • rather small and fixed set of countries • and rather aggregated product/industry level
Robert Stehrer, wiiw
WIOD: Constructions and applications
In practice: • Construction/interpolation of SUT and import tables [Requirements (1a), (1b) and (2)]
• Construction of internally consistent trade data [Requirements (3a)]
• 2-way interaction between use of SUT/IO and trade data [Exchange of information making/justifying assumptions]
• Construction will require (ad-hoc) assumptions and ’guesstimations’ ∗ Comparisons ∗ Documentation
Robert Stehrer, wiiw
WIOD: Constructions and applications
WIOD construction: Ongoing work
Robert Stehrer, wiiw
WIOD: Constructions and applications
Data issues: WIOD supply and use tables • Construction/Interpolation of missing tables • Construction of inter-country SUT tables from benchmark tables ∗ First use information from import SUT tables to ... ? ... split imports into demand categories (II, final demand, ...) ? ... to calculate use of imported products by industry for II
∗ Use international trade data to split cells in import USE matrix by sourcing country
Robert Stehrer, wiiw
WIOD: Constructions and applications
Data issues: Trade in goods • Correspondence HS6 to NACE and HS6 to BEC ⇒ HS6-NACE-BEC • Alternative to BEC/Adaption of BEC? • Balancing, reconciling and benchmarking with data from SUT/IO ∗ (Well-known) Data problems: Missing trade, confidentials, re-exports and re-imports, mirror flows
Robert Stehrer, wiiw
WIOD: Constructions and applications
Data issues: Trade in services • Bilateral service trade data from various sources ∗ UN, IMF, Eurostat, OECD, WTO, (IIDE-TSD)) • Data problems ∗ Coverage ∗ Internal consistency and consistency across databases (Documentation) ∗ Correspondence BOP to sector/product level • Service exports and imports by country and WIOD sectors (though even aggregate) ∗ Balancing and mirror flows ∗ Construction of full bilateral data set (Gravity type model, RAS based approach,...)
Robert Stehrer, wiiw
WIOD: Constructions and applications
Forthcoming events: December 3-4, 2009: Internal project meeting, OECD, Paris, France. May 26-28, 2010: WIOD conference, Vienna, Austria.
Robert Stehrer, wiiw
WIOD: Constructions and applications
Thank you for attention! www.wiod.org Comments to:
[email protected]
Robert Stehrer, wiiw
WIOD: Constructions and applications