WSNAP: a Flexible Platform for Wireless Sensor Networks Data Collection and Management M. Cerra, L. Zuech
C. Torghele, P. Pivato, D. Macii, D. Petri
Tretec S.r.1. Trento, Italy
DISI - Dipartimento di Ingegneria e Scienza dell'Informazione University of Trento Trento, Italy
Abstract - Flexible, distributed monitoring systems are essential to support decisions in a variety of contexts such as, for instance, vehicular traffic control, emergency evacuation plans, energy optimization services, pollutant detection or intelligent agriculture applications. In this paper, we present WSNAP, a platform for Wireless Sensor Network (WSN) deployment. WSNAP relies on standard technologies, which enable users to interact easily with different types of sensors. Its main advantage is the ability to be easily adapted to the requirements of different applications, regardless of network topology and sensor board architecture. WSNAP was tested on a small WSN deployed at the "Dipartimento di Ingegneria e Scienza dell'Informazione" (DISI) of the University of Trento, Trento, Italy. In the following, after describing the structure and the main features of the platform, the results of some experiments are reported. Keywords - Wireless sensor networks, environmental monitoring, distributed measurement systems, databases.
I. INTRODUCTION In last years the adoption of wireless sensor networks (WSNs) for distributed monitoring systems has become prominent. As known, a WSN consists of a quite large number of tiny, low-power, embedded devices with sensing, computing, processing and wireless communication capabilities [1]. Usually, these devices are referred to as sensor nodes. The collaborative work of these nodes is used to perform distributed and coordinated measurement of different quantities (e.g., temperature, humidity, light or wind intensity). WSNs have many potential fields of application, such as target tracking, surveillance, biomedical health monitoring, habitat monitoring and elderly care. In principle, WSNs are supposed to work unattended in harsh, hostile or out-of-reach locations. In fact, the flexibility of a wireless network made up of a variety of autonomous sensor nodes can be hardly achieved with conventional wired solutions. For such reasons, WSNs are very suitable for environmental, structural and energy monitoring. Environmental monitoring - besides being concerned with precision agriculture [2],[3], reserve observations [4],[5],[6], natural phenomena [7] and pollution [8] - is increasingly motivated by the severe climatic changes, which the world is undergoing. For instance, the SensorScope project was focused on the development of a WSN-based measurement system for real-time and long-term monitoring of natural events, such as glacier ice-melting [9]. In the field of structural monitoring, up to now WSNs have been mostly used to check the health of buildings, bridges and
978-1-4244-4848-7/09/$25.00 ©2009 IEEE
other civil structures by measuring various quantities, such as vibrations, deflections and stress [10]. The main objective of these technologies is to improve people safety, especially when aged structures are used [11],[12]. One of the largest and most famous examples of WSNs for structural health monitoring (SHM) is the 64-node network located on the main span of the Golden Gate Bridge in San Francisco, USA [13]. The idea of using the WSNs in the field of energy monitoring applications is defmitely more recent. In fact, to the best of our knowledge, just a few research results exist in this field at the moment [14],[15]. However, WSNs are expected to have a major role in next-generation solutions for reducing energy consumption (e.g., through building automation systems [16]). Two quite common problems in environmental, structural and energy monitoring applications are data arrangement and WSN management. In this paper we will present WSNAP (Wireless Sensor Network Application Platform), a platform for WSN that was explicitly designed to meet the requirements of manifold monitoring services (Le., based on different kinds of sensors). After a short overview of other existing solutions (Section II), we will summarize the key features of the platform in Section III. In Section IV the results of some experimental activities will be reported. Finally, conclusions will be drawn in Section V. II. RELATED WORK When multiple heterogeneous quantities are measured by WSN nodes, the way in which sensor data are collected, stored, processed and retrieved is essential to support decisions. Usually, most of hardware/software monitoring solutions based on WSNs are tailored to the requirements of some specific application. For instance, some researchers at the University of Madeira, Portugal, implemented a WSNbased monitoring system for art conservation purposes [17]. The network prototype consists of just 3 sensor nodes, which measure humidity, temperature, light and pollutants. Through a sink node, the data are stored wirelessly into a database resident in a PC connected to the Internet. A web interface enable remote users to visualize the data in real time. Unfortunately, the flexibility and portability features of the proposed solution are not clearly described in the paper. Therefore, the possibility of extending the proposed solution to other scenarios is not straightforward. In the PermaSense project [18], a 10-node WSN based on the TinyNode platform [19], with a fixed, single-hop, multi-
WSN
DELTAMULTISENS (Ti nyOS based )
~ t Re s e t
Nowatchdogl IIl l fe ed
10"Ii" tion (opt . 1
T IMER
I I
~ I
h--~----,
......".
Se nd volt a e ov e r rad";
(D
Acq!.Mr~ se~sors: IUmU"lO Slt y t emper at ure air n um iciit v so il
I
Loca lzation
msg ( optio nal)
T
4
l ni ti a l i Z a ti O n :
- se ns ors det ecbon . e na bling led s. tim e r. wa t hdo g . LPL an d
Lo V/ Po wer List e ning ( LPL)
1 1I
moi s tur~
D at a p rocess i ng
no de -b a se d gr a ph s
BASE STATION
10 > 0
NODES
Data g rap hs pre vie 1/'1. se nso r-base d gr ap h s.
I
Multihop routing
10 = 0 Data Table s
Node se l f-t e st and w lt ag e se nso r de t e cti o n
DATABASE
........
TRETECTRA WLE R
eve rse rial port
II
3M at e l
progr a mmng bo ard se nal TT L to USB
rd~~~~~~~~~ "'net v,(lrk topo log y
. ............
Se nd radio me ss age s
Uo de s
r-;
WSN me ssag e for war c:ing to PC
·,"t ~ Te m porar v loc al dat a"
1..... .. "Loca tion I~ " P OS ,
Coo rd,
°Senso rs
V"",,~e:~~~~
pn on t y
Se ns o rs
«.J.
Ol d
50 'o'n g
t
-., I De code Inc o mi ng
...--------~~~I
W~
I
Ol d
mmages
0Node
add r
"Pa re nt add r "Sens o r l d
- sca l e
d 1 V.
"Off se t div , ,-".:.. ' ':.:. ' .:..'_ _---I
°Sens Val
" ~~~: 'ty
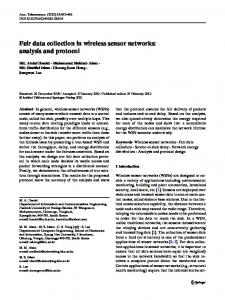
Fig, I - Structure and principle of operation of the Wireless Sensor Network Application Platform (WSNAP) ,
III. PLATFORM DESCRIPTION
sink topology, was installed in the Bernese Alps of Switzerland to gather permafrost rock-related parameters, which in tum were used to assess mountain slope stability. The solution developed for PermaSense was conceived and optimized to tackle a very specific scientific problem. Thus, it is not very suitable for generic environmental monitoring purposes. More recently, the researchers of the Shanghai Ocean University, China, designed and implemented a WSN platform for greenhouse monitoring [20]. The WSN is composed of a set of sensor nodes that collect data from the environment and transmit the gathered information to a sink device .' The software applications for WSN management were developed only using commercial tools (e.g., .NET Framework 2.0) . Such applications comprise a database, a data processing engine, a back-stage module supporting data visualization, and a graphical user interface (QUI) to display the status of the networks and other information. The basic structure of the WSNAP project described in this paper is quite similar to the solution proposed in [20]. However, WSNAP extends the basic idea of the Chinese researchers because it is not related to any specific monitoring application. Also, it relies only on open source technologies. WSNAP was developed for two complementary purposes, i.e, • Enabling network administrators to manage different WSNs, regardless of the number of nodes, network topology and sensor types; • Allowing remote users to check the status of the network as well as to visualize and to analyze the collected data simply and intuitively.
WSNAP is the result of a cooperation between the research group in Embedded Electronics and Computing Systems (EECS) of the University of Trento, Trento, Italy and Tretec S.r.l., a spin-off company of the same University. WSNAP consists of both firmware and software modules. The firmware was developed in C/NesC, in order to ease code porting if different sensor node architectures supporting TinyOS are used in the future [21]. The software side of WSNAP instead comprises various applications based on standard web technologies. Such applications run on a Personal Computer (PC) configured as a server and connected to the internet. WSN and PC are bridged by means of a special node, in the following referred to as base-station, which gathers all data collected by the other devices. The structure of WSNAP is shown in Fig. 1 and consists of four main parts, i.e, DeltaMultiSens, TretecTrawler, Database and Web Utilities. DeltaMultiSens includes the set of C/NesC modules controlling the behavior of a generic WSN node . DeltaMultiSens checks if a given node is the base-station or a nonnal sensor node. The base-station checks its battery voltage level, waits for possible incoming data and transfers them to the PC through a Universal Serial Bus (USB) connection. All the other nodes performs the same sequence of operations regardless of the network topology and the type of on-board sensors. In particular, during the start-up phase, DeltaMultiSens detects what sensors are actually installed on a given device . Afterwards, each node (except the base-station) periodically turns the sensor board on, samples the quantities measured by every sensor and fmally sends the collected data
2
0_
, --""'_#'M'''''',,,'I,
L~'M!'@:' ''.!''''IU I'd
'"
~iCa
.......
C X
1
.&J C~ahosl: :61/~Ad'rwlj-
-
~
php!4:;A:W1ln
@) ~~[Q]12l ~(j)base
.,
tretectrawter(1) lIl IIl lIl IIl II III Il
alti anced_ll rapll s baller,r orapll s motemso mun,ple_orapns nodes sensQls
0 0 0 0 0 0 0 0 0 0 0 0 0 0 0 0 0 0 0 0 0 0 0 0 0 0 0 0 0
•
inl(3)
longle",
!!IQ ~
_
.. . .-
••
~
_
I'
_ _ w ~~ .w
~
ult8_oeneraUi
~
uIt8_oeneraU I
II II II
uIt8_oeneral_ci
~ ~ ~
inl(l1)
II
~
inl(11)
II
~
II
~
longitude
~
ult8_11eneraU i If _chip
ult8_oeneraUI
~
~
II
....
~
101(11) inl(3)
~
inl(3) inl(3) inl(3) 101(11)
II III II
~
~
s 1..J1' n ::il III ::il III ::il III II III ::il III :il III :il III ::il III :il III :AI III ::il III :il III :il III II III ::il III
I;'
T
I>'
T
III
T
I>'
T
!2 !2 !'5'
T T T
I>'
T
I'i'
T
12
T
IJ!
I>'
T
I;'
T
I>'
T
EI T cf i'!I
"
:il III !2
T
(a) '~'@! 'M ,.@! " "m . C
x
!If 1m;.; Uf"
[email protected] @ild'I;'
c;:. ~Iltlp:/r;ahosl:"",,,", i/~ =,,,,,=
~~ "~=
~
W Se rver: loclIlhost . f&lOlltalban : tret ectu wle r . III Tabe lla: n nso rs ~ Mos1 ra
ph.
!JAdmJn
tre tectrawte r(1) lI IIl lIl II IIl
a""", nced_orapns baller,r orapll s molemsll muRlple_orapll s III nodes II sensors
0 0 0 0 0 0 0 0 0 0 0 0 0 0 0 L
•
lI SQl
Q' S1rult... "
c_
I Cefta
Too
j.i mer isd M lltJUli
inl(3)
li Es porla
l!j!lmporta
PredefNlIlo
Extra
uIt8_0eneral_ci
lWe _info
uIt8_oeneral_cl uIt8_oeneral_cl utf8_oeneral_cl
"""""
uIt8_oeneral_cl
III
~
:il III III
~
Ii Ii
~
"
uIt8_11eneral_cl
scal.u illlidef
"
scalll _offsel f~ .. ~
"
f.~~~
~~~~ !'~~~'!1:".'!. '.~~~!J!!"!
Selencn a tutti I Desetencna tutti Se sele zionati.
~
II
X
(l SWola
II II II
"
uIt8_oeneral_ci
~~~.a;c:x
8 Qperuioni
X X X ~ X ~ X X II II ~ X X II ~ X X II ~ X X 1:1 ~ X X II ~ X
N.
.".
-
~.
"
....
T
u
~
i'!I
""
}
[;l
"
}
Ii " "i' "> Ii
X Elimlna
"'" u
} } }
cf i'!I i:ii III 12 T i:ii III 12 j:J i:ii III !'5' T u
::i: III 12 T i:ii III iZ ::i: III ;l' T i:ii III EI T ;l' III :L
'.
visuelizza per stam p a 4:1 Prop on i ta srrcrtura de lla tabe lla III !-< Agglungi ~ c a mpO( i ) 0 .AJla h n e deli a ta b ella O AJI'inizlo delia t abelia o D o po ~ 1
,··