XWeB: the XML Warehouse Benchmark Hadj Mahboubi1 and J´erˆome Darmont2
arXiv:1102.0372v1 [cs.DB] 2 Feb 2011
1
CEMAGREF Clermont-Ferrand 24 avenue des Landais, BP 50085, 63172 Aubi`ere Cedex, France
[email protected] – http://eric.univ-lyon2.fr/~hmahboubi/ 2 Universit´e de Lyon (ERIC Lyon 2) 5 avenue Pierre Mend`es-France, 69676 Bron Cedex, France
[email protected] – http://eric.univ-lyon2.fr/~jdarmont/
Abstract. With the emergence of XML as a standard for representing business data, new decision support applications are being developed. These XML data warehouses aim at supporting On-Line Analytical Processing (OLAP) operations that manipulate irregular XML data. To ensure feasibility of these new tools, important performance issues must be addressed. Performance is customarily assessed with the help of benchmarks. However, decision support benchmarks do not currently support XML features. In this paper, we introduce the XML Warehouse Benchmark (XWeB), which aims at filling this gap. XWeB derives from the relational decision support benchmark TPC-H. It is mainly composed of a test data warehouse that is based on a unified reference model for XML warehouses and that features XML-specific structures, and its associate XQuery decision support workload. XWeB’s usage is illustrated by experiments on several XML database management systems. Keywords: benchmark, XML data warehouse, OLAP, TPC-H
1
Introduction
With the increasing volume of XML data available, and XML now being a standard for representing complex business data [2], XML data sources that are pertinent for decision support are ever more numerous. However, XML data bear irregular structures (e.g., optional and/or diversely ordered elements, ragged hierarchies, etc.) that would be intricate to handle in a relational Database Management System (DBMS). Therefore, many efforts toward XML data warehousing have been achieved [14,17,29], as well as efforts for extending the XQuery language with On-Line Analytical Processing (OLAP) capabilities [9,12,26]. XML-native DBMSs supporting XQuery should naturally form the basic storage component of XML warehouses. However, they currently present relatively poor performances when dealing with the large data volumes and complex analytical queries that are typical in data warehouses, and are thus challenged by relational, XML-compatible DBMSs. A tremendous amount of research is currently in progress to help them become a credible alternative, though. Since performance is a critical issue in this context, its assessment is primordial.
Database performance is customarily evaluated experimentally with the help of benchmarks. However, existing decision support benchmarks [7,15,16,24] do not support XML features, while XML benchmarks [4,5,20,28] target transactional applications and are ill-suited to evaluate the performances of decisionoriented applications. Their database schemas do not bear the multidimensional structure that is typical in data warehouses (i.e., star schemas and derivatives bearing facts described by dimensions [11]); and their workloads do not feature typical, OLAP-like analytic queries. Therefore, we present in this paper the first (to the best of our knowledge) XML decision support benchmark. Our objective is to propose a test XML data warehouse and its associate XQuery decision support workload, for performance evaluation purposes. The XML Warehouse Benchmark (XWeB) is based on a unified reference model for XML data warehouses [14]. An early version of XWeB [13] was derived from the standard relational decision support benchmark TPC-H [25]. In addition, XWeB’s warehouse model has now been complemented with XML-specific irregular structures, and its workload has been both adapted in consequence and expanded. The remainder of this paper is organized as follows. In Section 2, we present and discuss related work regarding relational decision support and XML benchmarks. In Section 3, we recall the XML data warehouse model XWeB is based on. In Section 4, we provide the full specifications of XWeB. In Section 5, we illustrate our benchmark’s usage by experimenting on several XML DBMSs. We finally conclude this paper and provide future research directions in Section 6.
2 2.1
Related Work Relational Decision Support Benchmarks
The OLAP APB-1 benchmark has been very popular in the late nineties [15]. Issued by the OLAP Council, a now inactive organization founded by four OLAP solution vendors, APB-1’s data warehouse schema is structured around Sale facts and four dimensions: Customer, Product, Channel and Time. Its workload of ten queries aims at sale forecasting. Although APB-1 is simple to understand and use, it proves limited, since it is not “differentiated to reflect the hurdles that are specific to different industries and functions” [22]. Henceforth, the Transaction Processing Performance Council (TPC) defines standard benchmarks and publishes objective and verifiable performance evaluations to the industry. The TPC currently supports one decision support benchmark: TPC-H [25]. TPC-H’s database is a classical product-order-supplier model. Its workload is constituted of twenty-two SQL-92, parameterized, decision support queries and two refreshing functions that insert tuples into and delete tuples from the database, respectively. Query parameters are randomly instantiated following a uniform law. Three primary metrics are used in TPC-H. They describe performance in terms of power, throughput, and a combination of these two criteria. Power and throughput are the geometric and arithmetic mean values of database size divided by workload execution time, respectively.
Although decision-oriented, TPC-H’s database schema is not a typical starlike data warehouse schema. Moreover, its workload does not include any explicit OLAP query. The TPC-DS benchmark, which is currently in its latest stages of development, fixes this up [24]. TPC-DS’ schema represents the decision support functions of a retailer under the form of a constellation schema with several fact tables and shared dimensions. TPC-DS’ workload is constituted of four classes of queries: reporting queries, ad-hoc decision support queries, interactive OLAP queries, and extraction queries. SQL-99 query templates help randomly generate a set of about five hundred queries, following non-uniform distributions. The warehouse maintenance process includes a full Extract, Transform and Load (ETL) phase, and handles dimensions with respect to their nature (non-static dimensions scale up while static dimensions are updated). One primary throughput metric is proposed in TPC-DS to take both query execution and the maintenance phase into account. More recently, the Star Schema Benchmark (SSB) has been proposed as a simpler alternative to TPC-DS [16]. As our early version of XWeB [13], it is based on TPC-H’s database remodeled as a star schema. It is basically architectured around an order fact table merged from two TPC-H tables. But more interestingly, SSB features a query workload that provides both functional and selectivity coverages. As in all TPC benchmarks, scaling in TPC-H, TPC-DS and SSB is achieved through a scale factor SF that helps define database size (from 1 GB to 100 TB). Both database schema and workload are fixed. The number of generated queries in TPC-DS also directly depends on SF . TPC standard benchmarks aim at comparing the performances of different systems in the same experimental conditions, and are intentionally not very tunable. By contrast, the Data Warehouse Engineering Benchmark (DWEB) helps generate various ad-hoc synthetic data warehouses (modeled as star, snowflake, or constellation schemas) and workloads that include typical OLAP queries [7]. DWEB targets data warehouse designers and allows testing the effect of design choices or optimization techniques in various experimental conditions. Thus, it may be viewed more like a benchmark generator than an actual, single benchmark. DWEB’s main drawback is that its complete set of parameters makes it somewhat difficult to master. Finally, to be complete, TPC-H and TPC-DS have recently be judged insufficient for ETL purposes [21] and specific benchmarks for ETL workflows are announced [21,27]. 2.2
XML Benchmarks
XML benchmarks may be subdivided into two families. On one hand, microbenchmarks, such as the Michigan Benchmark (so-named in reference to the relational Wisconsin Benchmark developed in the eighties) [19] and MemBeR [1], help XML documents storage solution designers isolate critical issues to optimize. More precisely, micro-benchmarks aim at assessing the individual performances of basic operations such as projection, selection, join and aggregation. These low-
level benchmarks are obviously too specialized for decision support application evaluation, which requires testing complex queries at a more global level. On the other hand, application benchmarks help users compare the global performances of XML-native or compatible DBMSs, and more particularly of their query processor. For instance, X-Mach1 [4], XMark [20], XOO7 (an extension of the object-oriented benchmark OO7) [5] and XBench [28] are application benchmarks. Each implements a mixed XML database that is both data-oriented (structured data) and document-oriented (in general, random texts built from a dictionary). However, except for XBench that proposes a true mixed database, their orientation is either more particularly focused on data (XMark, XOO7) or documents (X-Mach1). These benchmarks also differ in: the fixed or flexible nature of the XML schema (one or several Document Type Definitions – DTDs – or XML Schemas); the number of XML documents used to model the database at the physical level (one or several); the inclusion or not of update operations in the workload. We can also underline that only XBench helps evaluate all the functionalities offered by the XQuery language. Unfortunately, none of these benchmarks exhibit any decision support feature. This is why relational benchmarks presented in Section 2.1 are more useful to us in a first step.
3
Reference XML Warehouse Model
Existing XML data warehouse architectures more or less converge toward a unified model. They mostly differ in the way dimensions are handled and the number of XML documents that are used to store facts and dimensions. Searching for the best compromise in terms of query performance and modeling power, we proposed a unified model [14] that we reuse in XWeB. As XCube [10], our reference XML warehouse is composed of three types of XML documents at the physical level: document dw-model.xml defines the multidimensional structure of the warehouse (metadata); each f actsf .xml document stores information related to set of facts f (several fact documents allow constellation schemas); each dimensiond .xml document stores a given dimension d’s member values for any hierarchical level. More precisely, dw-model.xml ’s structure (Figure 1) bears two types of nodes: dimension and F actDoc nodes. A dimension node defines one dimension, its possible hierarchical levels (Level elements) and attributes (including types), as well as the path to the corresponding dimensiond.xml document. A F actDoc element defines a fact, i.e., its measures, references to the corresponding dimensions, and the path to the corresponding f actsf .xml document. The f actsf .xml documents’ structure (Figure 2(a)) is composed of f act subelements that each instantiate a fact, i.e., measure values and dimension references. These identifierbased references support the fact-to-dimension relationships. Finally, the dimensiond.xml documents’ structure (Figure 2(b)) is composed of Level nodes. Each of them defines a hierarchy level composed of instance
DW-model dimension dimension @id
@path
dimension
measure
FactDoc
dimension
@id
@path
Level @name
@id
attribute @name
@id
@idref
attribute
@type
Fig. 1. dw-model.xml graph structure
nodes. An instance defines the member attributes of a hierarchy level as well as their values.
4 4.1
XWeB Specifications Principle
XWeB derives from TPC-H, modified in a number of ways explained in the following sections, for three reasons. First, we acknowledge the importance of TPC benchmarks’ standard status. Hence, our goal is to have XWeB inherit from TPC-H’s wide acceptance and usage (whereas TPC-DS is still under development). Second, from our experience in designing the DWEB relational data warehouse benchmark, we learned that Gray’s simplicity criterion for a good benchmark [8] is primordial. This is again why we preferred TPC-H, which is much simpler than TPC-DS or DWEB. Third, from a sheer practical point of view, we also selected TPC-H to benefit from its data generator, dbgen, a feature that does not exist in TPC-DS yet. The main components in a benchmark are its database and workload models. XWeB’s are described in Sections 4.2 and 4.3, respectively. In a first step, we do not propose to include ETL features in XWeB, although XQuery has been complemented with update queries recently [6]. ETL is indeed a complex process that presumably requires dedicated benchmarks [21]. Moreover, the following specifications already provide a raw loading evaluation framework. The XWeB warehouse is indeed a set of XML documents that must be loaded into an XML DBMS, an operation that can be timed.
Fig. 2. f actsf .xml (a) and dimensiond .xml (b) graph structures
4.2
Database Model
Schema. At the conceptual level, like O’Neil et al. in SSB, we remodel TPC-H’s database schema as an explicit multidimensional (snowflake) schema (Figure 3), where Sale facts are described by the Part/Category, Customer/Nation/Region, Supplier/Nation/Region and Day/Month/Year dimensions. The Part/Category hierarchy, which is not present in TPC-H, is of particular interest. It is indeed both non-strict and non-covering [23]. Beyer et al. would term it ragged [2]. We prefer the term complex since ragged hierarchy has different meanings in the literature; e.g., Rizzi defines it as non-covering only [18]. More precisely, in our context, non-strictness means relationships between parts and categories, and between categories themselves, are many-to-many. Non-coveringness means parts and subcategories may roll up to categories at any higher granularity level, i.e., skipping one or more intermediary granularity levels. Complex hierarchies do exist in the real world, are easy to implement in XML, whereas they would be intricate to handle in a relational system [2]. At the logical level, the UML class diagram from Figure 3 translates into an instance of dw-model.xml (Figure 4). Attributes (fact measures and dimension members) are not mentioned in Figure 4 for brevity, but they are present in the actual document. Finally, at the physical level, fact and dimension instances are stored in a set of XML documents, namely f acts1 .xml = f sale.xml, dimension1 = d date.xml, dimension2 = d part.xml, dimension3 = d customer.xml and dimension4 = d supplier.xml. To introduce further XML-specific features in XWeB, f sale.xml’s DTD allows missing dimension references and measures, as
Fig. 3. XWeB warehouse’s conceptual schema
well as any order in fact subelements. Our aim here is to introduce a measure of “dirty data” in the benchmark. Parameterization. XWeB’s main parameters basically help control data warehouse size. Size (S) depends on two parameters: the scale factor (SF ) inherited from TPC-H, and density D. When D = 1, all possible combinations of dimension references are present in the fact document (Cartesian product), which is very rare in real-life data warehouses. When D decreases, we progressively eliminate some of these combinations. D actually helps control the overall size of facts independently from the size of dimensions. S can be estimated as follows: S = Sdimensions + Sf acts , where Sdimensions is the size of dimensions, which does not change when PSF is fixed, and Sf acts is the size of facts, which depends on D. Sdimensions = d∈D |d|SF × nodesize(d) and
Fig. 4. XWeB warehouse’s logical schema
Q Sf acts = d∈D |hd1 |SF × D × f act size, where D is the set of dimensions, |d|SF the total size of dimension d (i.e., all hierarchy levels included) w.r.t. SF , |hd1 |SF the size of the coarsest hierarchy level in dimension d w.r.t. SF , nodesize(d) the average node size in dimensiond .xml, and f act size the average fact element size. For example, when SF = 1 and D = 1, with node sizes all equal to 220 bytes, the size of f sale.xml is 2065 GB. Eventually, two additional parameters control the probability of missing values (Pm ) and element reordering (Po ) in facts, respectively. Schema Instantiation. The schema instantiation process is achieved in two steps: first, we build dimension XML documents, and then the fact document. Dimension data are obtained from dbgen as flat files. Their size is tuned by SF . Dimension data are then matched to the dw-model.xml document, which contains dimension specifications, hierarchical levels and attribute names, to output the set of dimensiond .xml (d ∈ D) documents. d part.xml, which features a complex hierarchy, is a particular case that we focus on. Algorithm from Figure 5 describes how categories are assigned to parts from d part.xml. First, category names are taken from TPC-H and organized in three arbitrary levels in the cat table. Moreover, categories are interrelated through rollup and drill-down relationships to form a non-strict hierarchy. For example,
level-2 category BRUSHED rolls up to level-1 categories NICKEL and STEEL, and drills down to level-3 categories ECONOMY, STANDARD and SMALL. The whole hierarchy extension is available on-line (Section 6). Then, to achieve noncoveringness, we assign to each part p several categories at any level. p.catset denotes the set of categories assigned to p. Each “root” category (numbering from 1 to 3) is selected from a random level lvl. Then, subcategories may be (randomly) selected from subsequent levels. Non-coveringness is achieved when initial level is lower than 3 and there is no subcategory. ncat and nsubcat refer to category and subcategory numbers, respectively. cand denotes a candidate category or subcategory. |cat[i]| is the number of elements in table cat’s ith level.
cat := [[BRASS, COPPER, NICKEL, STEEL, TIN], [ANODIZED, BRUSHED, BURNISHED, PLATED, POLISHED], [ECONOMY, LARGE, MEDIUM, PROMO, SMALL, STANDARD]] FOR ALL p IN d_part DO p.catset := EMPTY_SET ncat := RANDOM(1, 3) FOR i := 1 TO ncat DO lvl := RANDOM(1, 3) REPEAT cand := cat[lvl, RANDOM(1, |cat[lvl]|)] UNTIL cand NOT IN p.catset p.catset := p.catset UNION cand nsubcat := RANDOM(0, 3 - lvl) FOR j := 1 TO nsubcat DO cand := cat[lvl + j, RANDOM(1, |cat[lvl + j]|)] IF cand NOT IN p.catset THEN p.catset := p.catset UNION cand END IF END FOR END FOR END FOR
// level 1 // level 2 // level 3
Fig. 5. Part category selection algorithm
Facts are generated randomly with respect to the algorithm from Figure 6. The number of facts depends on D, and data dirtiness on Pm and Po (Section 4.2). D, Pm and Po are actually used as Bernouilli parameters. val is a transient table that stores dimension references and measure values, to allow them to be nullified and/or reordered without altering loop index values. The SKEWED RANDOM() function helps generate “hot” and “cold” values for measures Quantity and T otalAmount, which influences range queries. Finally, the SWITCH() function randomly reorders a set of values.
FOR ALL c IN d_customer DO FOR ALL p IN d_part DO FOR ALL s IN d_supplier DO FOR ALL d IN d_date DO IF RANDOM(0, 1) 5000
p name,
and y yearkey Q14 Sum of f quantity and f totalamount per c name, p name and y yearkey Complex hierarchy
y yearkey c mktsegment = ”AUT O-
c name,
MOBILE”
p name,
and y yearkey = 2002
y yearkey
Q15 Avg of f quantity and f total-
t name
amount per t name Q16 Avg of f quantity and f total-
t name = ”BRUSHED”
t name
t name = ”BRUSHED”
p name
p size > 40
p name
p size > 40
t name
p size > 40
t name
amount per t name Q17 Avg of f quantity and f totalamount per p name Q18 Sum of f quantity and f totalamount per p name Q19 Sum of f quantity and f totalamount per t name Q20 Sum of f quantity and f totalamount per t name
to derive any more complex, composite metrics, such as TPC-H’s throughput and power if necessary, while remaining simple.
5
Sample Experiments
To illustrate XWeB’s usage, we compare in this section a sample of XML-native DBMSs, namely BaseX3 , eXist4 , Sedna5 , X-Hive6 and xIndice7 . We focus on XML-native systems in these experiments because they support the formulation of decision support XQueries that include join operations, which are much more difficult to achieve in XML-compatible relational DBMSs. In these systems, XML documents are indeed customarily stored in table rows, and XQueries are embedded in SQL statements that target one row/document, making joins between XML documents difficult to express and inefficient. Our experiments atomize the execution protocol from Section 4.3, on one hand to separately outline how its steps perform individually and, on the other hand, to highlight performance differences among the studied systems. Moreover, we vary data warehouse size (expressed in number of facts) in these experiments, to show how the studied systems scale up. Table 2 provides the correspondence between the number of facts, parameters SF and D, and warehouse size in kilobytes. Note that warehouse sizes are small because most of the studied systems do not scale up on the hardware configuration we use (a Pentium 2 GHz PC with 1 GB of main memory and an IDE hard drive running under Windows XP). The possibility of missing values and element reordering is also disregarded in these preliminary experiments, i.e., Pm = Po = 0. 5.1
Load Test
Figure 7 represents loading time with respect to data warehouse size. We can cluster the studied systems in three classes. BaseX and Sedna feature the best loading times. BaseX is indeed specially designed for full-text storage and allows compact and high-performance database storage, while Sedna divides wellformed XML documents into parts of any convenient size before loading them into a database using specific statements of the Data Manipulation Language. Both these systems load data about twice faster than X-Hive and xIndice, which implement specific numbering schemes that optimize data access, but require more computation at storage time, especially when XML documents are bulky. Finally, eXist performs about twice worse than X-Hive and xIndice because, in addition to the computation of a numbering scheme, it builds document, element and attribute indexes at load time. 3 4 5 6 7
http://www.inf.uni-konstanz.de/dbis/basex/ http://exist.sourceforge.net http://www.modis.ispras.ru/sedna/ http://www.emc.com/domains/x-hive/ http://xml.apache.org/xindice/
Table 2. Total size of XML documents
SF
D
Number of facts Warehouse size (KB) −7
1 1/14 × 10
500
1710
−7
1000
1865
1
−7
2/7 × 10
2000
2139
1
3/7 × 10−7
3000
2340
1
−7
4/7 × 10
4000
2686
1
5/7 × 10−7
5000
2942
1
−7
6000
3178
7000
3448
1
1
5.2
1/7 × 10
6/7 × 10 10−7
Performance Test
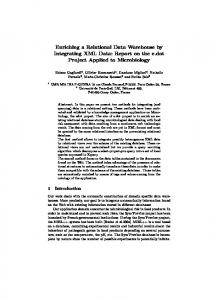
In this set of experiments, we measure query execution time with respect to data warehouse size. Since we rapidly test the limits of the studied systems, we only and separately evaluate the response of reporting, 1-dimension cube, and complex hierarchy-based queries, respectively. In terms of workload parameters, RE = 1D = CH = T RU E and 2D = 3D = F ALSE. Moreover, we stop time measurement when workload execution time exceeds three hours. Finally, since we perform atomic performance tests, they are only cold runs (i.e., N RU N = 0). Figure 8 represents the execution time of reporting queries (RE) with respect to warehouse size. Results clearly show that X-Hive’s claimed scalability capability is effective, while the performance of other systems degrades sharply when warehouse size increases. We think this is due to X-Hive’s specifically designed XProc query Engine (a pipeline engine), while Sedna and BaseX are specially designed for full-text search and do not implement efficient query engines for structural query processing. Finally, eXist and xIndice are specifically adapted to simple XPath queries processed on a single document and apparently do not suit complex querying needs. In Figure 9, we plot the execution time of 1D cube queries (1D) with respect to warehouse size. We could only test Sedna and X-Hive here, the other systems being unable to execute this workload in a reasonable time (less than three hours). X-Hive appears the most robust system in this context. This is actually why we do not push toward the 2D and 3D performance tests. Only X-Hive is able to execute these queries. With other systems, execution time already exceeds three hours for one single query. The combination of join and grouping operations (which induce further joins in XQuery) that are typical in decision support queries should thus be the subject of dire optimizations. Finally, Figure 10 features the execution time of complex hierarchy-based queries (CH) with respect to warehouse size. In this test, we obtained results only with X-Hive, Sedna and BaseX. Again, X-Hive seems the only XML-native
Sedna
Xindice
X-Hive
eXist
BaseX
14000
Loading time (ms)
12000 10000 8000 6000 4000 2000 0 1
2
3
4
5
6
7
8
Number of facts
Fig. 7. Load test results
DBMS to be able to scale up with respect to warehouse size when multiple join operations must be performed.
6
Conclusion and Perspectives
When designing XWeB, which is to the best of our knowledge the first XML decision support benchmark, we aimed at meeting the four key criteria that make a “good” benchmark according to Jim Gray [8]. Relevance means the benchmark must answer various engineering needs. This is why we chose to base our work on a TPC standard. We also introduced more tunability, both at schema and workload levels, to adapt to the reality of XML DBMSs. Portability means the benchmark must be easy to implement on different systems. To this aim, we implemented XWeB with the Java language that allows connecting to most XML DBMSs through APIs (we used the very popular XML:DB8 ). Scalability means it must be possible to benchmark small and large databases, and to scale up the benchmark, which is achieved by inheriting from the SF parameter. Further tuning is achieved through the density (D) parameter. Eventually, simplicity means that the benchmark must be understandable, otherwise it will not be credible nor used. This is why we elected to base XWeB on TPC-H rather than TPC-DS or DWEB. In this paper, we also illustrated XWeB’s relevance through several experiments aimed at comparing the performance of five native-XML DBMSs. Although basic and more focused on demonstrating XWeB’s features than comparing the studied systems in depth, they highlight X-Hive as the most scalable 8
http://xmldb-org.sourceforge.net/xapi/
X-Hive
Sedna
BaseX
eXist
Workload execution time (ms)
60000000 50000000 40000000 30000000 20000000 10000000 0 100
250
500
1000
2000
3000 4000
5000 6000
Number of facts
Fig. 8. RE performance test results
system, while full-text systems such as BaseX seem to feature the best data storage mechanisms. Due to equipment limitations, we remain at small scale factors, but we believe our approach can be easily followed for larger scale factors. We also show the kind of decision support queries that require urgent optimization: namely, cubing queries that perform join and grouping operations on a fact document and dimension documents. In this respect, XWeB had previously been successfully used to experimentally validate indexing and view materialization strategies for XML data warehouses [13]. Eventually, a raw, preliminary version of XWeB (warehouse, workload, Java interface and source code) is freely available online9 as an Eclipse10 project. A more streamlined version is in the pipe and will be distributed under Creative Commons licence11 . After having designed a benchmark modeling business data (which XWeB aims to be), it would be very interesting in future research to also take into account the invaluable business information that is stored into unstructured documents. Hence, including features from, e.g., XBench into XWeB would help improve a decision support benchmark’s XML specificity. Since the XQuery Update Facility has been issued as a candidate recommendation by the W3C [6] and is now implemented in many XML DBMSs (e.g., eXist, BaseX, xDB, DB2/PureXML, Oracle Berkeley DB XML...), it will also be important to include update operations in our workload. The objective is not 9 10 11
http://ena-dc.univ-lyon2.fr/download/xweb.zip http://www.eclipse.org http://creativecommons.org/licenses/by-nc-sa/2.5/
X-Hive
Sedna
Workload execution time (ms)
16000000 14000000 12000000 10000000 8000000 6000000 4000000 2000000 0 100
250
500
1000
2000
Number of facts
Fig. 9. 1D performance test results
necessarily to feature full ETL testing capability, which would presumably necessitate a dedicated benchmark (Section 4.1), but to improve workload relevance with refreshing operations that are casual in data warehouses, in order to challenge system response and management of redundant performance optimization structures such as indexes and materialized views. The core XWeB workload (i.e., read accesses) shall also be given attention. It has indeed been primarily designed to test scaling up. Filter factor analysis of queries [16] and experimental feedback should help tune it and broaden its scope and representativity. Moreover, we mainly focus on cube-like aggregation queries in this version. Working on the output cubes from these queries might also be interesting, i.e., by applying other usual XOLAP operators such as slice & dice or rotate that are easy to achieve in XQuery [9]. Finally, other performance metrics should complement response time. Beyond composite metrics such as TPC benchmarks’, we should not only test system response, but also the quality of results. As we underlined in Section 4.3, complex grouping XQueries may return false answers. Hence, query result correctness or overall correctness rate could be qualitative metrics. Since several XQuery extension proposals do already support grouping queries and OLAP operators [2,9,12,26], we definitely should be able to test systems in this regard.
References 1. Afanasiev, L., Manolescu, I., Michiels, P.: MemBeR: A Micro-benchmark Repository for XQuery. In: 3rd International XML Database Symposium on Database and XML Technologies (XSym 05), Trondheim, Norway. LNCS, vol. 3671, pp. 144–161 (2005)
Sedna
X-Hive
BaseX
Workload execution time (ms)
400000000 350000000 300000000 250000000 200000000 150000000 100000000 50000000 0 100
250
500
1000
2000
Number of facts
Fig. 10. CH performance test results
¨ 2. Beyer, K.S., Chamberlin, D.D., Colby, L.S., Ozcan, F., Pirahesh, H., Xu, Y.: Extending XQuery for Analytics. In: 2005 ACM SIGMOD International Conference on Management of Data (SIGMOD 05), Baltimore, USA. pp. 503–514 (2005) 3. Boag, S., Chamberlin, D., Fern´ andez, M., Florescu, D., Robie, J., Sim´eon, J.: XQuery 1.0: An XML Query Language. www.w3.org/TR/xquery/ (2007) 4. B¨ ohme, T., Rahm, E.: Multi-user Evaluation of XML Data Management Systems with XMach-1. In: Efficiency and Effectiveness of XML Tools and Techniques and Data Integration over the Web. LNCS, vol. 2590, pp. 148–158 (2003) 5. Bressan, S., Lee, M.L., Li, Y.G., Lacroix, Z., Nambiar, U.: The XOO7 Benchmark. In: Efficiency and Effectiveness of XML Tools and Techniques and Data Integration over the Web. LNCS, vol. 2590, pp. 146–147 (2003) 6. Chamberlin, D., Dyck, M., Florescu, D., Melton, J., Robie, J., Sim´eon, J.: XQuery Update Facility 1.0. www.w3.org/TR/xquery-update-10/ (2009) 7. Darmont, J., Bentayeb, F., Boussaid, O.: Benchmarking data warehouses. International Journal of Business Intelligence and Data Mining 2(1), 79–104 (2007) 8. Gray, J.: The Benchmark Handbook for Database and Transaction Processing Systems. Morgan Kaufmann, second edn. (1993) 9. Hachicha, M., Mahboubi, H., Darmont, J.: Expressing OLAP operators with the TAX XML algebra. In: 3rd International Workshop on Database Technologies for Handling XML Information on the Web (EDBT/DataX 08), Nantes, France (2008) 10. H¨ ummer, W., Bauer, A., Harde, G.: XCube: XML for data warehouses. In: 6th International Workshop on Data Warehousing and OLAP (DOLAP 03), New Orleans, USA. pp. 33–40 (2003) 11. Kimball, R., Ross, M.: The Data Warehouse Toolkit: The Complete Guide to Dimensional Modeling. Wiley, Hoboken, NJ, USA, second edn. (2002) 12. Kit, C., Amagasa, T., Kitagawa, H.: Algorithms for structure-based grouping in XML-OLAP. International Journal of Web Information Systems 5(2), 122–150 (2009)
13. Mahboubi, H., Darmont, J.: Benchmarking XML data warehouses. In: 1st Workshop on Decisional Systems (MCSEAI/ASD 06), Agadir, Morocco (2006) 14. Mahboubi, H., Ralaivao, J.C., Loudcher, S., Boussaid, O., Bentayeb, F., Darmont, J.: X-WACoDa: An XML-based approach for Warehousing and Analyzing Complex Data, pp. 38–54. Advances in Data Warehousing and Mining, IGI (2009) 15. OLAP Council: APB-1 OLAP Benchmark Release II. www.olapcouncil.org (1998) 16. O’Neil, P., O’Neil, E., Chen, X., Revilak, S.: The Star Schema Benchmark and Augmented Fact Table Indexing. In: 1st TPC Technology Conference on Performance Evaluation & Benchmarking (TPCTC 09), Lyon, France. LNCS, vol. 5895, pp. 237–252 (2009) 17. Pokorn´ y, J.: XML Data Warehouse: Modelling and Querying. In: 5th International Baltic Conference (BalticDB&IS 02), Tallin, Estonia. pp. 267–280 (2002) 18. Rizzi, S.: Conceptual Modeling Solutions for the Data Warehouse, pp. 1–26. Data Warehouses and OLAP: Concepts, Architectures and Solutions, IRM Press, Hershey, PA, USA (2007) 19. Runapongsa, K., Patel, J.M., Jagadish, H.V., Chen, Y., Al-Khalifa, S.: The Michigan benchmark: towards XML query performance diagnostics. Information Systems 31(2), 73–97 (2006) 20. Schmidt, A., Waas, F., Kersten, M.L., Carey, M.J., Manolescu, I., Busse, R.: Assessing XML Data Management with XMark. In: Efficiency and Effectiveness of XML Tools and Techniques and Data Integration over the Web. LNCS, vol. 2590, pp. 144–145 (2003) 21. Simitsis, A., Vassiliadis, P., Dayal, U., Karagiannis, A., Tziovara, V.: Benchmarking ETL Workflows. In: 1st TPC Technology Conference on Performance Evaluation & Benchmarking (TPCTC 09), Lyon, France. LNCS, vol. 5895, pp. 199–220 (2009) 22. Thomsen, E.: Comparing different approaches to OLAP calculations as revealed in benchmarks. Intelligence Enterprise’s Database Programming & Design. www.dbpd.com/vault/9805desc.htm (1998) 23. Torlone, R.: Conceptual Multidimensional Models, pp. 69–90. Multidimensional Databases: Problems and Solutions, IDEA (2003) 24. Transaction Processing Performance Council: TPC Benchmark DS (Decision Support) Draft Specification revision 32. www.tpc.org/tpcds/ (2005) 25. Transaction Processing Performance Council: TPC Benchmark H Standard Specification Revision 2.8.0. www.tpc.org/tpch/ (2008) 26. Wiwatwattana, N., Jagadish, H.V., Lakshmanan, L.V.S., Srivastava, D.: X∧ 3: A Cube Operator for XML OLAP. In: 23rd International Conference on Data Engineering (ICDE 07), Istanbul, Turkey. pp. 916–925 (2007) 27. Wyatt, L., Caufield, B., Pol, D.: Principles for an ETL Benchmark. In: 1st TPC Technology Conference on Performance Evaluation & Benchmarking (TPCTC 09), Lyon, France. LNCS (2009) ¨ 28. Yao, B.B., Ozsu, M.T., Khandelwal, N.: XBench Benchmark and Performance Testing of XML DBMSs. In: 20th International Conference on Data Engineering (ICDE 04), Boston, USA. pp. 621–633 (2004) 29. Zhang, J., Wang, W., Liu, H., Zhang, S.: X-warehouse: building query patterndriven data. In: 14th international conference on World Wide Web (WWW 05), Chiba, Japan. pp. 896–897 (2005)