Simulators range in fidelity from desktop driving simulators to multi-axis ... some cases, a confederate vehicle is used to create a specific driving scenario of.
Driver Measurement: Methods and Applications Shane McLaughlin, Jonathan Hankey, and Thomas Dingus Virginia Tech Transportation Institute 3500 Transportation Research Dr Blacksburg VA, 24061 {smclaughlin,jhankey,tdingus}@vtti.vt.edu
Abstract. This paper presents an overview of methods used when measuring driver behavior and performance. Simulators, test-track, on-road, field-operational-trials, and naturalisitic methods are described. Useful driver measures are described. Three examples are provided of the application of driver measurement in product design and evaluation. Keywords: driver, behavior, performance, measurement.
1 Methods The objective of this paper is to provide an overview of methods used for measuring driver behavior and performance. Driver behavior refers to tasks or actions, including both driving-related activities as well as non-driving-related activities. Driver performance refers to the human perceptual and physical capabilities and limitations that affect safe driving. In the second section of the paper, a set of applications are presented to illustrate types of driver measurement and how they are used. 1.1 Study Methods Methods used to study driver behavior can be considered on a continuum. At one end are the controlled studies. These are studies of driving that follow the methods used in traditional experimental research. In these driving studies, two or more conditions are created (manipulated), while as many extraneous factors as possible are controlled, and measures are collected to evaluate the driver’s response to the conditions. The controls present in these studies can limit the ability to generalize to the complete set of conditions that occur in the real world. At the other end of the continuum, minimal or no instruction is given to drivers and they are measured as they perform the things they normally do while driving. In these naturalistic studies, fidelity to real world driving is high, but isolating relationships between factors is more difficult. Driver measurement in simulators, on test tracks, on-road, in fieldoperational-trials, and in naturalistic driving studies describes the range of control and realism found in most driving studies. Simulators. Simulators range in fidelity from desktop driving simulators to multi-axis motion simulators with 360 degrees of display and a range of visual, auditory, and D. Harris (Ed.): Engin. Psychol. and Cog. Ergonomics, HCII 2009, LNAI 5639, pp. 404–413, 2009. © Springer-Verlag Berlin Heidelberg 2009
Driver Measurement: Methods and Applications
405
tactile feedback to the driver [1]. The value of simulators in driving research is that conditions can be controlled precisely and the driver can be tested in conditions which would be hazardous if not created through simulation. The disadvantage of simulators is the difficulty in quantifying how well simulator results will transfer to real driving results. Test Track. Test tracks provide some of the realism of on-road driving, while still permitting experimental and safety controls. Test tracks can be used to measure general driving behavior or to present scripted scenarios and measure performance. When controlling the vehicle on a test track, the driver must remain involved in the driving task. As with simulators, however, the degree to which test-track driving creates the same driving burden as real road driving depends on execution. Factors such as the expectations of participants, presence of experimenters, level of traffic, and test track design should be considered along with the research question. For example, if the research question requires that the participant maintain a thorough visual scan around the vehicle, it may be necessary to include other traffic or pedestrians in the experimental protocol. On-Road. Some tests relating to driving do not require the safety controls or experimental controls provided by a test track or simulator. When the system being tested and the testing methodology have minimal impact on the participant’s normal driving, testing on public roadways is possible. Examples of these situations include testing simple center stack interfaces or testing design iterations that are only a small change from currently common in-vehicle systems. In these cases, on-road protocols provide increased face validity because the driver is aware that the typical driving hazards are present, and so must maintain vigilance and control during the study. In some cases, a confederate vehicle is used to create a specific driving scenario of interest. For example, an experimenter in a lead vehicle might gradually reduce speed, and in doing so, elicit a pass maneuver from the participant. Field Operational Trial. A Field Operational Trial (FOT) is a study in which a developmental system is incorporated into a vehicle and the vehicle is put into normal use in the field as measurements are collected related to the system of interest. FOTs often involve different design alternatives. The Advanced Collision Avoidance System (ACAS) FOT provides a good example of an FOT [2]. In this FOT, 11 Buick LeSabres were provided to 96 participants, accumulating approximately 137,000 miles of driving with development ACASs installed on the vehicles. For most FOTs, data collection for one participant might last for two to six weeks. In many cases, the vehicles used in an FOT will not be the participant’s personal vehicle. This is generally due to logistical reasons. The systems being tested are new systems which are difficult to add to someone’s current vehicle. Additionally, until recently, instrumenting a personal vehicle for a short period was cost prohibitive. The advantage of the FOT is that the driving environment is real. FOTs provide an excellent approach for investigating driver behavior with specific systems of interest. The FOT driving is likely different from everyday driving due to the presence of the test system, newness of the vehicle, and lack of ownership of the vehicle. The duration of the driving time for a participant may not create exposure to a complete
406
S. McLaughlin, J. Hankey, and T. Dingus
set of driving scenarios. For example, some participants might only experience summer driving during the study, while others might only experience winter driving. Additionally, for participants to use a system on the open road, it must be at the final stages regarding safety testing. For this reason, FOTs are generally not feasible until somewhat late in the product development process. Naturalistic. Naturalistic driving studies involve instrumenting participants’ own vehicles and measuring driver behavior and performance over extended periods. In a naturalistic study, no specific instructions are given to the participant and disturbance of their daily routine is minimized. Instrumentation is generally inconspicuous and includes multiple video views, forward radar, accelerations, speed, pedal actuation, latitude and longitude. The first driving study of this type recorded approximately 2 million miles of driving from more than 100 vehicles for 12-13 months [3]. In this study, data were recorded continuously. In some studies, triggering is used which attempts to retain only events of interest, and so reduce data storage requirements. The advantages of naturalistic studies are that the driving data that are collected represent real world driving and any situation in which a driver finds himself or herself. In the Dingus et al. study, 69 crashes of various types and severities were captured. When continuous data are collected, data describing routine driving are available for use in quantifying exposure to different conditions. This tends to be of value in determining event rates, estimating risk, or for comparing what occurs in challenging events to more routine situations. The disadvantages of naturalistic driving studies are that conditions are uncontrolled and project setup and management can be fairly complex compared to other approaches. 1.2 Measures Within the four study methods, many different driving measures can be used. The next sections of the paper introduce these measures and provide some background on their use. Glance. Due to the highly visual information content employed in driving, monitoring the eyes is considered valuable for making a number of inferences. Wickens [4] begins his discussion of the selective nature of attention with discussion of our visual field and visual sampling behavior. He indicates that gaze direction is indicative of direction of attention. Different search behaviors are also indicative of the nature of a task. An ordered movement of the eyes from fixation to fixation is indicative of a supervisory level of attention where the operator has a developed mental model of the task and associated expectancies about where the most useful information will occur. A more random search pattern is indicative of a target search where the location of information is unknown. Glance locations generally include driving-related locations, including the forward road scene, mirrors, and depending on the method of monitoring the eyes and reducing data, can include specific exterior objects or gaze location measured on some coordinate system. When approaching curves, drivers look to the tangent point of the curve and the proportion of glances to the curve tangent increases rapidly in the 1-2 seconds before it is reached [5]. Glance behavior has also been investigated in terms of driver experience [6, 7], driver route familiarity [8], night versus day [9], mirrors and driving tasks [10], and in-vehicle tasks.
Driver Measurement: Methods and Applications
407
When specific in-vehicle interfaces are of interest, measurements of the gaze to these interfaces or locations in the vehicle are also collected [11]. More time looking ahead is clearly of value. Longer glances and frequent glances to in-vehicle locations increase risk. In measuring glance behavior while driving and in the presence of secondary tasks, total glance time, mean single glance time, and number of glances are considered surrogate measures of safety. In other words, because safety is difficult to measure directly, they are measured to provide an indication of safety. In-vehicle tasks should not require glances away from forward longer than approximately 1.6 seconds [12]. Tijerina [13] used glance behavior in a unique way by exploring carfollowing measures at the instant drivers look away from the forward scene. Task. A frequent part of driver measurement involves collecting information about tasks that drivers perform. These may be driving-related tasks, such as turning across traffic at an intersection, or analyses of secondary tasks, such as selecting a song from a music player. When investigating some in-vehicle system, driving performance measures are monitored for degradation. In addition to the visual measurements described in the previous sections, driving-related task measurements generally relate to safety measures, such as unplanned lane departures, abrupt maneuvers, or late reactions. Task measurement can also use many of the techniques used for task analyses in non-driving applications, such as counting the number of steps, errors, task duration, etc. In some cases, due to the difficulty of monitoring a driver’s readiness to respond to critical events, a peripheral detection task [14] is used in which the driver’s ability to detect events outside the vehicle is measured while interacting with some in-vehicle system. Speed and Braking. Speed is an obvious indicator of many aspects of driver behavior and performance. Drivers tend to reduce speed as workload increases [15]. How drivers adjust speed is considered indicative of a number of factors. Summala [16] indicates that speed adjustment can relate to motivation level, including motivations other than transportation related, or subjective risk perception. Speed is the main variable that captures the kinematics of the driving situation. Abrupt decelerations tend to indicate late recognition of a situation or insufficient monitoring of speed and distance. Comfortable decelerations on surface streets range from approximately 0.15g to 0.4g [17]. However, naturalistic driving studies indicate that braking at 0.6g or higher is common, depending on the driver and the driving situation [3]. On freeways, where speeds are higher, decelerations of 0.1g to 0.2g can be considered high [17, 18]. Range, Range Rate, and Time-to-Collision. Forward measures to a lead vehicle are of value in a number of investigations. In general, the range to lead vehicles, when considered simultaneously with the range rate (i.e., closing or separating speeds), provides an indication of severity, aggressiveness, or criticality. Range also provides a coordinate system on which the interaction between the participant’s vehicle and other vehicles, objects or pedestrians can be analyzed for many different driving investigations. The addition of range rate permits kinematic analyses of events, the timing of actions, and estimation of alternative outcomes. A short range with a high
408
S. McLaughlin, J. Hankey, and T. Dingus
closing range rate tends to be a risky situation. As drivers close on lead vehicles, they must either decelerate or overtake. More aggressive drivers will demonstrate these interactions more frequently than a more conservative driver. When range is divided by negative range rate, it indicates the time-to-collision (TTC) if path or speed is not altered. Note that the TTC calculation does not include acceleration of the lead or following vehicle. For this reason, it only provides an instantaneous assessment of TTC. If the lead vehicle is braking hard, and the following vehicle is not, the time available will be shorter than this TTC computation indicates. Investigations involving this type of braking should include acceleration in the computation of TTC. Following. When measuring more steady state following situations, headway is generally used. If one vehicle is following another and range is divided by the speed of the following vehicle, the value indicates headway. Similar to TTC, headway is a time-based measure which accounts for speed. Headway is the value often provided in driver training, in which a time-based following distance is recommended for safety (e.g., 2 seconds or 1 car length for every 16 km/h (10 mi/h)). Headway is different from TTC in that it indicates the time available for the following driver to match a deceleration of a lead vehicle. Forbes [19] indicated that drivers are following, i.e. responding to lead vehicle speed and distance, when headway is between 0.5 and 4 seconds. At longer headways, the following vehicle is involved in overtaking and not directly adjusting speed to match the lead vehicle. Brackstone et al. [17, 20, 21] have done considerable work describing how drivers adjust to and follow a lead vehicle. Steering. Steering provides a good measure of driving performance. Smooth and continuous inputs are considered indicative of driver preview of the roadway. When steering is smooth, no error has been allowed to build up between where a driver wants the vehicle to track and where it is tracking. When an error in lateral position is detected or anticipated by a driver, a correction is made. These corrections, often referred to as “steering reversals,” can be used as a measure of the difficulty a driver is having in maintaining lateral position [22, 23]. Measurement of steering has also been used to monitor workload or attention of the driver when additional task demands are present, either from driving conditions or secondary tasks [24, 25]. Lane Keeping. As introduced in the description of steering, the layout of the road lines and edges are essentially a display that drivers are tracking. When a vehicle exceeds a lane boundary, it is generally considered an indication of poor driving performance. The standard deviation of lane position is a measure of the lateral range within which a driver is holding the vehicle. A limitation of lane position as a measure is that there is discussion around the objectives drivers employ in tracking and what to judge as poor performance. For example, wandering left from one lane into a lane in the same direction on a highway with no other cars around may be acceptable and is probably more acceptable than wandering to the right onto the shoulder. Related to this, it is likely that the experienced driver does not continuously pursue some precise lane position, but instead seeks to maintain the vehicle within some satisfactory range [26].
Driver Measurement: Methods and Applications
409
Lateral Acceleration. Lateral acceleration is used in a similar manner as longitudinal acceleration. Percentiles are typically used to quantify what is comfortable for drivers, but variability in driving situations restricts the use of this measure alone. Lateral accelerations at one speed may be comfortable, while at higher speeds they would not be. Observed lateral accelerations exceeding some level are considered a possible indication of failure to select an appropriate speed for a given situation. Incident or Event. While much of driving is routine, at times an unexpected event will occur. Measures of driver performance in these situations provide both system design guidance and a method for evaluating the readiness of drivers to respond to unexpected situations. Response is considered to be composed of detection, recognition, decision, and movement. In the actions of drivers, these phases of response are often not clearly defined. For example, as a driver detects something ahead, he or she may begin a movement, such as reducing pressure on the gas pedal, before fully determining what the object is, what path it may be following, and what the best final response would be. Olson and Sivak [27] measured perception time as time to release the accelerator, reaction time as time from releasing the accelerator to pressing the brake, and the total time (perception response time) for drivers detecting an object in the road ahead. Lerner [28] measured response time of different age groups when a barrel was released into the road. Measurements of driver braking and steering response while using anti-lock braking systems have been collected in the simulator [29] and on the test track [30]. Response effectiveness and timing vary with factors including driver expectations, stimuli and number of alternatives [4].
2 Applications The following three applications provide examples of how some of the measurements that have been described can be used to guide product design. 2.1 Navigation System Evaluation In the early days of in-vehicle navigation systems, a number of safety-related questions were posed regarding different design alternatives. An on-road study was conducted to determine if any of the navigation configurations would result in an unsafe driving behavior [11]. Driving was measured in the presence of five different navigation system alternatives, as well as use of a conventional paper map. Driving performance measures included the number of crashes, assessment of crashes causal factors, eye glance duration, abrupt lateral maneuvers, abrupt braking maneuvers, unplanned lane deviation, dangerously close headways, turn tracking errors, unsafe intersection behavior, late/inappropriate reaction to an external event, unplanned speed variation greater than 16 km/h (10 mi/h), and stopping in unsafe circumstances. This research was used by the system manufacturer for optimizing their system, and by the federal government to evaluate the safety of a new in-vehicle system. 2.2 Risk Perception in Car Following While systems which warn or intervene in critical events have received attention for sometime, a number of vehicle systems are in development that are intended to
410
S. McLaughlin, J. Hankey, and T. Dingus
Range (m)
30 20 10
Range Rate (m/s)
0
24
26
28
30
32
34
36
38
40
42
24
26
28
30
32
34
36
38
40
42
24
26
28
30
32 34 Time (s)
36
38
40
42
2
0
-2
TTC (s)
100
0
-100
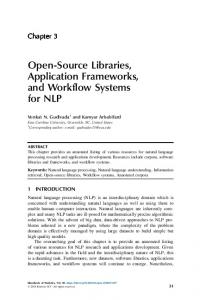
Fig. 1. Range, Range Rate, and TTC shown over time (x-axis). As range decreases, a negative range rate is created, and TTC approaches some minimum until range stops decreasing.
Seconds per hour in bin
30 25 Young 20
Old
15 10 5
0-0.5 0.5-1 1-1.5 1.5-2 2-2.5 2.5-3 3-3.5 3.5-4 4-4.5 4.5-5 5-5.5 5.5-6 6-6.5 6.5-7 7-7.5 7.5-8 8-8.5 8.5-9 9-9.5 9.5-10
0
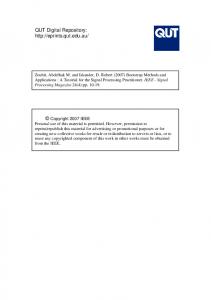
TTC (s) Fig. 2. The distribution of time spent at TTCs between 0 and 10 seconds are shown for younger and older drivers
support drivers in a more ongoing manner. As with most human-centered systems, a good reference point for design is to measure how people currently do things. To develop this type of understanding in relation to TTC, previously collected naturalistic driving data were used [31]. In Figure 1, the two component measures of TTC are shown over time (i.e. range and range rate), followed by the computed value of TTC in the third plot.
Driver Measurement: Methods and Applications
411
In the figure, between approximately 29 sec and 32 sec, as the instrumented following vehicle approaches a lead vehicle, TTC decreases to some minimum as shown. When vehicles begin separating, TTC has a singularity as range rate passes through zero, and then TTC is negative as the vehicles separate. In 8203 trips from vehicles in the 100-Car Naturalistic Driving Study [3], following was first identified by locating oscillations in following distance behind a lead vehicle. Then, TTC measures were collected at each 0.1-sec time sample. These intermediate data were used to create a distribution of the amount of time spent in 0.5-sec time bins for a younger age group (19-24 yrs) and an older age group (56-68 yrs) (see Fig. 2). Though not exactly how a driver would want an automated system to operate, these curves provide guidance as to the frequencies these two groups of drivers experience TTCs between 10 sec and 0 sec. Due to individual differences, it is likely that different drivers have different comfort levels and preferences. 2.3 Target Detection with Swiveling Headlamps Headlamps that swivel have been of interest for many years as a potential way of putting light on the vehicle’s path of travel earlier than is possible with non-swiveling headlamps. In a study conducted on public roads, McLaughlin et al. [32] placed 18 cm × 18 cm targets along the roadway and measured the distance at which participants detected the targets with swiveling and with non-swiveling high intensity discharge headlamps. The targets were placed in right and left curves of radii between 20-50 m (e.g., intersections) and 215 m. In addition to target detection distances, driving performance measures including speed, speed variance, longitudinal and lateral acceleration, steering variance, and yaw rate were collected. The first iteration of the study indicated that while target detection distances were greater with the swiveling lamps in left hand turns, in right hand turns the detection distances where shorter. These results, particularly when identified with the curve radii in which the differences were found, provided guidance to system engineers. After modifying the algorithm that controlled the swiveling, the study was repeated. With the modifications, the benefits found in left hand turns were maintained and performance in right hand turns was equivalent to performance without swiveling headlamps.
3 Summary The measures described here provide a starting point for quantifying driver behavior and performance. Selection of the best measures depends on the questions that must be answered. Similarly, a range of methodologies are available to researchers and practitioners. For most questions, a trade-off is present between control of conditions and fidelity to real world driving. Controlled methodologies are more powerful for identifying differences between conditions, but it may be difficult to determine how well the results reflect real world outcomes. Naturalistic studies capture what occurs in real world driving, but may have difficulty isolating what factors are influencing behaviors and performance.
412
S. McLaughlin, J. Hankey, and T. Dingus
References 1. Hoffman, J.D., Lee, J.D., Brown, T.L., McGehee, D.V.: Comparison of Driver Braking Responses in a High-Fidelity Simulator and on a Test Track. Transportation Research Record 1803, 59–65 (2002) 2. Kiefer, R., Cassar, M.T., Flannagan, C.A., LeBlanc, D.J., Palmer, M.D., Deering, R.K., Shulman, M.A.: Forward Collision Warning Requirements Project: Refining the Camp Crash Alert Timing Approach by Examining “Last-Second” Braking and Lane Change Maneuvers under Various Kinematic Conditions (DOT HS 809 574) National Highway Traffic Safety Administration (2003) 3. Dingus, T.A., Klauer, S.G., Neale, V.L., Peterson, A., Lee, S.E., Sudweeks, J., Perez, M.A., Hankey, J., Ramsey, D., Gupta, S., Bucher, C., Doerzaph, Z.R., Jarmeland, J., Knipling, R.R.: The 100-Car Naturalistic Driving Study, Phase II - Results of the 100-Car Field Experiment, Washington, D.C. National Highway Traffic Safety Administration (2006) 4. Wickens, C.: Engineering Psychology and Human Performance, 2nd edn. HarperCollins, New York (1992) 5. Land, M.F., Lee, D.N.: Where We Look When We Steer. Nature 369 (1994) 6. Mourant, R.R., Rockwell, T.H.: Strategies of Visual Search by Novice and Experienced Drivers. Human Factors 14(4), 325–335 (1972) 7. Summala, H., Nieminen, T., Punto, M.: Maintaining Lane Position with Peripheral Vision During in-Vehicle Tasks. Human Factors 38(3), 442–451 (1996) 8. Mourant, R.R., Rockwell T.H., Rackoff N.J.: Drivers’ Eye Movements and Visual Workload. Highway Research Record, Washington, DC, pp. 1-10 (1969) 9. Rackoff, N.J., Rockwell T.H.: Driver Search and Scan Patterns in Night Driving. Driver Visual Needs in Night Driving - Trb. Special Report 156, Washington, D.C., Transportation Research Board (1974) 10. Mourant, R.R., Donohue, R.J.: Mirror Sampling Characteristics of Drivers (Sae 740964). Society of Automotive Engineers, Warrendale, pp. 1–12 (1974) 11. Dingus, T.A., McGehee, D.V., Hulse, M.C., Jahns, S., Manakkal, N., Mollenhauer, M., Fleischman, R.: Travtek Evaluation Task C3 - Camera Car Study (FHWA-RD-94-076) Federal Highway Administration (1995) 12. Wierwille, W.: Visual and Manual Demands of In-Car Controls and Displays. In: Peacock, B., Karwowski, W. (eds.) Automotive Ergonomics, pp. 299–320. Taylor & Francis, Washington (1993) 13. Tijerina, L.: Driver Eye Glance Behavior During Car Following on the Road. In: Society of Automotive Engineers, Warrendale PA (1999) 14. Winsum, W., van Martens, M., Herland, L.: The Effects of Speech Versus Tactile Driver Support Messages on Workload, Driver Behaviour and User Acceptance (TNO report TM99-C043). TNO Human Factors, Soesterberg (1999) 15. Newcomb, T.P.: Driver Behavior During Braking (Sae 810832). Society of Automotive Engineers, Warrendale (1981) 16. Summala, H.: Risk Control Is Not Risk Adjustment: The Zero-Risk Theory of Driver Behavior and Its Implications. Ergonomics 31(4), 491–506 (1988) 17. McLaughlin, S., Serafin, C.: On-Road Investigation of Driver Following and Deceleration on Surface Streets. In: Proceedings of the IEA 2000/HFES 2000 Congress, pp. 3-294–3297 (2000) 18. Brackstone, M.A., Waterson, B., McDonald, M.: Determinants of Following Headway in Congested Traffic. Transportation Research Part F 2(12), 131–142 (2009)
Driver Measurement: Methods and Applications
413
19. Forbes, T.W.: Human Factors in Highway Traffic Safety Research. Wiley-Interscience, Hoboken (1972) 20. Brackstone, M.A., McDonald, M.: Car-Following: A Historical Review. Transportation Research Part F 2, 181–196 (1999) 21. Brackstone, M.A., Sultan, B., McDonald, M.: Motorway Driver Behavior: Studies on Car Following. Transportation Research Part F 5, 31–46 (2002) 22. McLean, J.R., Hoffmann, E.R.: The Effects of Lane Width on Driver Steering Control and Performance (Paper No. 881). ARRB Proceedings 6(3), 418–440 (1972) 23. McLean, J.R., Hoffmann, R.: Steering Reversals as a Measure of Driver Performance and Steering Task Difficulty. Human Factors 17(3), 248–256 (1975) 24. Macdonald, W.A., Hoffmann, E.R.: Review of Relationships between Steering Wheel Reversal Rate and Driving Task Demand. Human Factors 22(6), 733–739 (1980) 25. Nakayama, O., Futami, T., Nakamura, T., Boer, E.: Development of a Steering Entropy Method for Evaluating Driver Workload. SAE, Warrendale (1999) 26. McLean, J.R., Hoffmann, R.: Steering Reversals as a Measure of Driver Performance and Steering Task Difficulty. Human Factors 17(3), 248–256 (1975) 27. Olson, P.L., Sivak, M.: Perception-Response Time to Unexpected Roadway Hazards. Human Factors 28(1), 91–96 (1986) 28. Lerner, N.D.: Brake Perception-Reaction Times of Older and Younger Drivers. In: Proceedings of the 37th Annual Meeting Human Factors and Ergonomics Society, pp. 206–210 (1993) 29. Mazzae, E., Baldwin, G.H.S., McGehee, D.V.: Driver Crash Avoidance Behavior with Abs in an Intersection Incursion Scenario on the Iowa Driving Simulator (1999) 30. McGehee, D.V., Mazzae, E.N., Baldwin, G.H.S.: Driver Reaction Time in Crash Avoidance Research: Validation of a Driving Simulator Study on a Test Track. In: Proceedings of the IEA 2000/HFES 2000 Congress, pp. 320–323 (2000) 31. Yamamura, T., Kuge, N., McLaughlin, S., Hankey, J.: Research on Quantification of Drivers’ Risk Feelings While Car-Following Using Naturalistic Driving Data (JSAE 20085164). Society of Automotive Engineers of Japan (2008) 32. McLaughlin, S., Hankey, J., Green, C., Larsen, M.: Target Detection Distances and Driver Performance With Swiveling HID Headlamps (SAE 2004-01-2258). Society of Automotive Engineers Government/Industry Meeting, Washington DC (2004)


![Microeconometrics : Methods and Applications [PDF]](https://m.moam.info/img/260x300/microeconometrics-methods-and-applications-pdf_64813007098a9e005a8b45ef.jpg)